. 2024 Oct 16:15:1451725.
doi: 10.3389/fimmu.2024.1451725. eCollection 2024.

Comprehensive analysis of lactylation-related gene sets and mitochondrial functions in gastric adenocarcinoma: implications for prognosis and therapeutic strategies

Affiliations

Comprehensive analysis of lactylation-related gene sets and mitochondrial functions in gastric adenocarcinoma: implications for prognosis and therapeutic strategies

Xindong Yin et al. Front Immunol. .

Abstract

Gastric adenocarcinoma (STAD) is characterized by high heterogeneity and aggressiveness, leading to poor prognostic outcomes worldwide. This study explored the prognostic significance of lactylation-related gene sets and mitochondrial functions in STAD by integrating large-scale genomic datasets, including TCGA and several GEO datasets. We utilized Spatial transcriptomics and single-cell RNA sequencing to delineate the tumor microenvironment and assess the heterogeneity of cellular responses within the tumor. Additionally, the study identified distinct molecular subtypes within STAD that correspond with unique survival outcomes and immune profiles, enhancing the molecular classification beyond current paradigms. Prognostic models incorporating these molecular markers demonstrated superior predictive capabilities over existing models across multiple validation datasets. Furthermore, our analysis of immune landscapes revealed that variations in lactylation could influence immune cell infiltration and responsiveness, pointing towards novel avenues for tailored immunotherapy approaches. These comprehensive insights provide a foundation for targeted therapeutic strategies and underscore the potential of metabolic and immune modulation in improving STAD treatment outcomes.

Keywords: gastric adenocarcinoma; lactylation; mitochondrial dysfunction; prognostic biomarkers; tumor microenvironment.


Conflict of interest statement

The authors declare that the research was conducted in the absence of any commercial or financial relationships that could be construed as a potential conflict of interest.

Figures

Figure 1
Figure 1
(A) Relative expression of PTMA in adjacent normal tissues and tumor tissues: The comparison was made between adjacent normal tissues (blue) and tumor tissues (red). Statistical significance: “**” indicates p < 0.01 between adjacent and tumor groups. (B) Relative expression of PTMA in different cell lines: The comparison was made between the normal gastric mucosa cell line GES-1 (blue) and gastric cancer cell lines AGS (red), NCI-N87 (green), BGC-823 (purple), and MKN45 (orange). Statistical significance: “**” indicates p < 0.01 compared to GES-1. “**” denotes statistical significance (“*” p < 0.05, “**” p < 0.01). Sample sizes are indicated within the plots. Statistical comparisons were made using the Student’s t-test.
Figure 2
Figure 2
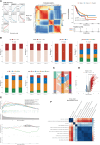
Characterization of target gene sets. (A) Correlation heatmap between 332 lactylation genes and 170 mitochondrial-related gene sets. (B) Volcano plots were generated to illustrate the differential expression of lactylation genes between tumors and adjacent normal tissues in the TCGA, GSE55696, and GSE79973 datasets. (C) Heatmap of expression correlation of differential genes across TCGA, GSE55696, and GSE79973. (D) Forest plot of hazard ratios (HR) for the combined analysis in TCGA and five GEO validation datasets.
Figure 3
Figure 3
Functional characterization and molecular subtyping. (A) NMF clustering results, consistency heatmap, and survival analysis for 12 prognostic genes. Clusters C1, C2, and C3 represent gene clusters identified based on expression patterns in the cohort. The clustering was performed using hierarchical clustering, and the genes within each cluster exhibit distinct expression profiles. (B) Bar charts of clinical indicators such as age, gender, stage, and pathological grading in NMF subgroups. (C) Sankey diagram showing the composition of immune subtyping from TCGA and NMF grouping. (D) Volcano plot of gene differences between groups C1 and C3. (E) GSEA plots for upregulated and downregulated genes. (F) Heatmap of pathway enrichments correlated with ssGSEA scores of 12 lactylation genes.
Figure 4
Figure 4
Single-cell analysis of lactylation-related gene expression and its association with immune, epithelial, and stromal cell populations in the tumor microenvironment. (A) Single-cell analysis showing lactylation scores across various cell types, including immune cells, fibroblasts (considered as stromal cells), and epithelial cells, lactylation grouping, UMAP plots of lactylation scores, violin plots of lactylation analysis, and GSEA plots for functional enrichment in high and low lactylation groups. The gradient from blue to cyan reflects a continuum of lactylation levels, indicating transitional states between low (blue) and high (cyan) lactylation scores among the cell populations. (B) H&E staining images of immune, epithelial, and stromal cells and lactylation scores in spatial transcriptomics data. (C) Correlation plots of epithelial (Pearson’s r = -0.21, p < 2.2e-16) and stromal scores (Pearson’s r = 0.53, p < 2.2e-16) with lactylation, curve plots of epithelial, immune, and stromal scores arranged by ascending lactylation, and GSEA plots for high lactylation functional enrichment.
Figure 5
Figure 5
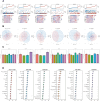
Construction of prognostic models based on differential genes. (A) Heatmap of C-indexes for 101 algorithms and five validation datasets. (B) AUC values for 1, 3, and 5 years across six datasets. (C) Bar chart of the optimal model’s C-index across various datasets. The error bars represent the standard error of the C-index values across these datasets. (D) Survival analysis results for six datasets.
Figure 6
Figure 6
Comparison of prognostic models. (A, B) Risk plots and PCA diagrams for six datasets. Heatmap showing the expression of the 12 prognostic genes across patient samples in the TCGA-STAD cohort. Rows represent genes, and columns represent patient samples. The colors indicate the gene expression levels, with darker colors representing higher expression. The heatmap illustrates the association between gene expression and risk scores. (C) Bar chart of C-indexes comparing risk scores with other clinical indicators. (D) C-index chart comparing our prognostic model with 15 other recent models across six datasets.
Figure 7
Figure 7
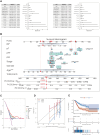
Development of a nomogram model. (A) Forest plots of univariate and multivariate analysis results for risk scores and clinical indicators. (B) Nomogram integrating risk scores with clinical indicators. (C, D) DCA plots and calibration curves for 1, 3, and 5 years. (E) Survival analysis results using Nomogram scoring.
Figure 8
Figure 8
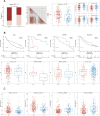
Immune infiltration and tumor mutation burden (TMB) analysis across different risk groups in cancer patients. (A) Boxplot of Risk Scores (RS) across Clusters, Correlation Heatmap of Gene Expression and Boxplot of Log10(TMB) in High vs. Low-Risk Groups. (B) Boxplots of Various Immune Scores in High vs. Low-Risk Groups. StromalScore: Measures the presence of stromal cells in tumor tissue. ImmuneScore: Quantifies the infiltration of immune cells in the tumor microenvironment. ESTIMATEScore: Represents the combined presence of stromal and immune cells. TumorPurity: Estimates the proportion of tumor cells in the sample. Heatmap of Immune Cell Infiltration and ssGSEA Results of Immune Cell Populations. Heatmap showing immune cell infiltration levels across patient samples. Rows represent different immune cell types, and columns represent patient samples. The color intensity reflects the level of immune cell infiltration, with darker colors indicating higher infiltration. This heatmap helps to visualize the relationship between immune infiltration and risk stratification.
Figure 9
Figure 9
Analysis of immune therapy and drug sensitivity. (A) Heatmap of correlations between risk scores and immune checkpoint genes, bar charts for TIDE composition, box plots of TIDE risk values, and IPS box plots. (B) Survival analysis results and risk scores for immune response groups in GSE91061 (lung adenocarcinoma), GSE78220 (lung adenocarcinoma), IMvigor210 (urothelial carcinoma, UC), and Braun (renal cell carcinoma, RCC) datasets. (C) Box plots showing differential sensitivity to Bortezomib_1191, Dactinomycin_1911, Dasatinib_1079, and BMS-754807_2171 between high and low-risk groups.
Figure 10
Figure 10
Differences in cell communication between high and low prognostic risk cells at the single cell level. (A) Bubble plot demonstrating enhanced cell communication differences between high-risk and low-risk groups in myeloid, epithelial, and T&NK cells. (B) A bubble plot illustrates the reduction in cell communication differences between high-risk and low-risk groups in T&NK, myeloid, and epithelial cells.
Figure 11
Figure 11
(A) RT-qPCR detected the knock-down efficiency of PTMA in NCI-N87 and MKN45 cell lines. (B) Cell viability of the MKN45 cell line before and after PTMA knockdown was detected by CCK8. (C) The cell viability of the NCI-N87 cell line before and after PTMA knockdown was detected by CCK8. (D) The apoptosis level of the MKN45 cell line before and after PTMA knockdown was detected by flow cytometry. (E) Western blot analysis assessed the expression of apoptosis-related proteins before and after PTMA knockdown in the MKN45 cell line. “**” denotes statistical significance (“**” p < 0.01). Sample sizes are indicated within the plots. Statistical comparisons were made using the Analysis of Variance (ANOVA).
Figure 12
Figure 12
(A) A Transwell assay detected cell migration and invasion capability alterations before and after PTMA knockdown. (B) The capacity of cells to migrate was tested using the wound healing assay before and after PTMA knockout. (C) Western blot analysis of the changes in the expression levels of invasion and migration-related proteins before and after PTMA knockdown. “**” denotes statistical significance (“**” p < 0.01). Sample sizes are indicated within the plots. Statistical comparisons were made using the ANOVA.

References

    1. Guggenheim DE, Shah MA. Gastric cancer epidemiology and risk factors. J Surg Oncol. (2013) 107:230–6. doi: 10.1002/jso.23262 - DOI - PubMed
    1. Shao W, Yang Z, Fu Y, Zheng L, Liu F, Chai L, et al. . The pyroptosis-related signature predicts prognosis and indicates immune microenvironment infiltration in gastric cancer. Front Cell Dev Biol. (2021) 9:676485. doi: 10.3389/fcell.2021.676485 - DOI - PMC - PubMed
    1. Thrift AP, El-Serag HB. Burden of gastric cancer. Clin Gastroenterol hepatology: Off Clin Pract J Am Gastroenterological Assoc. (2020) 18:534–42. doi: 10.1016/j.cgh.2019.07.045 - DOI - PMC - PubMed
    1. Zeng Y, Jin RU. Molecular pathogenesis, targeted therapies, and future perspectives for gastric cancer. Semin Cancer Biol. (2022) 86:566–82. doi: 10.1016/j.semcancer.2021.12.004 - DOI - PubMed
    1. Karimi P, Islami F, Anandasabapathy S, Freedman ND, Kamangar F. Gastric cancer: descriptive epidemiology, risk factors, screening, and prevention. Cancer epidemiology Biomarkers prevention: Publ Am Assoc Cancer Research cosponsored by Am Soc Prev Oncol. (2014) 23:700–13. doi: 10.1158/1055-9965.epi-13-1057 - DOI - PMC - PubMed

Substances

LinkOut - more resources