. 2024 Oct 30;6(4):zcae042.
doi: 10.1093/narcan/zcae042. eCollection 2024 Dec.

Sensitization of melanoma cells to standard chemotherapy: G-quadruplex binders as synergistic agents

Affiliations

Sensitization of melanoma cells to standard chemotherapy: G-quadruplex binders as synergistic agents

Carolina Persico et al. NAR Cancer. .

Abstract

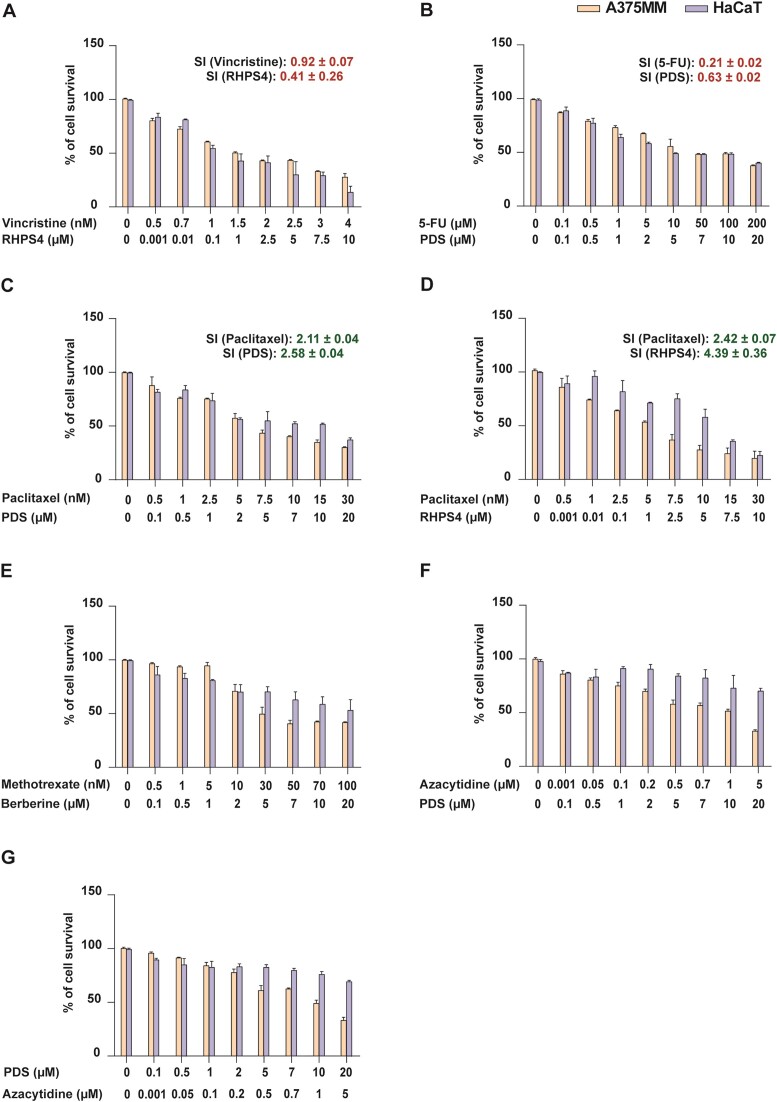
The use of chemotherapeutics has achieved considerable success in cancer therapy; however, their toxicity can severely impact patients' health. In this study, aiming to reduce the doses and potential side effects of traditional chemotherapeutics, we systematically treated A375MM human melanoma cells with seven clinically approved antineoplastic drugs, in combination with three well-characterized G-quadruplex (G4) ligands, using either simultaneous or sequential dosing schedules. Interestingly, the G4 binders synergized with most of the investigated anticancer drugs, with the degree of synergism being strictly dependent on both the treatment schedule and the drug sequence employed. Notably, some of the synergistic combinations showed selective toxicity toward melanoma cells over nontumorigenic human keratinocytes. Furthermore, immunofluorescence experiments highlighted the potential implication of G4 structures in the molecular mechanisms driving the synergistic interaction between some chemotherapeutics and G4 binders. Overall, our systematic study supports the combination of G4-interacting molecules with standard antineoplastic drugs as a promising antitumor strategy.


Figures

Graphical Abstract
Graphical Abstract
Figure 1.
Figure 1.
(A) The guanine tetrad, where M+ is a monovalent cation. (B) An example of G4 structure.
Figure 2.
Figure 2.
Graphic visualization of the CI values obtained from the 48-h simultaneous treatments on A375MM melanoma cells. Histograms show the mean ± standard deviation (SD) of two independent experiments. Calculated CI and IC50 values are reported in Supplementary Tables S1 and S2, whereas MTT data are collected in Supplementary Figures S8–S13.
Figure 3.
Figure 3.
Graphic comparison of the CI values obtained from the simultaneous (bar on the left) and ‘chemotherapeutic → G4 ligand’ sequential (bar on the right) treatments for the associations with (A) berberine, (B) PDS and (C) RHPS4. Histograms show the mean ± SD of two independent experiments. Calculated CI and IC50 values for the ‘chemotherapeutic → G4 ligand’ sequential treatments are reported in Supplementary Tables S6 and S7.
Figure 4.
Figure 4.
MTT cytotoxicity profiles of the seven selected combinations on A375MM melanoma cells and nontumorigenic HaCaT cells, obtained under the same experimental conditions. The IC50 values on A375MM melanoma cells and nontumorigenic HaCaT cells are reported in Supplementary Table S9.
Figure 5.
Figure 5.
(A) Representative fields showing G4 foci formation detected by immunofluorescence in A375MM cells treated for 24 h with 0.1% DMSO (control), 5 nM paclitaxel or 1 μM RHPS4. As for the sequential treatment (P → R), A375MM cells were exposed to 5 nM paclitaxel (for 24 h) followed by 1 μM RHPS4 (for another 24 h). Scale bar: 10 μm. Upper panels: The merged channels of BG4-stained G4 structures (magenta) and Hoechst-counterstained nuclei (gray) are reported. Lower panels: Enlargements from the pictures in the upper panels. (B) Quantitative analysis of the nuclear G4 foci. An average of 60 cells were screened for each condition and the results are expressed as fold change over the negative control (DMSO-treated cells). Histograms show the mean ± SD of two independent experiments. The statistical significance was calculated using a one-way ANOVA test on GraphPad Prism 8.0.2 (**P< 0.01).
Figure 6.
Figure 6.
(A) Representative fields showing G4 foci formation detected by immunofluorescence in A375MM cells treated for 48 h with 0.1% DMSO (control), 10 nM methotrexate, 2 μM berberine or 10 nM methotrexate + 2 μM berberine. Scale bar: 10 μm. Upper panels: The merged channels of BG4-stained G4 structures (magenta) and Hoechst-counterstained nuclei (gray) are reported. Lower panels: Enlargements from the pictures in the upper panels. (B) Quantitative analysis of the nuclear G4 foci. An average of 60 cells were screened for each condition and the results are expressed as fold change over the negative control (DMSO-treated cells). Histograms show the mean ± SD of two independent experiments. The statistical significance was calculated using a one-way ANOVA test on GraphPad Prism 8.0.2 (*P< 0.05).

Similar articles

References

    1. Harris T.J.R., McCormick F. The molecular pathology of cancer. Nat. Rev. Clin. Oncol. 2010; 7:251–265. - PubMed
    1. Anand U., Dey A., Chandel A.K.S., Sanyal R., Mishra A., Pandey D.K., De Falco V., Upadhyay A., Kandimalla R., Chaudhary A. et al. . Cancer chemotherapy and beyond: current status, drug candidates, associated risks and progress in targeted therapeutics. Genes Dis. 2022; 10:1367–1401. - PMC - PubMed
    1. Watson J.D., Crick F.H.C. Molecular structure of nucleic acids: a structure for deoxyribose nucleic acid. Nature. 1953; 171:737–738. - PubMed
    1. Choi J., Majima T. Conformational changes of non-B DNA. Chem. Soc. Rev. 2011; 40:5893. - PubMed
    1. Spiegel J., Adhikari S., Balasubramanian S. The structure and function of DNA G-quadruplexes. Trends Chem. 2020; 2:123–136. - PMC - PubMed

LinkOut - more resources