. 2024 Oct 18;15(44):18295-18302.
doi: 10.1039/d4sc03994g. Online ahead of print.

Energy exchange between Nd3+ and Er3+ centers within molecular complexes

Affiliations

Energy exchange between Nd3+ and Er3+ centers within molecular complexes

Diamantoula Maniaki et al. Chem Sci. .

Abstract

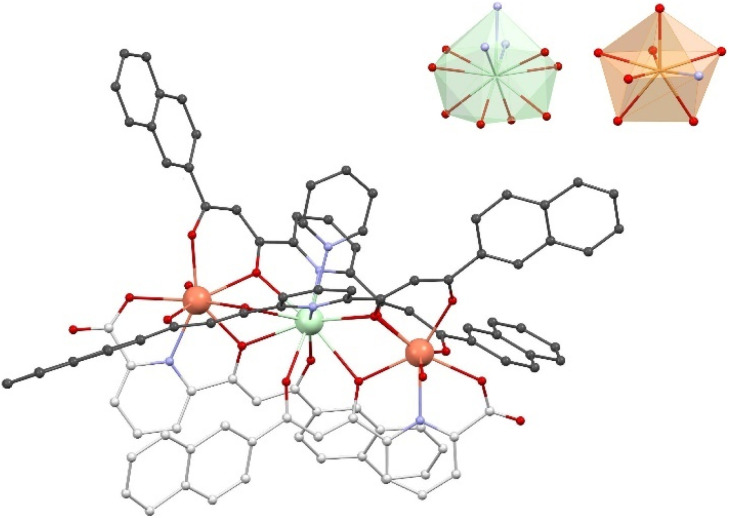
Developing controlled and reproducible molecular assemblies incorporating lanthanide centers is a crucial step for driving forward up- and down-conversion processes. This challenge calls for the development of strategies to facilitate the efficient in situ segregation of different Ln metal ions into distinct positions within the molecule. The unique family of pure [LnLn'Ln] heterometallic coordination compounds previously developed by us represents an ideal platform for studying the desired Ln-to-Ln' energy transfer (ET). In this context, we report here the new pure one-step synthetically produced [ErNdEr] (3) complex, which allows for the first time at the molecular level to study the mechanisms behind Nd-to-Er energy transfer. To further assess the photophysical properties of this complex, the analogous [LuNdLu] (1) and [ErLaEr] (2) complexes have also been prepared and photophysically studied. Efficient sensitization via the two β-diketones employed as main ligands was probed for both Nd3+ and Er3+ ions, resulting in highly resolved emission spectra and sufficiently long excited state lifetimes, which allowed further assessment of the Ln-to-Ln' ET. This intermetallic transfer was first detected by comparing the emission spectra of iso-absorbant solutions and demonstrated by comparing the lifetime values with or without the lanthanide quencher (Er3+), as well as with a deep analysis of the excitation spectrum of the three complexes. Thus, a very unique phenomenon was discovered, consisting of a mutual Nd-to-Er and Er-to-Nd ET with no net increase of brightness by any metal; while Nd3+ transfers the energy received from the antenna to Er3+, the sensitization of the latter results in back-transfer to Nd3+ into a non-emissive, thus silent, state.


Conflict of interest statement

There are no conflicts to declare.

Figures

Fig. 1
Fig. 1. Ligands 2,6-bis-((3-oxo-3-naphthalene-2-yl)propionyl)-pyridine (H2LA) and 6-(3-(naphthalene-2-yl)-3-oxopropanoyl)-picolinic acid (H2LB).
Fig. 2
Fig. 2. Representation of the cation [Er2Nd(LA)2(LB)2(H2O)2(py)]+ of 3 (also representing those of 1 and 2). The carbon atoms of ligands LA2− and LB2− are darker and lighter gray, respectively. Er is orange, Nd is green, O is red, N is purple and C is gray. H atoms are not shown. The inset shows the coordination polyhedrons of Nd3+ and Er3+, using the same color codes (both Er3+centers have very similar polyhedrons, despite not being crystallographically equivalent, thus, only one is shown).
Fig. 3
Fig. 3. Excitation (λem = 1058 nm, black trace) and emission (λexc = 400 nm, red trace) spectra of complex 1 in MeOH-d4 : DMSO-d6 (1 : 1) at 77 K.
Fig. 4
Fig. 4. Excitation (λem = 1530 nm, black trace) and emission (λexc = 400 nm, red trace) spectra of complex 2 in MeOH-d4 : DMSO-d6 (1 : 1) at 77 K.
Fig. 5
Fig. 5. Emission (λexc = 400 nm, red trace) spectrum of complex 3 in MeOH-d4 : DMSO-d6 (1 : 1) at 77 K.
Fig. 6
Fig. 6. Emission spectra (λexc = 400 nm) of iso-absorbant solutions of complexes (1) (black trace), (2) (blue trace), and (3) (red trace) in MeOD-d4 : DMSO-d6 (1 : 1) solution at room temperature (a) with the corresponding Er3+ emission zoom (b).
Fig. 7
Fig. 7. Energy diagram levels and terms involved in the ET phenomena occurring within complex 3 [ErNdEr].
Fig. 8
Fig. 8. Excitation spectra of complexes (1) at λem = 1058 nm (black trace), (2) at λem = 1530 nm (red trace) and (3) at λem = 1058 nm (blue trace) and at λem = 1530 nm (orange trace) in MeOH-d4/DMSO-d6 (1 : 1) at 77 K.

References

    1. Xian T. Meng Q. Gao F. Hu M. Wang X. Coord. Chem. Rev. 2023;474:214866. doi: 10.1016/j.ccr.2022.214866. - DOI
    1. Bünzli J.-C. G. Chem. Rev. 2010;110:2729–2755. doi: 10.1021/cr900362e. - DOI - PubMed
    1. Heffern M. C. Matosziuk L. M. Meade T. J. Chem. Rev. 2014;114:4496–4539. doi: 10.1021/cr400477t. - DOI - PMC - PubMed
    1. Bünzli J.-C. G. Eliseeva S. V. J. Rare Earths. 2010;28:824–842. doi: 10.1016/S1002-0721(09)60208-8. - DOI
    1. Tessitore G. Mandl G. A. Maurizio S. L. Kaur M. Capobianco J. A. RSC Adv. 2023;13:17787–17811. doi: 10.1039/D3RA00991B. - DOI - PMC - PubMed

LinkOut - more resources