. 2024 Oct 7;14(17):6652-6670.
doi: 10.7150/thno.99260. eCollection 2024.

Macrophage membrane‒biomimetic nanoparticles target inflammatory microenvironment for epilepsy treatment

Affiliations

Macrophage membrane‒biomimetic nanoparticles target inflammatory microenvironment for epilepsy treatment

Chao Geng et al. Theranostics. .

Abstract

Rationale: The clinical treatment of epilepsy is faced with challenges. On the one hand, the effectiveness of existing antiepileptic drugs (AEDs) is limited by the blood‒brain barrier (BBB); on the other hand, changes in the inflammatory microenvironment during epileptogenesis are often neglected. Methods: The death-associated protein kinase 1 inhibitor TC-DAPK6 and the fluorescent probe rhodamine B were encapsulated in hollow mesoporous silica nanocarriers (HMSNs), which were then coated with a macrophage membrane to prepare macrophage membrane-biomimetic nanoparticles, namely, MA@RT-HMSNs. In vitro biotoxicity, cellular uptake, BBB permeability and inflammatory targeting ability were evaluated in cells. The effects of MA@RT-HMSN treatment were explored by immunohistochemistry, TUNEL assay, Western blot analysis, quantitative real-time polymerase chain reaction, electroencephalogram recording and behavioural tests in kainic acid-induced acute and chronic epilepsy model mice. Results: MA@RT-HMSNs showed excellent biocompatibility both in vitro and in vivo. MA@RT-HMSNs successfully crossed the BBB and exhibited increased efficacy in targeted delivery of TC-DAPK6 to inflammatory lesions in epileptic foci. Macrophage membrane coating conferred MA@RT-HMSNs with higher stability, greater cellular uptake, and enhanced TC-DAPK6 bioavailability. Furthermore, MA@RT-HMSNs exerted beneficial therapeutic effects on acute and chronic epilepsy models by alleviating microenvironment inflammation, preventing neuronal death, and inhibiting neuronal excitability and gliosis. Conclusions: MA@RT-HMSNs target inflammatory foci to inhibit death-related protein kinase 1 and exert antiepileptic effects. This study provides a promising biomimetic nanodelivery system for targeted epilepsy therapy.

Keywords: death-related protein kinase 1; drug delivery; epilepsy; inflammation; macrophage membrane biomimetic nanoparticles.


Conflict of interest statement

Competing Interests: The authors have declared that no competing interest exists.

Figures

Figure 1
Figure 1
Preparation and characterization of RT-HMSNs and MA@RT-HMSNs. (A) Scheme for the synthesis of TC-DAPK6- and rhodamine B-loaded MA@RT-HMSNs. (B) TEM images of HMSNs, R-HMSNs, T-HMSNs, RT-HMSNs and MA@RT-HMSNs. (C) Statistical analysis of the particle size (ANOVA). (D) Zeta potentials of HMSNs, R-HMSNs, T-HMSNs, RT-HMSNs, MAs and MA@RT-HMSNs. (E) Powder X-ray diffraction (PXRD) analysis of HMSNs, R-HMSNs, T-HMSNs, RT-HMSNs, TC-DAPK6 and RhB. (F) TGA curves of HMSNs, R-HMSNs and RT-HMSNs. (G) Protein profiles and expression of (H) CD11b and F4/80 in RT-HMSNs, macrophages, MAs and MA@RT-HMSNs. Scale bar in (B), 20 nm; in the inset box, 10 nm.
Figure 2
Figure 2
Biosafety evaluation of MA@RT-HMSNs. (A-D) Blood chemistry analysis of (A) ALT, (B) AST, (C) UR and (D) BUN in mice at 7 days post-PBS, RT-HMSN, TC-DAPK6 and MA@RT-HMSN injection (ANOVA; n = 4 in each group). (E) Representative images of H&E-stained major organs (heart, liver, spleen, lung, kidney and brain) in the four groups. (F) NeuN immunofluorescence staining of brain slices taken from the brain coronal plane, hippocampus and cortex in the four groups. (G and H) Cell viability of (G) HT22 and (H) bEnd.3 cells incubated with MA@RT-HMSNs at different concentrations (0, 5, 12.5, 25, 50, 100 μg/mL) for 24 h (ANOVA; n = 6 at each concentration). Scale bar in (E) and (F), 100 μm.
Figure 3
Figure 3
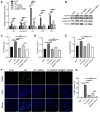
Alleviation of inflammation and apoptosis in glutamate-treated HT22 cells following MA@RT-HMSN incubation. (A) qRT‒PCR analysis of dapk1, c-fos, caspase3, il-6, il-1β and tnf-α expression in the control (NOR), Glu, RT-HMSN, TC-DAPK6 and MA@RT-HMSN groups of HT22 cells (ANOVA; n = 6 in each group). (B) Representative Western blot bands of NLRP3, Caspase1 and Caspase3 in HT22 cells. (C and E) Quantification of the (C) NLRP3, (D) caspase1 and (E) Caspase3 protein levels (ANOVA; n = 5 in each group). (F) Images of TUNEL-stained HT22 cells in the five groups. (G) Quantitative analysis of the percentage of TUNEL-positive cells among the five groups (ANOVA; n = 12 in each group). Scale bar in (F), 50 μm. *P < 0.05, **P < 0.01, ***P < 0.001.
Figure 4
Figure 4
Cellular uptake and in vitro BBB penetration of MA@RT-HMSNs. (A-B) Flow cytometry analysis of the cellular uptake of RT-HMSNs and MA@RT-HMSNs after incubation for 24, 36 and 48 h. (C) Quantitative analysis of the flow cytometry of cellular uptake (ANOVA). (D) Schematic diagram of the in vitro BBB model. (E) Fluorescence images of HT22 cells in the lower Transwell chambers from the control, RT-HMSN, MA@RT-HMSN, RT-HMSN (Glu) and MA@RT-HMSN (Glu) groups. (F) Quantitative analysis of the red fluorescence intensity in HT22 cells (ANOVA). Scale bar in (A) and (D), 50 µm. *P < 0.05, **P < 0.01, ***P < 0.001.
Figure 5
Figure 5
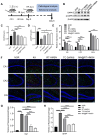
Neuroprotective effects of MA@RT-HMSNs on KA-induced acute seizures. (A) Experimental timeline of three different treatments (I: RT-HMSNs, II: MA@RT-HMSNs and III: TC-DAPK6) and KA injection. (B) Representative Western blot bands showing the protein expression of DAPK1 and p-DAPK1. (C and D) Quantitative analysis of the protein levels of (C) DAPK1 and (D) p-DAPK1. (E) qRT‒PCR analysis of the mRNA expression of il-6, il-1β and tnf-α in control (NOR group), KA-induced (KA group), RT-HMSN-preinjected (RT-HMSN group), TC-DAPK6-preinjected (TC-DAPK6 group) and MA@RT-HMSN-preinjected (MA@RT-HMSN group) mice (ANOVA; n = 6 in each group). (F) Iba1 (red) and GFAP (green) immunostaining of the hippocampus in the three groups. (G and H) Statistical analysis of (G) Iba1- and (H) GFAP-positive cells (ANOVA). Scale bar in (F), 50 µm. *P < 0.05, **P < 0.01, ***P < 0.001.
Figure 6
Figure 6
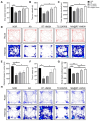
Behavioural analysis of KA-induced acute seizure model mice following MA@RT-HMSN treatment. (A and B) Statistical analysis of (A) time and (B) drop speed in the rotarod test in the NOR, KA, RT-HMSN, TC-DAPK6 and MA@RT-HMSN groups (ANOVA; n = 6 in each group). (C) Statistical analysis of total distance travelled in the open-field test (ANOVA; n = 4 in each group). (D) Typical motion route (top) and heatmap (bottom) showing the results of the open-field test. (E and F) Statistical analysis of (E) distance travelled and (F) time spent in the centre zone by the mice in different groups in the open-field test (ANOVA; n = 4 in each group). (G) Statistical analysis of the preference index for novel objects (ANOVA; n = 4 in each group). (H) Representative trajectory route (top) and heatmap (bottom) showing the results of the novel object recognition test. *P < 0.05, **P < 0.01, ***P < 0.001. NOR, normal control.
Figure 7
Figure 7
Antiepileptic efficacy of MA@RT-HMSNs in treating KA-induced chronic epilepsy. (A) Schematic illustration of MA@RT-HMSN treatment in KA-induced chronic epilepsy. (B and C) Representative EEGs and corresponding power spectral analysis of the hippocampi of epileptic mice after (B) PBS and (C) KA induction. (D) Statistics of the number of GSs/week in the control (PBS), KA and MA@RT-HMSN groups (n = 3 in each group). (E) Representative Western blot bands showing the protein expression of DAPK1 in the PBS, KA and MA@RT-HMSN groups. (F) Quantitative analysis of the protein level of DAPK1 (ANOVA; n = 5 in each group). (G-I) Images of (G) immunostaining and statistical analysis of (H) Iba1- and (I) GFAP-positive cells in the hippocampus in the three groups (ANOVA; n = 3 in each group). (J-K) Images of (J) TUNEL staining and statistical analysis of (K) the numbers of TUNEL-positive cells in the hippocampus in the three groups (ANOVA; n = 3 in each group). Scale bar in (G) and (J), 50 µm. *P < 0.05, **P < 0.01, ***P < 0.001.

References

    1. Thijs RD, Surges R, O'Brien TJ, Sander JW. Epilepsy in adults. Lancet. 2019;393:689–701. - PubMed
    1. Stafstrom CE, Carmant L. Seizures and epilepsy: an overview for neuroscientists. Cold Spring Harb Perspect Med. 2015;5:a022426. - PMC - PubMed
    1. Pong AW, Xu KJ, Klein P. Recent advances in pharmacotherapy for epilepsy. Curr Opin Neurol. 2023;36:77–85. - PubMed
    1. Loscher W, Potschka H, Sisodiya SM, Vezzani A. Drug resistance in epilepsy: clinical impact, potential mechanisms, and new innovative treatment options. Pharmacogn Rev. 2020;72:606–38. - PMC - PubMed
    1. Lu Q, Cai X, Zhang X, Li S, Song Y, Du D. et al. Synthetic polymer nanoparticles functionalized with different ligands for receptor-mediated transcytosis across blood-brain barrier. ACS Appl Bio Mater. 2018;1:1687–94. - PMC - PubMed

Publication types

MeSH terms