. 2024;84(10):1122.
doi: 10.1140/epjc/s10052-024-13471-5. Epub 2024 Oct 29.

Enhancing the light yield of He:CF 4 based gaseous detector

Fernando Domingues Amaro  1 Rita Antonietti  2   3 Elisabetta Baracchini  4   5 Luigi Benussi  6 Stefano Bianco  6 Roberto Campagnola  6 Cesidio Capoccia  6 Michele Caponero  6   7 Danilo Santos Cardoso  8 Luan Gomes Mattosinhos de Carvalho  9 Gianluca Cavoto  10   11 Igor Abritta Costa  6 Antonio Croce  6 Emiliano Dané  6 Giorgio Dho  4   6 Flaminia Di Giambattista  4   5 Emanuele Di Marco  11 Melba D'Astolfo  4   5 Giulia D'Imperio  11 Davide Fiorina  4   5 Francesco Iacoangeli  11 Zahoor Ul Islam  4   5 Herman Pessoa Lima Jùnior  4   8 Ernesto Kemp  12 Giovanni Maccarrone  6 Rui Daniel Passos Mano  1 Robert Renz Marcelo Gregorio  13 David José Gaspar Marques  4   5 Giovanni Mazzitelli  6 Alasdair Gregor McLean  13 Andrea Messina  10   11 Pietro Meloni  2   3 Cristina Maria Bernardes Monteiro  1 Rafael Antunes Nobrega  9 Igor Fonseca Pains  9 Emiliano Paoletti  6 Luciano Passamonti  6 Fabrizio Petrucci  2   3 Stefano Piacentini  4   5 Davide Piccolo  6 Daniele Pierluigi  6 Davide Pinci  11 Atul Prajapati  4   5 Francesco Renga  11 Rita Joana da Cruz Roque  1 Filippo Rosatelli  6 Alessandro Russo  6 Joaquim Marques Ferreira Dos Santos  1 Giovanna Saviano  6   14 Pedro Alberto Oliveira Costa Silva  1 Neil John Curwen Spooner  13 Roberto Tesauro  6 Sandro Tomassini  6 Samuele Torelli  4   5
Affiliations

Enhancing the light yield of He:CF 4 based gaseous detector

Fernando Domingues Amaro et al. Eur Phys J C Part Fields. 2024.

Abstract

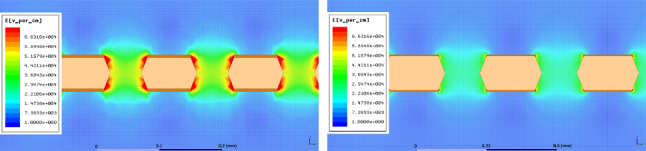
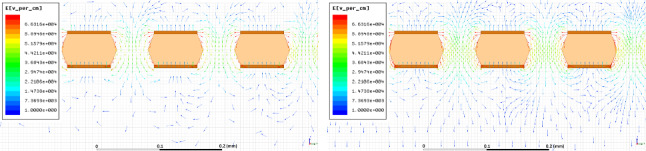
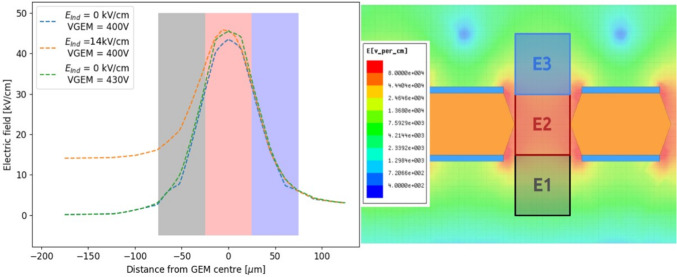
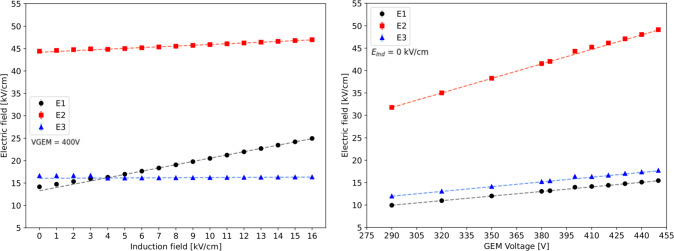
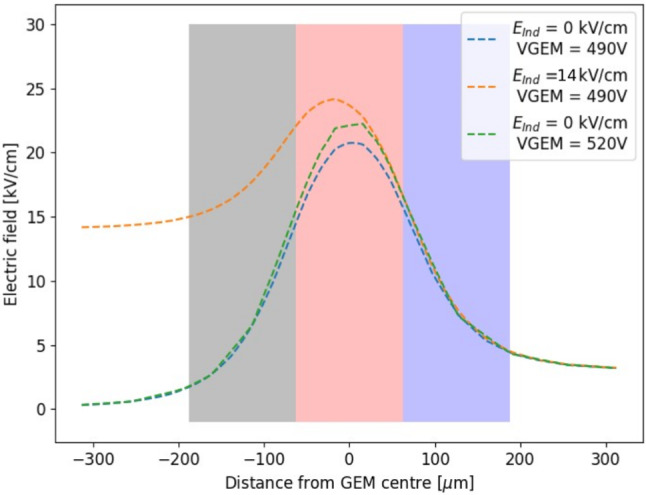
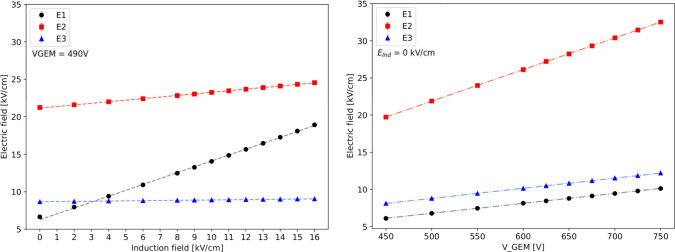
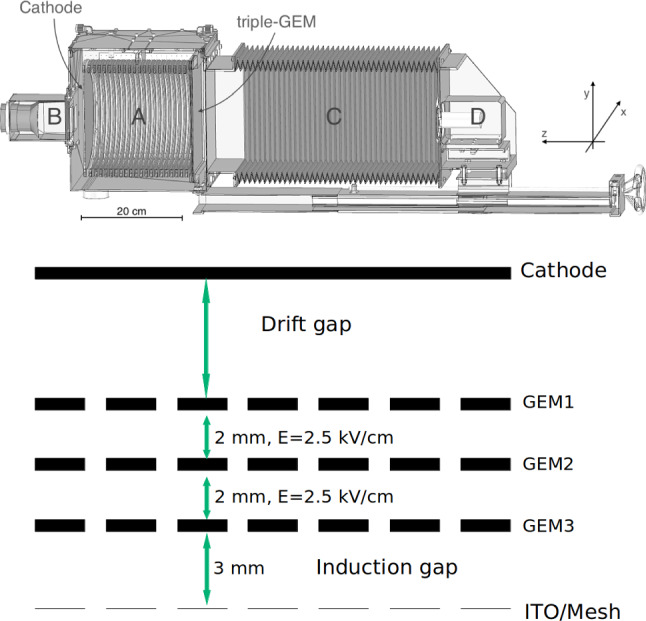
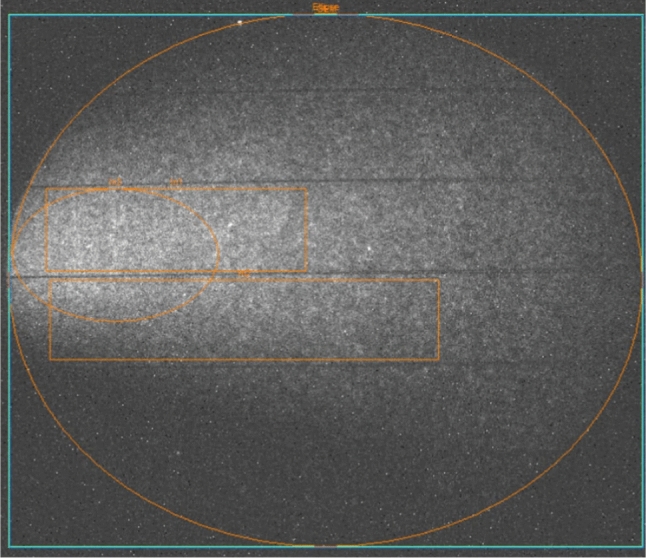
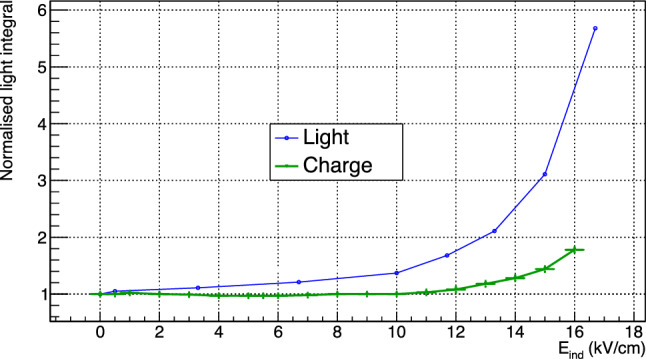
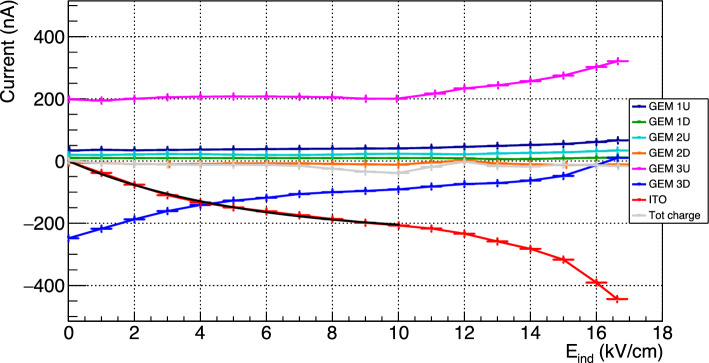
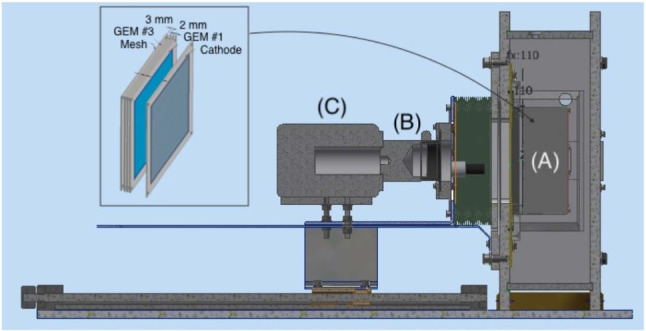
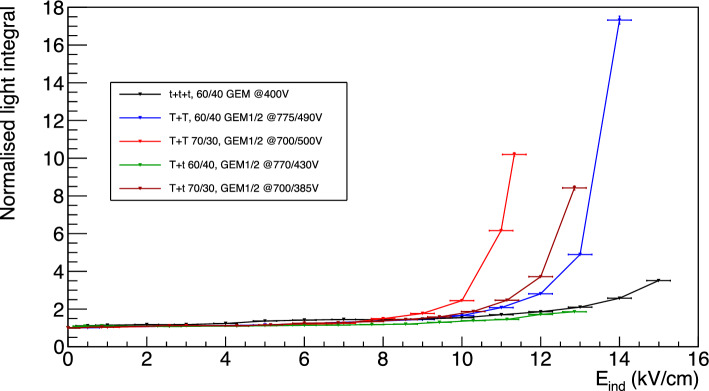
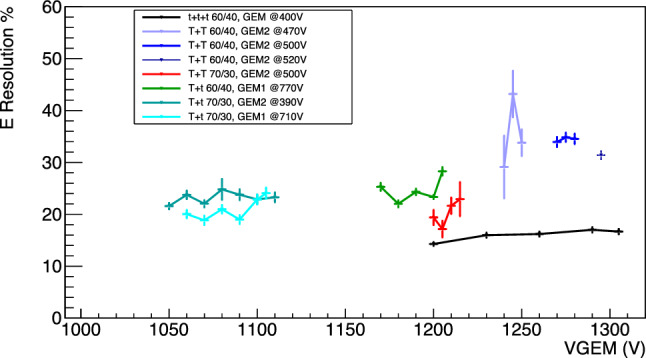
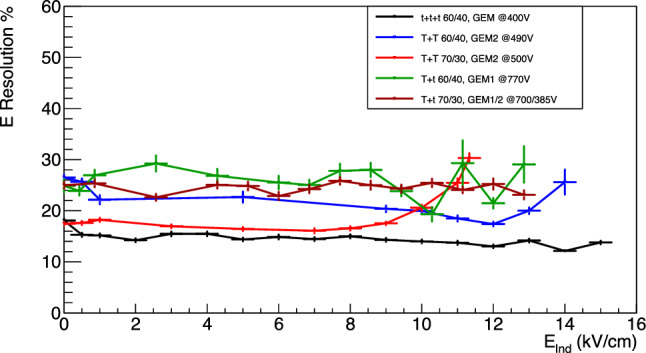
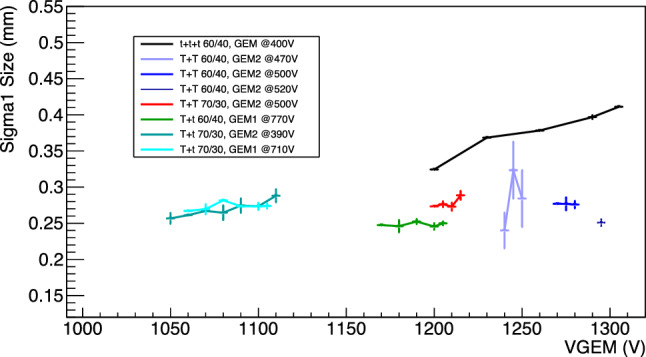
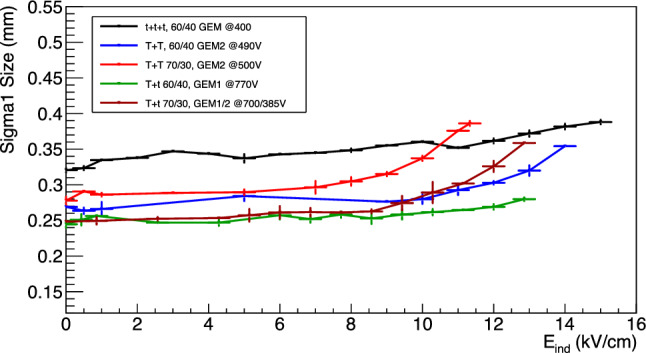
The CYGNO experiment aims to build a large ( O ( 10 ) m 3 ) directional detector for rare event searches, such as nuclear recoils (NRs) induced by dark matter (DM), such as weakly interactive massive particles (WIMPs). The detector concept comprises a time projection chamber (TPC), filled with a He:CF 4 60/40 scintillating gas mixture at room temperature and atmospheric pressure, equipped with an amplification stage made of a stack of three gas electron multipliers (GEMs) which are coupled to an optical readout. The latter consists in scientific CMOS (sCMOS) cameras and photomultipliers tubes (PMTs). The maximisation of the light yield of the amplification stage plays a major role in the determination of the energy threshold of the experiment. In this paper, we simulate the effect of the addition of a strong electric field below the last GEM plane on the GEM field structure and we experimentally test it by means of a 10 × 10 cm 2 readout area prototype. The experimental measurements analyse stacks of different GEMs and helium concentrations in the gas mixture combined with this extra electric field, studying their performances in terms of light yield, energy resolution and intrinsic diffusion. It is found that the use of this additional electric field permits large light yield increases without degrading intrinsic characteristics of the amplification stage with respect to the regular use of GEMs.


Figures

Fig. 1
Fig. 1
Examples of the 2D electric field maps generated by the Ansys Maxwell program. The vertical axis to the drift direction. The colour scale represents the intensity of the field, with red being the highest one. On the left, the detailed structure of the GEM holes for one thin GEM (50 μm GEM with 70 μm radius holes and 140 μm pitch) with 400 V applied across the GEM, 1000 V applied to a metallic electrode below the GEM and a transfer field of 0 kV/cm above the GEM. On the right, the same for a thick one (125 μm GEM with 175 μm radius holes and 350 μm pitch) with 490 V applied across the GEM, 1000 V applied to the metallic electrode and a transfer field of 0 kV/cm above the GEM
Fig. 2
Fig. 2
Examples of the 2D electric field vector maps generated by the Ansys Maxwell program. The vertical axis corresponds to the drift direction. The line colour scale represents the intensity of the field, with red being the highest one. On the left, the detailed structure of the GEM holes when no induction field is applied, whilst on the right the same for 1 kV/cm of induction field. It is clearly visible how the field vectors are much more ordered and straight towards the induction gap (bottom of the plot) in the right panel than in the left one, as a result of the induction field addition
Fig. 3
Fig. 3
On the left, the profile of the electric field along the direction orthogonal to the GEM plane which passes through a t GEM hole. The x-axis coordinate refers to the distance from the centre of the GEM hole, positive for above the GEM hole, negative for below, i.e. towards the induction gap. Three voltage configurations are depicted and described by the legend. Three regions are highlighted in grey (E1), red (E2) and blue (E3), which are described in the text. On the right, a detail of the schematics of the t GEM simulation with superimposed the same three regions E1, E2 and E3 described in the text
Fig. 4
Fig. 4
The simulated electric field in the three regions next to the GEM hole are displayed as a function of the induction field Eind on the left and as a function of VGEM on the right for a t GEM geometry
Fig. 5
Fig. 5
Profile of the electric field along the direction orthogonal to the GEM plane which passes through a T GEM hole. The x-axis coordinate refers to the distance from the centre of the GEM hole, positive for above the GEM hole, negative for below, i.e. towards the induction gap. Three voltage configurations are shown as described by the legend. Three regions are highlighted in grey (E1), red (E2) and blue (E3) which are described in the text
Fig. 6
Fig. 6
The simulated electric field in the three regions next to the GEM hole are displayed as a function of the induction field Eind on the left and as a function of VGEM on the right for a T GEM geometry
Fig. 7
Fig. 7
On the top, the LEMOn prototype [14]. The elliptical sensitive volume (A), the fast photo-multiplier (B), the optical bellow (C) and the sCMOS-based camera (D) are indicated. On the bottom, a sketch of the internal structure of the TPC of the CYGNO prototypes employed in this study where the addition of the ITO or a mesh below the last amplification GEM plane can be appreciated
Fig. 8
Fig. 8
Example of 1 s exposure picture taken with the sCMOS camera with superimposed three regions the total light was evaluated from, as described in the text in Sect. 4.1
Fig. 9
Fig. 9
Comparison of the relative increase of light and charge integral for LEMOn in He:CF4 60/40 at 1000 mbar
Fig. 10
Fig. 10
Currents measured in LEMOn as a function of the induction field Eind for all the six electrodes of the amplification stage plus the ITO glass, where U and D represent respectively the upper and the bottom electrode of each GEM, and the total charge (in gray) is the sum of all the components. The black line represents the exponential fit to the ITO curve described in Eq. 1
Fig. 11
Fig. 11
A simple representation of the MANGO setup with exemplified triple GEM amplification
Fig. 12
Fig. 12
Example of 55Fe signals: on the top, an image acquired by the sCMOS camera in MANGO with a Tt GEM configuration, He:CF4 60/40 gas mixture and 6 kV/cm induction field, where the 55Fe clusters are individually identified by the CYGNO reconstruction algorithm [18, 19]; on the bottom, example of 55Fe photon spectrum with superimposed the Gaussian fit from the same configuration
Fig. 13
Fig. 13
On the top, light integral of the selected 55Fe clusters versus the number of pixels included in the cluster by the reconstruction algorithm. On the bottom, X projection of the 55Fe centered clusters with a Double Gaussian fit superimposed in red. In green and blue the two separate Gaussian functions are displayed, with the green one being the primary as described in the text. All axes of both graphs are in arbitrary count units
Fig. 14
Fig. 14
Gain scan summarizing plot. The light integral obtained by the 55Fe analysis are shown as a function of the total sum of the voltage applied across the GEMs. Different colours represent the various amplification and gas mixture combinations
Fig. 15
Fig. 15
Relative increase of light integral for the ttt configuration in MANGO and LEMOn.The two data sets are manifestly highly consistent with each other and with the measurements presented in [9], robustly confirming the results presented in Sect. 6
Fig. 16
Fig. 16
On the top, the reduced light gain as a function of VGEM with a linear fit superimposed. On the bottom, the reduced light gain is expressed as a function of Eind with a linear fit superimposed in the region blow 10 kV/cm
Fig. 17
Fig. 17
Relative increase of light output as a function of the induction field for all the GEMs stacking configurations studied with MANGO after the linear component is subtracted as described in the text
Fig. 18
Fig. 18
Energy resolution for the different amplification stages as a function of the sum of the voltages applied to the GEMs with a null induction field. Different colours represent the various amplification and gas mixture combinations
Fig. 19
Fig. 19
Energy resolution for the data sets with applied induction fields Eind as a function of Eind
Fig. 20
Fig. 20
Amplification stage diffusion as a function of the sum of the voltages across the GEMs. Different colours represent the various amplification and gas mixture combinations
Fig. 21
Fig. 21
Amplification stage diffusion as a function of the Eind induction field
Fig. 22
Fig. 22
Raw images of the 55Fe data taking with the TT amplification structure and 60/40 of He:CF4 gas mixture. On the top a picture with the Eind=0 kV/cm, while on the bottom the field is 11 kV/cm

References

    1. G. Bertone et al., Phys. Rep. 405(5), 279 (2005). 10.1016/j.physrep.2004.08.031
    1. F. Mayet et al., Phys. Rep. 627, 1 (2016). 10.1016/j.physrep.2016.02.007
    1. F.D. Amaro, E. Baracchini et al., Instruments 6(1), 6 (2022). 10.3390/instruments6010006
    1. K.M. Zurek, Phys. Rep. 537(3), 91 (2014). 10.1016/j.physrep.2013.12.001
    1. K. Petraki, R.R. Volkas, Int. J. Mod. Phys. A 28(19), 1330028 (2013). 10.1142/s0217751x13300287

LinkOut - more resources