. 2024 Nov 15;13(11):bio060596.
doi: 10.1242/bio.060596. Epub 2024 Nov 26.

Reliable replicative lifespan determination of yeast with a single-channel microfluidic chip

Affiliations

Reliable replicative lifespan determination of yeast with a single-channel microfluidic chip

Valentina Salzman et al. Biol Open. .

Abstract

Saccharomyces cerevisiae is a powerful model for aging research due to its short lifespan and genetic malleability. Microfluidic devices offer an attractive approach enabling rapid monitoring of hundreds of cells during their entire replicative lifespan (RLS). Yet, key operational issues such as contaminations, cell loss, and cell-aggregates-dependent flow obstruction can hinder RLS experiments. We report the development of a microfluidic device configuration that effectively prevents flow blockage. We conducted comprehensive performance characterization, evaluating trapping efficiency, cell retention, budding orientation, and cell aggregate formation. The optimized device successfully supported long-term culturing and reliable RLS measurements of budding yeast strains. For accurate lifespan determination, a detailed workflow is provided that includes device fabrication, live microscopy setup, and characterization of cell age distribution. This work describes an accessible and reliable microfluidic device for yeast RLS studies, promoting further exploration in aging research.

Keywords: Clogging mitigation; Microfluidics; Replicative lifespan.


Conflict of interest statement

Competing interests The authors declare no competing or financial interests.

Figures
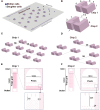
Fig. 1.
Fig. 1.
Optimizing microfluidic devices designed for long-term maintenance of yeast cells. (A) Schematic diagram of the overall structure showing the chip's working principle. Trap rows and columns are indicated. L-shaped microtraps were designed with dimensions indicated in B and intertrap distances shown in C and D. (E,F) Grid in chip 1 has 20,520 traps (380 rows×54 columns) whereas in chip 2 has 5882 traps (173 rows×34 columns). Oval-shaped posts positioned before and after the traps grid are designed to provide structural support to the wide microfluidic channel, preventing collapse during chip bonding. Dimensions are expressed in µm. All design work was done in Klayout software (https://klayout.de/).
Fig. 2.
Fig. 2.
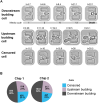
Performance characterization of traps for monitoring yeast RLS. (A) Bright-field images exemplifying downstream budding, upstream budding, and censored cells. Time (t) since the RLS microfluidic experiment started is indicated in h. Scale bar: 5 µm. The censored cell is marked by an asterisk. (B) Proportions and percentages of downstream budding, upstream budding, and censored cells were identified in a total of 1939 and 1978 trapped cells in chips 1 and 2, respectively.
Fig. 3.
Fig. 3.
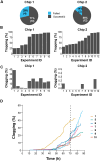
Enhancing daughter cell removal by optimizing trap spacing. (A) Proportion of interrupted experiments because of chip clogging and flow halting before reaching 70 h. (B,C) A total of 22 experiments with a minimum duration of 70 h were conducted using chip 1 (10 experiments), and chip 2 (12 experiments). (B) Trap occupancy rate after 20 h of the experiment. (C) Percentage of clogged traps at 70 h. Note the Y axes’ different scaling. (D) Time course of traps clogging using chip 1. Numbers indicate individual experiments, as shown in B and C (left panels). Vertical dashed line indicates the minimum experimental time required to monitor the lifespan breath of a WT S. cerevisiae strain population.
Fig. 4.
Fig. 4.
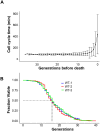
The microfluidic device enables reliable RLS determination of a WT S. cerevisiae strain. (A) The cell cycle time during the complete lifespan of 215 trapped yeast cells was tracked and manually analyzed. Cell cycle time distributions were calculated for each generation. All samples were aligned with the time of death as the reference point. Data represent the average and SD. (B) Population survival as a function of the number of generations of yeast cells for three independent experiments (WT-1, n=215 cells, WT-2, n=208 cells; WT-3, n=108 cells). G50 values are shown (dot lines). The obtained RLS results are not significantly different, as a Wilcoxon–Rank sum test indicates. The P-values for WT1-WT2, WT1-WT3 and WT2-WT3 combinations are 0.69, 0.74 and 0.52, respectively. RLS statistics and lifespan distributions are shown in Table S1 and Fig. S4, respectively.
Fig. 5.
Fig. 5.
Chip loading optimization and determination of the age distribution of the loaded population. (A) Left: scheme of chip zones (P1-4) that were monitored by video microscopy during chip loading. Right: cumulative % of occupied traps during cell loading. At least 110 traps were imaged per zone. (B) Left: representative 3D projection images of yeast cells trapped in the chip and stained with calcofluor white, a white arrow points to a trapped mother cell (scale bar: 5 µm). Right: distribution of the bud scars (generations) in the yeast population at the beginning of the RLS experiment (t=0). Results of two experiments are shown (n=338 cells). The median value is 1. (C) Overlay of age distributions of the loaded cell population (gray, t=0, n=338 cells), and of the completed RLS experiment population (orange, t>0, n=423, WT-1 plus WT-2 experiments data), vertical lines indicate distribution's medians. (D) Distribution of median lifespans obtained when accounting for the unobserved daughters by random assignment between distributions shown in 5C. The median lifespan determined by the RLS experiment at t>0 is depicted in orange.
Fig. 6.
Fig. 6.
Impact of censored cells on lifespan distributions. (A) Left panel: comparison of lifespan distributions of two simulated cell populations: no escape from chip traps (orange) and age-independent escape (red). An initial population of 6000 cells was considered in both cases. Wilcoxon–Rank sum test P-value=0.7. Right panel: corresponding survival curves. Median lifespans are indicated by dotted lines. (B) Left panel: the lifespan distribution for no escaped cells (orange, same as in A) is compared to the distribution of a simulated cell population where escape probability increases proportionally with age (blue, age-dependent). Wilcoxon–Rank sum test P-value <2.2e−16. Right panel: corresponding survival curves. (C) Left panel: experimentally obtained lifespan distribution of retained cells in an RLS assay of WT cells (n=208 cells) compared to the distribution including both retained and censored cells (n=251). Wilcoxon–Rank sum test P-value=0.30. Right panel: corresponding survival curves.
Fig. 7.
Fig. 7.
Extended lifespan mutant RLS determination. (A) Comparison of lifespan distributions of WT (n=531 cells) and tor1 (n=252 cells) strains. Median lifespans are indicated by dotted lines. (B) Population survival as a function of the number of generations of WT and tor1 cells. G50 values are indicated in the graph by dotted lines. Wilcoxon–Rank sum test P-value <2.2e−16 (RLS statistics are shown in Table S2).

Similar articles

References

    1. Cabeen, MT and Losick, R. (2018). Single-cell Microfluidic Analysis of Bacillus subtilis. J Vis Exp. 26, 56901. 10.3791/56901 - DOI - PMC - PubMed
    1. Chant, J. and Pringle, J. R. (1991). Budding and cell polarity in Saccharomyces cerevisiae. Curr. Opin. Genet. Dev. 1, 342-350. 10.1016/S0959-437X(05)80298-9 - DOI - PubMed
    1. Chen, K. L., Crane, M. M. and Kaeberlein, M. (2017). Microfluidic technologies for yeast replicative lifespan studies. Mech. Ageing Dev. 161, 262-269. 10.1016/j.mad.2016.03.009 - DOI - PMC - PubMed
    1. Crane, M. M., Clark, I. B. N., Bakker, E., Smith, S. and Swain, P. S. (2014). A microfluidic system for studying ageing and dynamic single-cell responses in budding yeast. PLoS One 9, e100042. 10.1371/journal.pone.0100042 - DOI - PMC - PubMed
    1. Crane, M. M., Russell, A. E., Schafer, B. J., Blue, B. W., Whalen, R., Almazan, J., Hong, M. G., Nguyen, B., Goings, J. E., Chen, K. L.et al. (2019). DNA damage checkpoint activation impairs chromatin homeostasis and promotes mitotic catastrophe during aging. Elife 8, e50778. 10.7554/eLife.50778 - DOI - PMC - PubMed

Publication types

MeSH terms

LinkOut - more resources