. 2024 Oct 31:13:RP93172.
doi: 10.7554/eLife.93172.

Exceptional longevity of mammalian ovarian and oocyte macromolecules throughout the reproductive lifespan

Affiliations

Exceptional longevity of mammalian ovarian and oocyte macromolecules throughout the reproductive lifespan

Ewa K Bomba-Warczak et al. Elife. .

Abstract

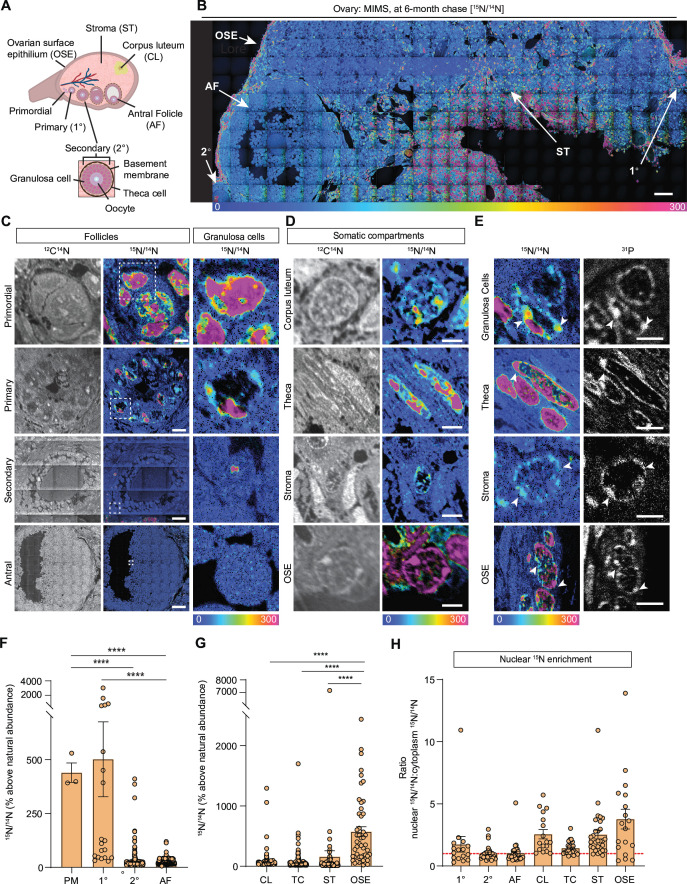
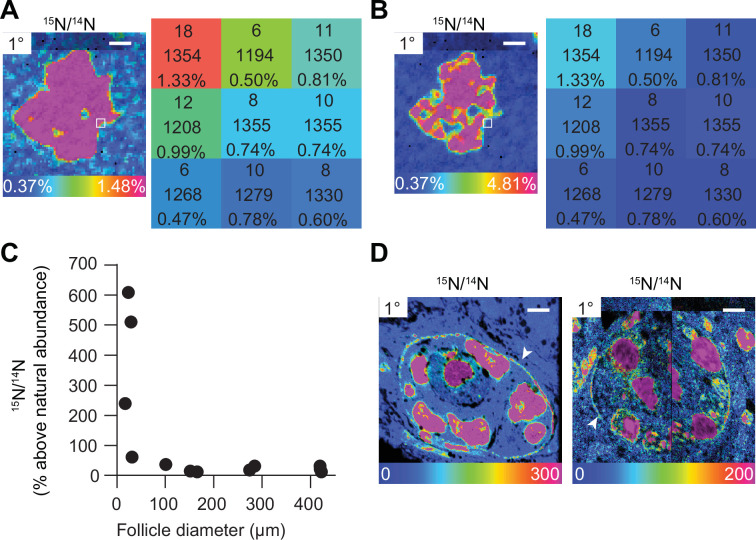
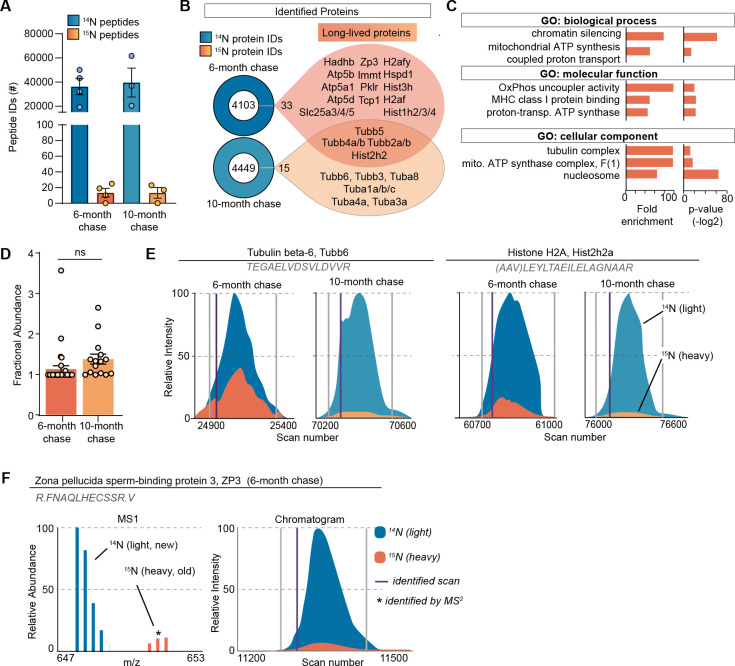
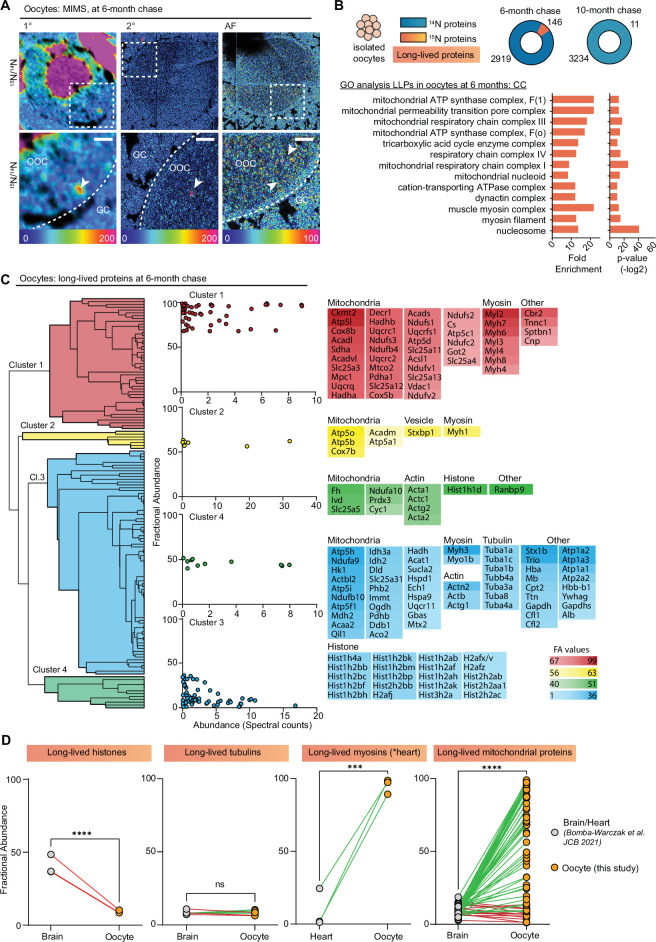
The mechanisms contributing to age-related deterioration of the female reproductive system are complex, however aberrant protein homeostasis is a major contributor. We elucidated exceptionally stable proteins, structures, and macromolecules that persist in mammalian ovaries and gametes across the reproductive lifespan. Ovaries exhibit localized structural and cell-type-specific enrichment of stable macromolecules in both the follicular and extrafollicular environments. Moreover, ovaries and oocytes both harbor a panel of exceptionally long-lived proteins, including cytoskeletal, mitochondrial, and oocyte-derived proteins. The exceptional persistence of these long-lived molecules suggest a critical role in lifelong maintenance and age-dependent deterioration of reproductive tissues.

Keywords: cell biology; long-lived proteins; mass spectrometry imaging; mouse; oocyte; ovaries; proteomics; reproductive aging.


Conflict of interest statement

EB, KV, LZ, CG, SE, MS, JS, FD No competing interests declared

Figures

Figure 1.
Figure 1.. Multi-isotope imaging mass spectrometry (MIMS) analysis of cells and structures across ovarian tissue sections.
(A) Diagram depicting and defining structures of the mammalian ovary. (B) Representative hue saturation intensity (HSI) mosaic from an ovary of a 15N-labeled mouse (6 months of age). Localization and abundance of 15N varied depending on cell type. HSI scale was set to 0% (natural 15N/14N ratio) to 300% (above the natural ratio). (C) High abundance of 15N is seen in early-stage follicles, specifically within granulosa cells. (D) Representative images of somatic cells show differences in 15N-labeling. (E) Intracellular abundance of 15N is colocalized with 31P abundance across all cell types. (F) Differences in 15N/14N ratios reveal granulosa cells of early-stage follicles have greater 15N abundance than later stages (n=3 (PM), 20 (1°), 305 (2°), 2848 (AF)). (G) Among somatic cells, quantitative analysis shows a greater abundance of 15N at the ovarian surface epithelium (n=242 (CL), 276 (TC), 74 (ST), 74 (OSE)). (H) Ratio analysis shows abundance of 15N localized in nuclear regions of cells (n=16 (1°), 30 (2°), 30 (AF), 17 (CL), 30 (TC), 30 (ST), 18 (OSE)). A hypothetical ratio of one, denoted as a red dash line, signifies no difference in 15N abundance between cytoplasmic and nuclear regions. Abbreviations: PM (primordial follicle), 1° (primary follicle), 2° (secondary follicle), AF (antral follicle), CL (corpus luteum), TC (theca cell), ST (stroma), and OSE (ovarian surface epithelium). HSI scale for all images was set to 0%-300% (above natural abundance). Data are shown as mean± SEM. Statistical analysis was performed using a one-way ANOVA. Asterisk denotes statistical significance (* p≤0.05; ** p≤0.01; *** p≤0.001; **** p≤0.0001). Scale bar = (B): 50 µm; (C): 3 µm (PM), 6 µm (1°), 30 µm (2°), 75 µm (AF); (D): 2.5 µm (CL), 2.5 µm (TC), 5 µm (ST), 2.5 µm (OSE); (E): 3 µm (GC), 3 µm (TC), 2.5 µm (ST), 6 µm (OSE).
Figure 1—figure supplement 1.
Figure 1—figure supplement 1.. Multi-generational whole animal pulse-chase labeling design along the reproductive aging continuum.
(A) Wild-type female FVB mice (n=3) were fed a 15N-diet for 13 weeks and were maintained on a 15N-labeled diet through breeding, pregnancy, and weaning to produce 15N-labeled pups. Labeled pups were sacrificed after switching over to a 14N-diet for a chase period of 6 or 10 months. Ovaries and oocytes were designated for NanoSIMS, or liquid chromatography/mass spectrometry. Female FVB mice experience age-associated changes in ovarian reserve, ovarian microenvironment, and gamete quality. (B) Representative images of each follicle class from mice of 6 weeks and 6 months of age. (C) Average follicle number per area of ovarian section from mice of the following ages: 6 weeks, 6 months, and 10 months (n=3 mice per age cohort). (D) Graph represents average number of follicles within each follicle class per area of ovarian section for mice ages 6 weeks, 6 months, and 10 months (n=3 mice per age cohort). (E) Comparison of average number of eggs ovulated per trial for mice at 6–12 weeks, 6 months, and (F) 10 months. The data points represent the average number of eggs collected per mouse from two independent trials. In each trial, oviducts from three to four mice were pooled per age group. Representative processed color threshold images of Picrosirius Red (PSR)-stained ovarian tissue sections from mice (G) 6 weeks, (H) 6 months, and (I) 10 months of age. (J) Graph comparing the average percent area of PSR-positive staining per ovarian section (pixels/μm2) (n=3 mice per age cohort). Data are shown as mean ± SEM. Statistical analysis was performed using a one-way ANOVA. Asterisk denotes statistical significance (*p≤0.05; **p≤0.01; ***p≤0.001; ****p≤0.0001). Scale bar for images of (B) primordial, primary, secondary, and antral follicles are 20 μm, 40 μm, 40 μm, and 140 μm, respectively. Scale bars in (G–I) are 180 μm.
Figure 1—figure supplement 2.
Figure 1—figure supplement 2.. Multi-isotope imaging mass spectrometry (MIMS) uncovers structures enriched with 15N.
(A) Hue saturation intensity (HSI) image maps 15N/14N ratio across nuclear region of a primary follicle. Using a rainbow scale, blue is set to the natural ratio of 15N (0.37%) and overabundance is set to 1.48% (or 300% above the natural ratio). Each pixel provides quantitative information. The numbers in each pixel represent the number of 15N ions, 14N ions, and the 15N/14N ratio, respectively. (B) Changes to the rainbow scale can be used to emphasize regional ratio differences and change the visual representation of the data. Visual changes to HSI images due to different scales do not change the quantitative data behind each pixel. (C) Total 15N abundance of each follicle plotted by follicle diameter shows smaller follicles containing high abundance of 15N. (D) HSI images reveal high 15N abundance concentrated at the basement membrane of early-stage follicles. Scale bar (A, B) = 2.5 μm, (D) left = 4.0 μm, right = 4.5 μm.
Figure 2.
Figure 2.. Long-lived proteome in mammalian ovaries.
(A) Summary of peptide identification at 6- and 10-month chase points, blue graphs indicate 14N-peptide IDs, orange/yellow graphs indicate 15N-peptide IDs. (B) Summary of protein identification at each timepoint, with a list of proteins identified as long-lived in orange. (C) Gene ontology (GO) analysis of the long-lived proteins (LLPs) identified in ovaries at 6-month chase revealed that terms related to chromatin, nucleosome, tubulins, and mitochondria are significantly enriched. (D) Fractional abundance of LLPs identified at 6- and 10-month chase. (E) Annotated representative chromatograms of two representative proteins that persist through both 6- and 10-month chase, illustrating the decreasing 15N-signal over time. Blue - 14N (new), orange 15N (old), purple line: identified scan. (F) Annotated representative raw MS1 scan of zona pellucida-3 protein (ZP3). Mean ± SEM; three to four biological replicates per timepoint, ns - not significant by Student’s t-test.
Figure 3.
Figure 3.. Exceptional longevity of nuclear, cytoskeletal, and mitochondrial proteins in mouse oocytes.
(A) Multi-isotope imaging mass spectrometry (MIMS) analysis reveals high abundance of 15N in nuclei and throughout the cytoplasm of oocytes. (B) Purified oocyte population was harvested from pulse-chased mice and analyzed using gel-liquid chromatography mass spectrometry (LC-MS/MS). Charts illustrate the number of proteins identified at each timepoint (blue) along with long-lived proteins (orange). Gene ontology (GO) analysis of the long-lived proteins (LLPs) identified in oocytes at 6-month chase revealed an enrichment for terms related to nucleosome, myosins, and mitochondria. (C) Hierarchical cluster analysis of fractional abundance of LLPs identified in oocytes. (D) Direct comparison of fractional abundances of proteins previously identified as long-lived and LLPs in oocytes. Mean ± SEM; oocytes collected from four to seven females per timepoint, ***p-value<0.001, ****p-value<0.0001 by Kruskal-Wallis ANOVA with Tukey’s multiple comparisons test. Scale bar = 4 µm.
Figure 3—figure supplement 1.
Figure 3—figure supplement 1.. Long-lived proteins at 6- and 10-month chase points in oocytes.
(A) Experimental scheme to identify and measure long-lived proteins (LLPs) mouse oocyte. (B, C) Fractional abundance of each identified LLPs at both 6 and 10 months as compared to the spectral abundance for each LLPs. (D) Plots showing decrease in fractional abundance (FA) values for same proteins identified as LLPs at 6- and 10-month chase. (E) Venn diagram illustrating the overlap of mitochondrial proteins identified at 6- and 10-month timepoints. (F) Spectral counts of mitochondrial proteins as well as the (G) fractional abundance of each identified mito-LLPs at both 6 and 10 months, illustrating that even though there are no significant difference in spectral counts at each timepoint, the number of quantified proteins decreased dramatically between 6 and 10 months of chase. Mean ± SEM; oocytes collected from four to seven females per timepoint, statistical analysis: Kruskal-Wallis ANOVA with Tukey’s multiple comparisons test.

Update of

References

    1. Ajduk A, Ilozue T, Windsor S, Yu Y, Seres KB, Bomphrey RJ, Tom BD, Swann K, Thomas A, Graham C, Zernicka-Goetz M. Rhythmic actomyosin-driven contractions induced by sperm entry predict mammalian embryo viability. Nature Communications. 2011;2:417. doi: 10.1038/ncomms1424. - DOI - PMC - PubMed
    1. Amargant F, Manuel SL, Tu Q, Parkes WS, Rivas F, Zhou LT, Rowley JE, Villanueva CE, Hornick JE, Shekhawat GS, Wei JJ, Pavone ME, Hall AR, Pritchard MT, Duncan FE. Ovarian stiffness increases with age in the mammalian ovary and depends on collagen and hyaluronan matrices. Aging Cell. 2020;19:e13259. doi: 10.1111/acel.13259. - DOI - PMC - PubMed
    1. Ann Johnson J, Tough S, SOGC GENETICS COMMITTEE Gynaecologists of, Delayed child-bearing. Journal of Obstetrics and Gynaecology Canada: JOGC = Journal d’obstetrique et Gynecologie Du Canada: JOGC. 2012;34:80–93. doi: 10.1016/S1701-2163(16)35138-6. - DOI - PubMed
    1. Babayev E, Seli E. Oocyte mitochondrial function and reproduction. Current Opinion in Obstetrics & Gynecology. 2015;27:175–181. doi: 10.1097/GCO.0000000000000164. - DOI - PMC - PubMed
    1. Balasch J, Gratacós E. Delayed childbearing: effects on fertility and the outcome of pregnancy. Current Opinion in Obstetrics & Gynecology. 2012;24:187–193. doi: 10.1097/GCO.0b013e3283517908. - DOI - PubMed

Substances

LinkOut - more resources