Baseline factors associated with myopia progression and axial elongation over 30 months in children 5 to 12 years of age
- PMID: 39480129
- PMCID: PMC12207677
- DOI: 10.1097/OPX.0000000000002187
Baseline factors associated with myopia progression and axial elongation over 30 months in children 5 to 12 years of age
Abstract
Purpose: This study aimed to identify baseline factors associated with greater myopia progression and axial elongation in children with myopia.
Methods: This study performed a post hoc analysis of data from a 30-month randomized trial of atropine 0.01% versus placebo in children 5 to <13 years old with baseline spherical equivalent refractive error (SER) of -1.00 to -6.00 D, astigmatism of ≤1.50 D, and anisometropia of <1.00 D SER. Data from atropine 0.01% and placebo groups were pooled given outcomes were similar. Baseline factors of age, SER, axial length, race, sex, parental myopia, and iris color were evaluated for association with changes in SER and with changes in axial length at 30 months (24 months on treatment and then 6 months off) using backward model selection.
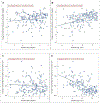
Results: Among 187 randomized participants, 175 (94%) completed 30 months of follow-up. The mean change in SER was greater among younger children (-0.19 D per 1 year younger; 95% confidence interval [CI], -0.25 to -0.14 D; p<0.001) and children with higher myopia (-0.14 D per 1 D more myopia at baseline; 95% CI, -0.23 to -0.05 D; p=0.002). The mean change in axial length was also greater among younger children (0.13 mm per 1 year younger; 95% CI, 0.10 to 0.15 mm; p<0.001) and children with higher baseline myopia (0.04 mm per 1 D more myopia; 95% CI, 0.002 to 0.08; p=0.04).
Conclusions: Younger children with higher myopia had greater myopic progression and axial elongation over 30 months than older children with lower myopia. Developing effective treatments to slow the faster myopic progression in younger children should be a target of further research.
Trial registration: ClinicalTrials.gov NCT03334253.
Copyright © 2024 American Academy of Optometry.
Conflict of interest statement
Conflict of Interest Disclosure: None of the authors have reported a financial conflict of interest. The content is solely the responsibility of the authors and does not necessarily represent the official views of the funding organizations.
Figures


References
-
- National Eye Institute. Nearsightedness (Myopia) Tables. Updated February 7, 2020. Accessed June 2, 2022. https://www.nei.nih.gov/learn-about-eye-health/eye-health-data-and-stati...
Publication types
MeSH terms
Substances
Associated data
Grants and funding
LinkOut - more resources
Full Text Sources
Medical

