Review
. 2025 Apr 1;105(2):765-801.
doi: 10.1152/physrev.00030.2024. Epub 2024 Oct 31.

Axon initial segment structure and function in health and disease

Affiliations
Review

Axon initial segment structure and function in health and disease

Paul M Jenkins et al. Physiol Rev. .

Abstract

At the simplest level, neurons are structured to integrate synaptic input and perform computational transforms on that input, converting it into an action potential (AP) code. This process, converting synaptic input into AP output, typically occurs in a specialized region of the axon termed the axon initial segment (AIS). The AIS, as its name implies, is often contained to the first section of axon abutted to the soma and is home to a dizzying array of ion channels, attendant scaffolding proteins, intracellular organelles, extracellular proteins, and, in some cases, synapses. The AIS serves multiple roles as the final arbiter for determining if inputs are sufficient to evoke APs, as a gatekeeper that physically separates the somatodendritic domain from the axon proper, and as a regulator of overall neuronal excitability, dynamically tuning its size to best suit the needs of parent neurons. These complex roles have received considerable attention from experimentalists and theoreticians alike. Here, we review recent advances in our understanding of the AIS and its role in neuronal integration and polarity in health and disease.

Keywords: ankyrin; axon initial segment; excitability; ion channel; polarity.


Figures

Figure 1:
Figure 1:. Basics of the axon initial segment
A Model of a neuron. In most neurons, the AIS begins just after the axon hillock, which is where the axon connects to the soma. In myelinated neurons, myelin (green) covers the axon between the nodes of Ranvier. The action potential is initiated within the AIS and propagates down the axon to the nerve terminals where neurotransmitters are released. B Representative images of cultured neocortical neuron at DIV7 stained with MAP2 (cyan hot LUT), ankyrin-G (green), and neurofascin-186 (red). Created from unpublished data from Jenkins laboratory. C Ultrastructure of the AIS. The AIS (blue) begins after the axon hillock (red) and is marked by a dense submembranous undercoat and microtubule fascicles. Adapted from (1, 2); used with permission.
Figure 2:
Figure 2:. Molecular components of the AIS
The axon initial segment is built by the scaffolding protein ankyrin-G, which binds to ion channels (NaV1, NaV β subunits, KV7), cell adhesion molecules (neurofascin-186, NrCAM), and others and links them to the actin cytoskeleton through interactions with βIV/αII-spectrin tetramers. Other AIS proteins, although ultimately dependent on ankyrin-G, localize to the AIS without binding directly to ankyrin-G. For example, KV1 localizes through interactions with PSD-93. The AIS is also characterized by bundled, plus-end-out microtubule fascicles that host a number of critical microtubule-associated proteins (EB1/3, CAMSAP2, Ndel1, and TRIM46).
Figure 3:
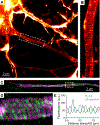
Figure 3:. The AIS contains periodic, evenly spaced rings of actin and AIS proteins
A Representative image of cultured hippocampal neuron at DIV5 stained with SiR-actin captured by stimulated emission depletion (STED) microscopy. Image courtesy of Dr. Elisa D’Este (Max Planck Institute for Medical Research). Image adapted from (353); used with permission. B Higher magnification image of region of interest marked in panel A showing actin rings, originally described in (354). C Representative image of the AIS of a cultured hippocampal neuron at DIV22 stained with antibodies to Kv1.4 (green) and βIV-spectrin (magenta) captured by stimulated emission depletion (STED) microscopy. Image courtesy of Dr. Elisa D’Este (Max Planck Institute for Medical Research). D Higher magnification image of region of interest marked in panel C. E Line fluorescence intensity measurement of panel D showing the non-overlapping periodicity of Kv1.4 (green) and βIV-spectrin (magenta). C-E: Created from unpublished data from Elisa D’Este.
Figure 4:
Figure 4:. Effects of AIS loss on neuronal structure
A Neurons that have a normal AIS are characterized by separation of axonal and somatodendritic compartments, high levels of clustering of AIS proteins, and GABAergic cartridge synapses arising from chandelier cells. B Neurons that lose their AIS through manipulations like genetic deletion of ankyrin-G exhibit multiple kinds of cellular dysfunction. Dendritic proteins are able to enter the proximal part of the axon causing development of ectopic dendritic spines. The interface between the axon and somatodendritic compartment moves distally within the neurite that is to become the axon. AIS protein clustering within the AIS is lost and proteins are redistributed within the cell. GABAergic synapses at the AIS are lost.
Figure 5:
Figure 5:. Developmental stages of AIS formation in cultured neurons
A In stage 2 neurons (12–24 hours after plating), multiple immature neurites form. Axonal (green) and dendritic (orange) molecular motors equally sample each neurite. B As neurons reach stage 3 (DIV1–2), one neurite undergoes a growth spurt, eventually becoming the axon. At this point, before the AIS has formed, axonal motors begin to exhibit strong preference for the axonal neurite and dendritic motors begin to show dendrite-specific transport. C During stage 4 (DIV2–4), ankyrin-G begins to assemble the AIS (blue). AIS proteins are clustered with ankyrin-G and form a multi-protein complex necessary for maintenance of AIS structure and function. D As neurons mature (DIV14+), chandelier cells form GABAergic cartridge synapses on the AIS (purple). Neurodevelopmental stages based on (77).
Figure 6:
Figure 6:. AIS function in protein sorting and trafficking
Vesicles containing axonal cargo (green) are recruited to the axon at the pre-axon exclusion zone (PAEZ), where they traffic into the axon on plus end-out microtubules. Vesicles containing dendritic cargo (orange) are turned back at the PAEZ. Those that inappropriately enter the AIS are retrieved and returned to the soma through the activity of actin-based myosin motors. Within the AIS proper, areas devoid of the submembranous actin-spectrin mesh serve as sites for clathrin-mediated endocytosis within the AIS. The tight clustering of proteins within the AIS and their tethering to the actin cytoskeleton serve as a diffusion barrier that limits protein and lipid mobility within the plane of the membrane and in the axoplasm.
Figure 7:
Figure 7:. Developmental localization patterns of NaVs in the central nervous system
A Schematic representation of the rodent brain regions examined in B-D. NaV1.1 is in purple, NaV1.2 is in cyan, NaV1.6 is in green. B In midbrain, dopaminergic neurons predominantly express NaV1.2 localized in the AIS. GABAergic interneurons that synapse onto the dopaminergic cells express NaV1.1 in the proximal AIS and NaV1.6 in the distal AIS. C In the neocortex, localization patterns change during development. In developing glutamatergic pyramidal neurons (<P7), NaV1.2 is localized throughout the AIS. In maturing pyramidal neurons, NaV1.2 is restricted to the proximal AIS and NaV1.6 occupies the majority of the AIS, including distal AP initiation regions responsible for AP generation. In developing parvalbumin (PV)-expressing GABAergic neurons (<P21), NaV1.1 is the main NaV localized to the AIS. In mature PV neurons, NaV1.1 is largely replaced by NaV1.6 in most of the AIS, and NaV1.1 is restricted to the proximal AIS. Somatostatin (SOM)-expressing neurons exhibit a similar change in localization as PV neurons. D In cerebellum, Purkinje cells express NaV1.6 in the AIS. Molecular layer interneurons (MLIs) and granule cells have initial segments that mimic those found in mature neocortical parvalbumin and pyramidal cells, respectively, with NaV1.1 or NaV1.2 in the proximal AIS and NaV1.6 in the distal AIS.
Figure 8:
Figure 8:. AP voltage waveform is affected by recording site
A Representative 2-photon z-stack of a layer 5b thick tufted pyramidal neuron with two whole-cell recording electrodes, one at the soma, and one at the axon bleb. Note: data in B-C are not from this representative cell. B Cartoon representation of recording electrode positions and representative traces of the voltage changes during the action potential as measured on the soma (black) and at the axon bleb (cyan). In this recording, the bleb recording was made from a region of axon 37 microns from the axon hillock, likely near the distal AIS. C Phase plane plots of APs in B in the soma and bleb. Note that AIS AP peak voltage is smaller than at the soma in part due to higher resistance of recording electrodes necessary for bleb recording. Area in magenta is expanded in inset. Note smooth rise of AP dV/dt in axonal bleb recording, contrasting with sharp rise of AP dV/dt in soma. This latter sharpness may be explained by soma-AIS dipole coupling. Data collected by PWE Spratt (B-C) as part of (51). All images and data are unpublished in the format shown, data from the Bender Laboratory, related to Spratt et al. (51).
Figure 9:
Figure 9:. Electrical components of AP electrogenesis in somatic whole-cell recordings
A Typical measurements of APs are made at the soma, which is part of an electrical dipole coupled with the AIS during AP initiation. APs initiate in the distal AIS, with local positive current influx. Arrows denote current flux of dipole. B Top: Somatic current injection produces a series of APs. The first AP is expanded in time below. Bottom: AP voltage, voltage speed (first derivative) and voltage acceleration (second derivative) plotted vs. time. Shaded areas correspond to AIS (green) and somatic (cyan) components of the rising phase of the AP, and the repolarization (purple) phase of the AP. Note inflection point in voltage acceleration dividing AIS and somatic components. C Plot of voltage vs voltage speed (first derivative, dV/dt), termed a phase plane plot. Different components of AP are color coded as in B. Created from unpublished data from Bender laboratory.
Figure 10:
Figure 10:. Live imaging of AIS structure
A Representation of methods that have been used to live label the AIS. Overexpression of GFP-tagged neurofascin-186, NaVβ4-GFP, 270 kDa ankyrin-G-GFP (not shown) fails to report the accurate position of the AIS. Labeling of native neurofascin with antibodies directed against the extracellular domain accurately labels the AIS but fails to report AIS plasticity. Overexpression of the II-III loop of NaV1.2 fused to YFP effectively reports the position of the AIS and reflects AIS plasticity, but with some temporal delay. Labeling of endogenous ankyrin-G with a Cre-dependent GFP tag reports the position of the AIS and allows detection of AIS plasticity in real time. B Representative images of layer II/III somatosensory pyramidal neurons from Ank3:GFP x CamkII Cre mice. intrinsic GFP shown along with staining for NaV1.6 (left), neurofascin-186 (middle), and TRIM46 (right). Bars represent 10 microns. Unpublished data from Dr. Maren Engelhardt; adapted from (255); used with permission. C (Left) Isolated layer II/III somatosensory from Ank3:GFP mouse transduced with sparse synapsin-Cre-tdTomato AAV. Ankyrin-G-GFP shown in green and TdTomato shown in magenta. Bar represents 10 microns. (Right) Ankyrin-G-GFP signal shown as greyscale demonstrating that ankyrin-G localizes to the soma and dendrites of mature pyramidal neurons, in addition to identifying the position of the AIS.

References

    1. Palay SL, Sotelo C, Peters A, and Orkand PM. The axon hillock and the initial segment. J Cell Biol 38: 193–201, 1968. - PMC - PubMed
    1. Peters A, Proskauer CC, and Kaiserman-Abramof IR. The small pyramidal neuron of the rat cerebral cortex. The axon hillock and initial segment. J Cell Biol 39: 604–619, 1968. - PMC - PubMed
    1. Grubb MS, Shu Y, Kuba H, Rasband MN, Wimmer VC, and Bender KJ. Short- and long-term plasticity at the axon initial segment. J Neurosci 31: 16049–16055, 2011. - PMC - PubMed
    1. Huang CY, and Rasband MN. Axon initial segments: structure, function, and disease. Ann N Y Acad Sci 1420: 46–61, 2018. - PMC - PubMed
    1. Leterrier C. The Axon Initial Segment: An Updated Viewpoint. J Neurosci 38: 2135–2145, 2018. - PMC - PubMed

LinkOut - more resources