. 2024 Oct 31;134(24):e170953.
doi: 10.1172/JCI170953.

Breast cancers that disseminate to bone marrow acquire aggressive phenotypes through CX43-related tumor-stroma tunnels

Affiliations

Breast cancers that disseminate to bone marrow acquire aggressive phenotypes through CX43-related tumor-stroma tunnels

Saptarshi Sinha et al. J Clin Invest. .

Abstract

Estrogen receptor-positive (ER+) breast cancer commonly disseminates to bone marrow, where interactions with mesenchymal stromal cells (MSCs) shape disease trajectory. We modeled these interactions with tumor-MSC co-cultures and used an integrated transcriptome-proteome-network-analyses workflow to identify a comprehensive catalog of contact-induced changes. Conditioned media from MSCs failed to recapitulate genes and proteins, some borrowed and others tumor-intrinsic, induced in cancer cells by direct contact. Protein-protein interaction networks revealed the rich connectome between "borrowed" and "intrinsic" components. Bioinformatics prioritized one of the borrowed components, CCDC88A/GIV, a multi-modular metastasis-related protein that has recently been implicated in driving a hallmark of cancer, growth signaling autonomy. MSCs transferred GIV protein to ER+ breast cancer cells (that lack GIV) through tunnelling nanotubes via connexin (Cx)43-facilitated intercellular transport. Reinstating GIV alone in GIV-negative breast cancer cells reproduced approximately 20% of both the borrowed and the intrinsic gene induction patterns from contact co-cultures; conferred resistance to anti-estrogen drugs; and enhanced tumor dissemination. Findings provide a multiomic insight into MSC→tumor cell intercellular transport and validate how transport of one such candidate, GIV, from the haves (MSCs) to have-nots (ER+ breast cancer) orchestrates aggressive disease states.

Keywords: Bioinformatics; Bone marrow; Breast cancer; Oncology.


Conflict of interest statement

Conflict of interest: GDL has received research materials from Spexis. All other authors declare no competing interests.

Figures

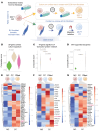
Figure 1
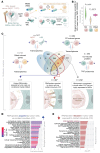
Figure 1. Multiomic analysis reveals RNA/protein acquired by ER+ breast cancer cells from MSCs in contact co-culture.
(A) Experimental set up for recapitulating disseminated ER+ breast cancer cells in bone marrow amidst mesenchymal stem cells (MSCs). Two different types of co-culture models were used, one with conditioned media (CMed; top) and one with direct contact co-culture (CC; bottom). MC, monoculture. (B) Violin plots display the composite score of a 49-gene tumor dormancy score (DS) specific for ER+ breast cancers and previously validated in 4 independent cohorts to predict recurrence. (C) Top: Venn diagram depicts multiple DEG analyses between different indicated groups that catalog suppressed genes or proteins in contact co-culture (CC) or conditioned media (CMed) and overall differential gene expression between MCF7 versus HS5 bone marrow MSCs; bottom. Bottom: Genes/proteins induced in MCF7 cells in co-culture with HS5 MSCs are binned into 3 categories (connected by arrows) based on likely mechanisms for induction. Red = 39 uniquely upregulated transcripts in cancer cells in contact co-culture also identified by proteomics. (D) Gene ontology analysis (GO Biological processes) on transcripts and/or proteins acquired by MCF7 cells from MSCs during contact co-culture. See Supplemental Figure 1 for Reactome pathway and GO enrichment analyses on genes and/or proteins within each category in C. (E) Reactome analysis on transcripts and/or proteins reduced in MCF7 cells during contact co-culture with MSCs. See Supplemental Figure 2 for analyses on genes and proteins suppressed in cancer cells.
Figure 2
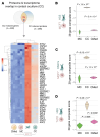
Figure 2. Genes uniquely upregulated in MCF7 tumor cells in contact co-culture with HS5 MSCs are identified reproducibly in other tumor-MSC co-culture models.
(A) Heatmap displays hierarchical unsupervised clustering of samples used in Figure 1A using the 39 uniquely upregulated genes in cancer cells in contact culture. MC, monoculture. (BD) Violin plots display the composite score of the 39 genes in A in various tumor cell-MSC co-culture models, e.g., MCF7↔HS5 (B), MCF7↔HS27a (C) and T47D↔HS5 (D). Statistical significance for BD was assessed by 1-way ANOVA and the P values are corrected for multiple comparisons using Tukey’s method.
Figure 3
Figure 3. A contact culture signature derived from proteome-transcriptome overlap carries prognostic and predictive value in ER+ breast cancer.
(A) Reactome pathways enriched in the 39 genes identified in Figure 1C. The PI3K/Akt signaling pathway (red), growth factor signaling pathways (teal blue), and the tolerogenic cytokine pathways (navy blue) are highlighted. (BG) Kaplan-Meier survival plots on HER2-negative breast cancer patients from 2 independent cohorts with known outcomes over time (relapse/metastasis-free survival), stratified as high versus low expression of the 39-gene signature (see Methods). Statistical significance was assessed by log-rank analyses. RD, residual disease; PCR, pathologic complete response; Rx, treatment.
Figure 4
Figure 4. A multilayer network analysis to explore connectivity between the borrowed and intrinsic components of upregulated proteins in cancer cells after co-culture with MSCs.
(A) Workflow for protein-protein interaction (PPI) network analysis using the 39 gene signature from Figure 1E as seeds for the STRING database. (B) Overlaps between the PPI network and genes/proteins from Figure 1C as likely borrowed from MSCs or upregulated in the cancer cell–intrinsic response during contact co-cultures. (C) Multilayer PPI network shows connectivity between borrowed (n = 159) and intrinsic (n = 76) proteins, with key nodes labeled. (D) Reactome pathways (left) enriched in 567 proteins shared between borrowed and intrinsic layers of the PPI network in C. Venn diagram (right) shows the total nodes in each layer and overlap.
Figure 5
Figure 5. Integration of 2D and 3D co-culture–derived omics pinpoints GIV as a central orchestrator of the co-culture borrowed gene signature.
(A) The 158 borrowed genes from our 2D co-cultures were further filtered using a public dataset from 3D co-cultures of MCF7 and T47D cells with HS5 MSCs. Threshold ROC AUC > 0.85 identified 19 genes. Violin plot shows the composite score for these 19 genes in 3D monoculture (MC) versus contact (CC) cultures. (B) Heatmap of z score–normalized expression of the 19 genes. (C) Gene ontology (GO) analyses identify CCDC88A as an invariant player across processes enriched within the 19 genes. (D) Shows induction of CCDC88A in MCF7 cells in contact coculture (CC) but not conditioned media (CMed). Only significant P values are displayed (Welch’s t test). (E) Graph displays GO cellular components enriched in the CCDC88A/GIV-subcluster in C. Blue highlights denote processes required for transport via tunneling nanotubes. (F) MCF7 cells (red nuclei; “T”) connected with a nanotube to HS5 MSCs in contact coculture (left). Boxed area is magnified on the right. Arrows mark the nanotube. Supplemental Figure 3 shows additional images. Bar plots (right) show average number of TNTs in each condition per field. (G and H) Violin plots show induction of GJA1 (G) and TNFAIP2 (H) in MCF7 cells in contact co-culture (CC) but not in conditioned media (CMed). P values for A, F, G, and H were derived by 1-way ANOVA and corrected for multiple comparisons by Tukey’s method.
Figure 6
Figure 6. Transfer of GIV from MSCs to ER+ breast cancer cells requires ongoing interactions.
(A) Schematic illustrates key functional domains of GIV. The C-terminus contains multiple short linear motifs that enable diverse tumor-promoting interactions (receptors, signaling molecules within diverse pathways, and components of membrane trafficking). GBD, G protein–binding domain; GEM, guanine nucleotide exchange modulator; SH2, Src-like homology domain. (B) Equal aliquots of lysates of 3 ER+ breast cancer cells (MCF7, T47D, or HCC1428) in monoculture or recovered after co-culture with HS5 cells were analyzed for GIV and actin (as a loading control) by immunoblotting (IB). (C) Equal aliquots of lysates of MCF7 cells prepared either immediately after recovery from co-cultures with HS5 cells (0 hours) or after an additional 24 or 96 hours of culture after removal from HS5 contact were analyzed for GIV and actin (as a loading control) by IB. (D and E) Schematic (D) outlines the key manipulations (i.e., treatment with shRNA for GIV) done to either MCF7 or HS5 cells in contact co-cultures. Equal aliquots of MCF7 cells recovered from the co-cultures (left) or HS5 cells in monocultures were analyzed for GIV and actin (loading control) by IB.
Figure 7
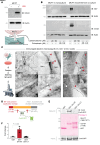
Figure 7. Cx43 and GIV interact and are co-transported through intercellular communication sites.
(A) Equal aliquots of lysates of MCF7 cells in monoculture or recovered after co-culture with HS5 cells were analyzed for Cx43 and actin (as a loading control) by immunoblotting (IB). (B) MCF7 cells in monoculture or in co-culture with HS5 cells were treated with the indicated concentrations of carbenoxolone or fulvestrant prior to lysis. Equal aliquots of lysates were analyzed for GIV, Cx43 or actin (the latter as a loading control) by IB. See Supplemental Figure 5 for similar studies on HS5 monocultures. (C) Electron micrographs of immunogold stained MCF7↔HS5 contact co-cultures. Red arrowhead denotes 6 nm gold particles (GIV); white arrow denotes 12 nm gold particles (Cx43). Scale bar: 1000 nm (top left), 100 nm (bottom left, middle and right panels), 200 nm (right panel insets). (D) Schematic of constructs used in pull-down assays with recombinant GST-tagged GIV N- or C-terminal fragments or GST alone (negative control) proteins immobilized on glutathione beads and lysates of Cos7 cells transiently expressing GFP-Cx43. (E) Bound Cx43 was visualized by IB (top). Equal loading of GST proteins was confirmed by ponceau S staining (bottom). (F) Bar graphs display the relative binding of Cx43 to various GST proteins. Data are represented as mean ± SEM (n = 3); P value determined by 1-way ANOVA with Tukey’s HSD test for post hoc pairwise comparisons.
Figure 8
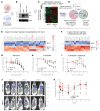
Figure 8. Expression of GIV recapitulates the MSC close contact signature, confers resistance to ER-targeted therapies, and promotes early dissemination of ER+ breast cancer cells.
(A) Schematic shows creation of a stable MCF7 cell population expressing exogenous GIV (CCDC88A) by a piggyBac transposase vector. (B) Immunoblots of whole cell lysates of cells in A, confirming expression of full-length GIV. (C and D) Workflow (C) of RNA sequencing and normalized gene expression analysis of cells in B analyzed for the borrowed (n = 158) and intrinsic (n = 76) genes to perfectly classify MCF7-GIV cells from control MCF7 (ROC-AUC 1.00). Venn diagram (D) shows genes induced with GIV alone as percentage of the total borrowed and intrinsic signatures. (E and F) Heatmaps display hierarchical unsupervised clustering of MCF7 and MCF7-GIV cells by z score–normalized gene expression for the subset of genes induced among the borrowed (E) and intrinsic (F) signatures. Supplemental Figure 6 shows Reactome pathway analysis of these genes. (GI) Graphs display viability for MCF7-GIV and control MCF7 cells exposed to increasing concentrations of tamoxifen (G), fulvestrant (H), or fulvestrant and 100 nM palpociclib (I). Data are displayed after normalization to cells treated with vehicle only. (J and K) Equal number (1 × 10⁵) of MCF7-GIV or control MCF7 cells were injected into the left cardiac ventricle of 7- to 10-week-old female NSG mice (n = 8 per group). Representative bioluminescence images (J) show mice at days 1, 3, and 6 after injection. In GI and K, graphs show mean values ± SEM of each group at specific data points. Statistical significance between 2 groups at each time point was computed using repeated measures ANOVA. *P < 0.1, **P ≤ 0.05, ***P ≤ 0.01 indicates corrected P values using Tukey’s method.
Figure 9
Figure 9. MCF7 cells borrow CCDC88A and other key genes during contact culture with fibroblasts.
(A) Schematic of the experimental setup in which MCF7 cells were grown either as monoculture (MC), or in direct contact cultures with BJ fibroblasts (CC) or cultured on ECM produced by the BJ fibroblasts (CMed). (BD) Violin plots show the degrees of induction of 39-gene 2D contact culture signature (B), the 19-gene signature of network of borrowed proteins/transcripts that survived refinement through 3D contact cultures (C), and GIV-supported borrowed transcriptional program of 32 genes (as in Figure 8D). Statistical significance was assessed by 1-way ANOVA and the P values were corrected for multiple comparisons by using Tukey’s method. (EG) Heatmaps show the induction pattern of each gene within the signatures described in BD. Color key denotes z score–normalized counts per million (cpm).

Update of

References

    1. Kennecke H, et al. Metastatic behavior of breast cancer subtypes. J Clin Oncol. 2010;28(20):3271–3277. doi: 10.1200/JCO.2009.25.9820. - DOI - PubMed
    1. Coleman RE, et al. Bone metastases. Nat Rev Dis Primers. 2020;6(1):83. doi: 10.1038/s41572-020-00216-3. - DOI - PubMed
    1. Weilbaecher KN, et al. Cancer to bone: a fatal attraction. Nat Rev Cancer. 2011;11(6):411–425. doi: 10.1038/nrc3055. - DOI - PMC - PubMed
    1. Pan H, et al. 20-year risks of breast-cancer recurrence after stopping endocrine therapy at 5 years. N Engl J Med. 2017;377(19):1836–1846. doi: 10.1056/NEJMoa1701830. - DOI - PMC - PubMed
    1. Beuzeboc P, Scholl S. Prevention of bone metastases in breast cancer patients. Therapeutic perspectives. J Clin Med. 2014;3(2):521–536. doi: 10.3390/jcm3020521. - DOI - PMC - PubMed

MeSH terms