. 2024 Oct 31;135(1):e179874.
doi: 10.1172/JCI179874.

TMED4 facilitates regulatory T cell suppressive function via ROS homeostasis in tumor and autoimmune mouse models

Affiliations

TMED4 facilitates regulatory T cell suppressive function via ROS homeostasis in tumor and autoimmune mouse models

Zhenyan Jiang et al. J Clin Invest. .

Abstract

Endoplasmic reticulum stress (ERS) plays crucial roles in maintaining Treg stability and function, yet the underlying mechanism remains largely unexplored. Here, we demonstrate that (Tmed4ΔTreg) mice with Treg-specific KO of ERS-related protein transmembrane p24 trafficking protein 4 (TMED4) had more Tregs with impaired Foxp3 stability, Treg signatures, and suppressive activity, which led to T cell hyperactivation and an exacerbated inflammatory phenotype and boosted antitumor immunity in mice. Mechanistically, loss of Tmed4 caused defects in ERS and a nuclear factor erythroid 2-related factor 2-related (NRF2-related) antioxidant response, which resulted in excessive ROS that reduced the Foxp3 stability and suppressive function of Tregs in an IRE1α/XBP1 axis-dependent manner. The abnormalities could be effectively rescued by the ROS scavenger, NRF2 inducer, or by forcible expression of IRE1α. Moreover, TMED4 suppressed IRE1α proteosome degradation via the ER-associated degradation (ERAD) system including the ER chaperone binding immunoglobulin protein (BIP). Our study reveals that TMED4 maintained the stability of Tregs and their suppressive function through IRE1α-dependent ROS and the NRF2-related antioxidant response.

Keywords: Adaptive immunity; Autoimmune diseases; Immunology; T cells.


Figures

Figure 1
Figure 1. Treg-specific Tmed4-KO (Tmed4ΔTreg) mice exhibit T cell hyperactivation, and impaired Foxp3 stability in Tregs.
(A) Images of spleens and pLNs from 12-week-old sex-matched littermate Tmed4fl/fl (WT) mice and Tmed4ΔTreg (cKO) mice. (B) Spleen/body weight ratios of Tmed4fl/fl and Tmed4ΔTreg mice (n = 3). (CE) FCM plots (C) and analysis (D and E) of effector CD4+ and CD8+ T cells isolated from spleens, pLNs, and lungs from Tmed4fl/fl and Tmed4ΔTreg mice (n = 3). (F and G) FCM plots (F) and analysis (G) of IFN-γ–producing CD4+ and CD8+ T cells from spleens and pLNs from Tmed4fl/fl and Tmed4ΔTreg mice (n = 3). (H and I) FCM plots (H) and analysis (I) of Treg frequencies in CD4+ T cells from spleens, pLNs, and lungs from Tmed4fl/fl and Tmed4ΔTreg mice (n = 3). (J) FCM analysis of Foxp3 MFI in Tregs from spleens, pLNs, and lungs from Tmed4fl/fl and Tmed4ΔTreg mice (n = 3). (K and L) FCM levels (K) and analysis (L) of Foxp3 MFI in iTregs (CD4+CD25+Foxp3+) generated in vitro 2 or 3 days after the naive T cells were purified and cultured with differentiation inducers (n = 3). (M and N) Western blotting (M) and quantitative analysis (N) of FOXP3 decay in WT and Tmed4-deficient Tregs purified from spleens and pLNs treated with 1 μg/mL CHX for the indicated durations. Data are presented as the mean ± SEM of biologically independent samples and represent at least 3 independent experiments, each involving 3 mice per group. *P < 0.05, **P < 0.01, and ***P < 0.001, by 2-tailed Student’s t test. Sp, spleen.
Figure 2
Figure 2. TMED4 deficiency alters the signature profiles of Tregs in a cell-intrinsic manner.
(A) Scatterplot showing global gene expression profiles of Tregs from Tmed4fl/fl and Tmed4ΔTreg mice stimulated with α-CD3/α-CD28 antibodies. Transcripts with a |log2(fold change)| >0.5 and P < 0.05 in Tmed4-deficient Tregs are shown in blue or red. (B and C) Heatmaps of gene clusters of DEGs of effector-like genes (B) and Treg signature profile genes (C) and between WT and Tmed4-deficient Tregs. Red and blue represent relatively higher and lower levels of expression of the indicated genes, respectively. The colors indicate the value of the log2 fold change (n = 3). (D) GSEA plots showing the enrichment of the “Treg signature profiles” (FDR <0.2) gene set. (E and F) FCM levels (E) and statistical analysis (F) of the in vitro suppressive assay of purified Tregs from spleens from Tmed4fl/fl and Tmed4ΔTreg mice, as assessed by the proliferation of activated CD4+ T cells in the presence of various ratios (responder T cells/Tregs [Tresp/Treg] = 1:2, 1:1, and 1:0.5) of Tregs (n = 3, detected on day 3). (G) FCM analysis of MFI of CD25 in Tregs from spleens, pLNs, and lungs of Tmed4fl/fl and Tmed4ΔTreg mice (n = 3). (H and I) FCM plots (H) and analysis (I) of Foxp3+ Treg frequencies in BM chimeric mice (n = 3). FSC-W, forward scatter width. (J and K) FCM analysis of Foxp3 (J), CD25, CTLA4, and GITR (K) MFI in spleens and pLNs from BM chimeric mice (n = 3). (L and M) FCM plots (L) and Foxp3 frequencies (M) of both YFP+ and YFP Tregs in spleens and pLNs from female WT and chimeric mice (n = 3). (N) Ratio of YFP+ Tregs to YFP Tregs in spleens and pLNs from female WT and chimeric mice (n = 3). (O) FCM analysis of Foxp3 MFI between YFP+ and YFP Tregs from female WT and chimeric mice (n = 3). Data are presented as the mean ± SEM of biologically independent samples and represent at least 3 independent experiments, each involving 3 mice per group. *P < 0.05, **P < 0.01, ***P < 0.001, and ****P < 0.0001, by 2-tailed Student’s t test.
Figure 3
Figure 3. Loss of Tmed4 in Tregs leads to a more exacerbated inflammatory phenotype in mice.
(A) Mean clinical score for diseased Tmed4fl/fl and Tmed4ΔTreg mice (n = 4). (B) FCM analysis of CD4+ and CD8+ T cell proportions isolated from the CNS of diseased Tmed4fl/fl and Tmed4ΔTreg mice 16 days after disease induction (n = 4). (C) H&E and LFB stainings of spinal cord sections from diseased Tmed4fl/fl and Tmed4ΔTreg mice (16 days after immunization). Scale bars: 100 μm. Samples were selected from 1 Tmed4fl/fl mouse (clinical score: 1) and 1 Tmed4ΔTreg mouse (clinical score: 3). (D and E) FCM analysis of Treg frequencies (D) and Foxp3 MFI (E) in dLNs and CNS (n = 4). (F and G) FCM analysis of (F) IFN-γ–producing CD4+ and CD8+ T cells from spleens, dLNs, and CNS and (G) IL-17–producing CD4+ T cells from dLNs and CNS from diseased Tmed4fl/fl and Tmed4ΔTreg mice (n = 4). (H) Curve for the percentage of body weight loss. Rag1–/– mice were injected with CD4+CD45RBhiCD25lo naive T cells alone or in combination with Tregs isolated from Tmed4fl/fl and Tmed4ΔTreg mice. The body weight is presented relative to the initial weight in each case (n = 3 for mice coinjected with naive T mixed Tmed4fl/fl or Tmed4ΔTreg Tregs, respectively; n = 2 for mice injected with naive T cells alone). (I) H&E staining of colon (Co) and small intestine (SI) after adoptive transfer. Scale bar: 100 μm. (J) Percentages of CD45+ cells infiltrating into the colon and small intestine (n = 3 for mice coinjected with naive T mixed WT or Tmed4-deficient Tregs, respectively; n = 2 for mice injected with naive T cells alone). Data are presented as the mean ± SEM of biologically independent samples and represent 3 independent experiments, each involving 2–4 mice per group. *P < 0.05, **P < 0.01, and ***P < 0.001, by 2-way ANOVA (A), 1-way ANOVA with Tukey’s multiple-comparison test (H), and 2-tailed Student’s t test for other analysis.
Figure 4
Figure 4. Loss of Tmed4 in Tregs boosts antitumor immunity in mice.
(A) Growth curves for tumors derived from Tmed4fl/fl and Tmed4ΔTreg mice that were s.c. inoculated with MC38 cells (n = 4). (B and C) FCM analysis of CD4+CD25+ frequencies (B) and Foxp3 MFI (C) of dLNs and tumor-infiltrating CD4+Foxp3+ Tregs from tumor-bearing Tmed4fl/fl and Tmed4ΔTreg mice (n = 4). (DG) FCM analysis of the percentages of IFN-γ (D and E) and TNF-α (F and G) secretion in tumor-infiltrating CD4+ and CD8+ T cells from dLNs and tumors from Tmed4fl/fl and Tmed4ΔTreg mice (n = 4). (H) Percentages of IFN-γ– and IL-17–producing, tumor-infiltrating Tregs (TI-Treg) from tumor-bearing Tmed4fl/fl and Tmed4ΔTreg mice (n = 4). Data are presented as the mean ± SEM of biologically independent samples and represent 3 independent experiments, each involving 4 mice per group. *P < 0.05 and **P < 0.01, by 2-tailed Student’s t test
Figure 5
Figure 5. Tmed4 deficiency leads to an impaired ERS response, mitochondrial integrity, and ROS accumulation in Tregs.
(A) Relative mRNA expression of Bip and Chop in WT and Tmed4-deficient Tregs under resting conditions or with α-CD3/α-CD28 antibodies (TCR), alone or together with 1 μM TG to induce ERS, for 16–20 hours (n = 3). (B) WB analysis of ERS-related regulator proteins and their downstream molecules in WT and Tmed4-deficient Tregs treated with DMSO, α-CD3/α-CD28 antibodies only or together with 1 μM TG for 16–20 hours. (CE) Relative mRNA expression of Erdj4 (C), Sec61a1 (D), and Atf4 (E) in WT and Tmed4-deficient Tregs under resting conditions or with α-CD3/α-CD28 antibodies (TCR), alone or together with 1 μM TG to induce ERS, for 16–20 hours (n = 3). (F) Enrichment analysis of KEGG and GO pathways for Tmed4-deficient Tregs compared with WT Tregs. Selected upregulated (red bars) and downregulated (blue bars) pathways are shown for Tmed4-deficient Tregs. (G and H) Curve (G) and quantitative analysis (H) of the OCRs for WT and Tmed4-deficient Tregs stimulated with α-CD3/α-CD28 for 16–20 hours (n = 3). (IK) Relative mRNA expression of mt-Cytb (I), mt-Nd1 (J), and mt-Nd4 (K) in WT and Tmed4-deficient Tregs under resting conditions or with α-CD3/α-CD28 antibodies (TCR), or together with 1 μM TG stimulation for 16–20 hours (n = 3). (L) WB analysis of PERK pathway–related proteins in WT and Tmed4-deficient Tregs treated with α-CD3/α-CD28 antibodies, alone or together with 1 μM TG, for 16–20 hours. (MO) Levels of mitochondrial ROS (Mito-ROS) (M, upper panel) and total cellular ROS (M, lower panel) stained with Mito-SOX and CFDA (H2DCFDA), respectively, and quantitative analysis of their MFI (N and O) in WT and Tmed4-deficient splenic Tregs stimulated for 16–20 hours with α-CD3/α-CD28 antibodies (TCR), alone or together with 1 μM TG (n = 3). Data are presented as the mean ± SEM of biologically independent samples and represent at least 3 independent experiments, each involving 3 mice per group. *P < 0.05, **P < 0.01, ***P < 0.001, and ****P < 0.0001, by 2-tailed Student’s t test. K, KO group; WT, WT group.
Figure 6
Figure 6. ROS scavenger or NRF2 inducer restores Foxp3 expression and the suppressive function of Tmed4-deficient Tregs.
(AC) Total cellular ROS levels (A) of splenic Tregs stimulated with TCR alone or together with 1 μM TG for 12 hours in the presence or absence of NAC (N-acetylcysteine) and quantitative analysis of the MFI of ROS (B) and Foxp3 (C) expression (n = 3). (D and E) FCM levels (D) and analysis (E) of the in vitro suppressive assay of purified Tregs from spleens and LNs from Tmed4fl/fl and Tmed4ΔTreg mice, as assessed by the proliferation of activated CD4+ T cells in the presence of the indicated ratios of Tregs pretreated with DMSO or NAC for 12 hours (n = 3, detected on day 3). (F) Tumor growth curves for CD45.1+ mice that were s.c. injected with MC38 cells, together with WT or Tmed4-deficient Tregs. Both types of Tregs were pretreated with α-CD3/α-CD28 antibodies for 12 hours in the presence or absence of NAC, and then i.v. injected into the mice on day 0 and day 7 (n = 4). (G) FCM analysis of the proportions of activated host CD45.1+CD4+ (G, left) and CD45.1+CD8+ (G, right) T cells from WT and KO mouse groups in the presence or absence of NAC, respectively (n = 3). (H and I) IFN-γ–producing host CD45.1+CD4+ (H) and CD45.1+CD8+ (I) T cells from WT and KO mouse groups in the presence or absence of NAC, respectively (n = 3). (J) IFN-γ– and IL-17–producing donor CD45.2+ Tregs from WT and KO mouse groups in the presence or absence of NAC, respectively (n = 3). Data are presented as the mean ± SEM of biologically independent samples. The tumor rescue model represents 2 independent experiments, and others represent 3 independent experiments, each involving 3–4 mice per group. *P < 0.05 or #P < 0.05, **P < 0.01 or ##P < 0.01, ***P < 0.001, and ****P < 0.0001, by 1-way ANOVA with Tukey’s multiple-comparison test (FJ) and 2-tailed Student’s t test.
Figure 7
Figure 7. Treg-specific Ern1-KO (Ern1ΔTreg) mice phenocopy Tmed4ΔTreg mice.
(A and B) Analysis of the proportions of activated (A) and IFN-γ–producing (B) CD4+ and CD8+ T cells from spleens of Ern1fl/fl and Ern1ΔTreg mice (n = 3). (C) Analysis of IFN-γ– and IL-17–producing Tregs from spleens from Ern1fl/fl and Ern1ΔTreg mice (n = 3). (DF) Quantitative analysis of the MFI of total ROS (D), mitochondrial ROS (E), and Foxp3 (F) in splenic Tregs from Ern1fl/fl and Ern1ΔTreg mice treated with α-CD3/α-CD28 antibodies (TCR), alone or together with 1 μM TG, for 16–20 hours (n = 3). Data are presented as the mean ± SEM of biologically independent samples and represent at least 3 independent experiments, each involving 3 mice per group. *P < 0.05, **P < 0.01, and ****P < 0.0001, by 1-way ANOVA with Tukey’s multiple-comparison test (DF) and 2-tailed Student’s t test.
Figure 8
Figure 8. Tmed4 deficiency in Tregs leads to lower Foxp3 expression and ROS accumulation in an IRE1α/XBP1 axis–dependent manner.
(A and B) Expression levels of Foxp3 (A) and cellular ROS (B) in WT splenic Tregs treated with α-CD3/α-CD28 antibodies (TCR) and 1 μM TG and the IRE1α inhibitor 4μ8C or KIRA6 for 16–20 hours (n = 3). (C and D) Quantitative analysis of the MFI of Foxp3 expression (C) and ROS (D) in WT and Tmed4-deficient splenic Tregs without (Ctrl) or with induced IRE1α expression. Cells were treated with 1 μM TG for 16–20 hours (n = 3). (E and F) FCM results (E) and statistical analysis (F) of the in vitro suppressive assay of purified Tregs from spleens of Tmed4fl/fl and Tmed4ΔTreg mice or Tmed4ΔTreg mouse splenic Tregs with forcible expression of IRE1α (Tmed4ΔTreg + IRE1α), as assessed by the proliferation of activated CD4+ T cells at various Treg ratios (Tresp/Treg = 4:2 and 4:1). n = 3, detected on day 3. (G) Western blot analysis of PERK expression and its downstream proteins in Ern1fl/fl (W) and Ern1ΔTreg (K) Tregs treated with DMSO or α-CD3/α-CD28 antibodies, alone or together with 1 μM TG, for 16–20 hours. Data are presented as the mean ± SEM of biologically independent samples and represent at least 3 independent experiments, each involving 3 mice per group. *P < 0.05, **P < 0.01, and ****P < 0.0001, by 1-way ANOVA with Tukey’s multiple-comparison test (AD and F).
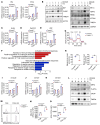
Figure 9
Figure 9. TMED4 suppresses IRE1α degradation in collaboration with BIP.
(A and B) Western blot (A) and quantitative analysis (B) of IRE1α decay in HEK293T cells transfected or not with TMED4-FLAG and BIP-HA, under treatment with 50 μg/mL CHX with or without 1 μM TG for the indicated durations. (C and D) Western blot analysis of immunoprecipitation assays on HEK293T cells transfected with TMED4-FLAG and IRE1α (C), or BIP-HA (D), which were treated or not with 1 μM TG for 6 hours. (E) Western blot analysis of immunoprecipitation assays on HEK293T cells transfected with BIP-HA, IRE1α-FLAG, or TMED4-FLAG, which were treated or not with TG for 6 hours. Each blot represents 3 independent experiments with similar results.
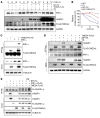
Figure 10
Figure 10. TMED4 suppresses HRD1/BIP-mediated IRE1α degradation.
(A) WB analysis of immunoprecipitation assays on HEK293T cells transfected with the indicated plasmids, which were treated or not with TG for 6 hours. (B) Western blot analysis of IRE1α K48-linked polyubiquitination assays on HEK293T cells transfected with the indicated plasmids. (C) Western blot analysis of the IRE1α K48-linked polyubiquitination assay on primary WT and Tmed4-deficient iTregs using anti–K48-linked Ub-FLAG beads. Each blot represents 3 independent experiments with similar results.

References

    1. Sakaguchi S, et al. Regulatory T cells and immune tolerance. Cell. 2008;133(5):775–787. doi: 10.1016/j.cell.2008.05.009. - DOI - PubMed
    1. Josefowicz SZ, et al. Regulatory T cells: mechanisms of differentiation and function. Annu Rev Immunol. 2012;30:531–564. doi: 10.1146/annurev.immunol.25.022106.141623. - DOI - PMC - PubMed
    1. Rudensky A. Foxp3 and dominant tolerance. Philos Trans R Soc Lond B Biol Sci. 2005;360(1461):1645–1646. doi: 10.1098/rstb.2005.1731. - DOI - PMC - PubMed
    1. Wan YY, Flavell RA. Regulatory T-cell functions are subverted and converted owing to attenuated Foxp3 expression. Nature. 2007;445(7129):766–770. doi: 10.1038/nature05479. - DOI - PubMed
    1. Fontenot JD, et al. Regulatory T cell lineage specification by the forkhead transcription factor foxp3. Immunity. 2005;22(3):329–341. doi: 10.1016/j.immuni.2005.01.016. - DOI - PubMed

MeSH terms