. 2024 Oct 31;22(10):e3002650.
doi: 10.1371/journal.pbio.3002650. eCollection 2024 Oct.

Amyloid accelerator polyphosphate fits as the mystery density in α-synuclein fibrils

Affiliations

Amyloid accelerator polyphosphate fits as the mystery density in α-synuclein fibrils

Philipp Huettemann et al. PLoS Biol. .

Abstract

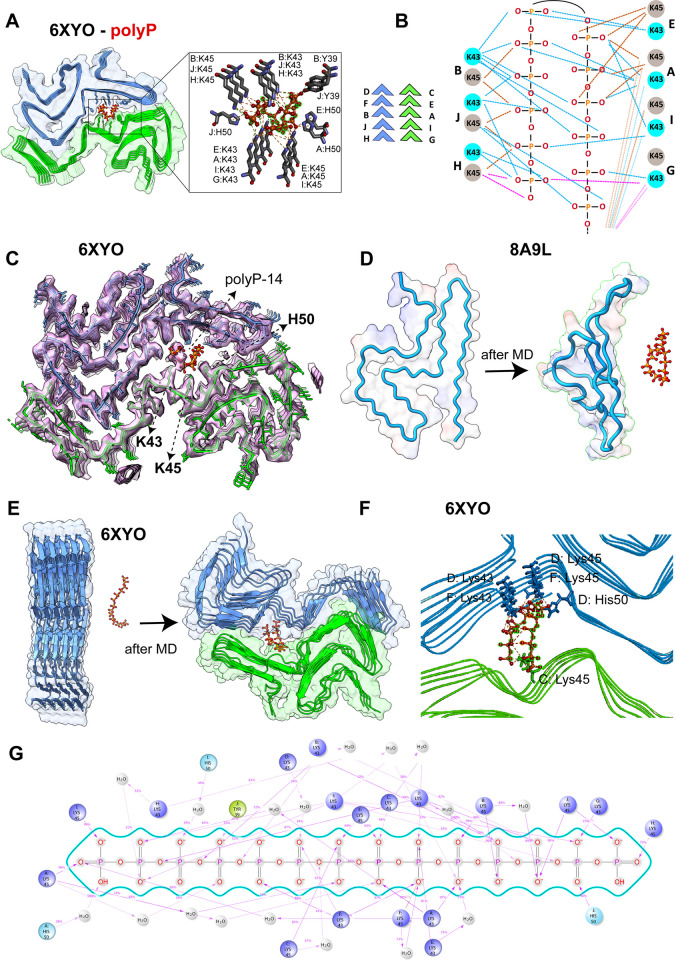
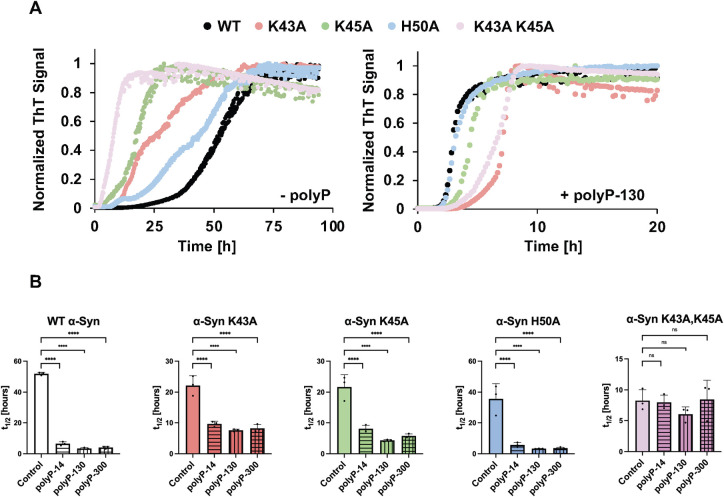
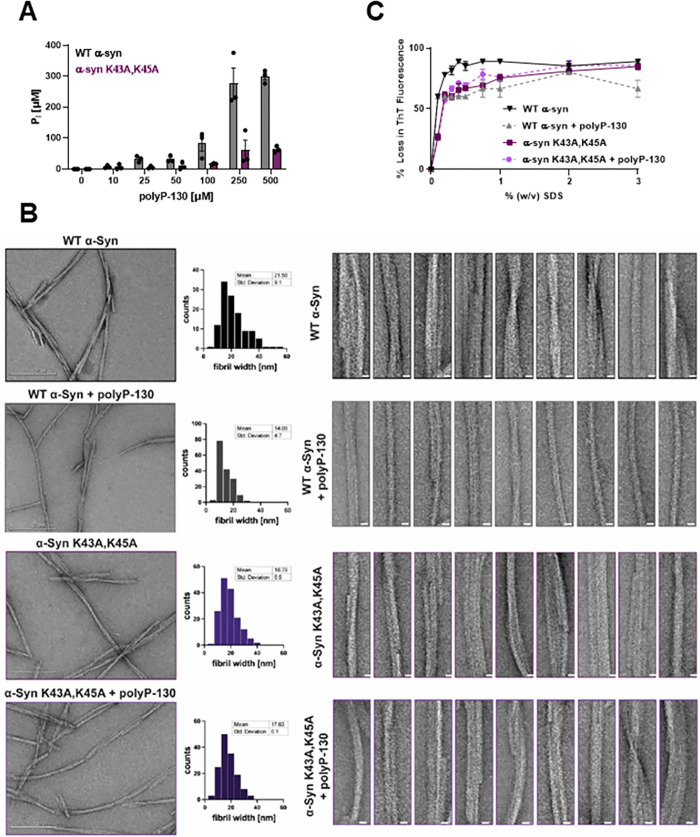
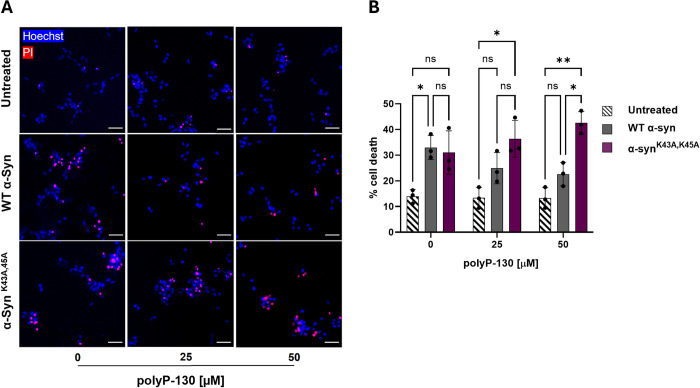
Aberrant aggregation of α-Synuclein is the pathological hallmark of a set of neurodegenerative diseases termed synucleinopathies. Recent advances in cryo-electron microscopy have led to the structural determination of the first synucleinopathy-derived α-Synuclein fibrils, which contain a non-proteinaceous, "mystery density" at the core of the protofilaments, hypothesized to be highly negatively charged. Guided by previous studies that demonstrated that polyphosphate (polyP), a universally conserved polyanion, significantly accelerates α-Synuclein fibril formation, we conducted blind docking and molecular dynamics simulation experiments to model the polyP binding site in α-Synuclein fibrils. Here, we demonstrate that our models uniformly place polyP into the lysine-rich pocket, which coordinates the mystery density in patient-derived fibrils. Subsequent in vitro studies and experiments in cells revealed that substitution of the 2 critical lysine residues K43 and K45 with alanine residues leads to a loss of all previously reported effects of polyP binding on α-Synuclein, including stimulation of fibril formation, change in filament conformation and stability as well as alleviation of cytotoxicity. In summary, our study demonstrates that polyP fits the unknown electron density present in in vivo α-Synuclein fibrils and suggests that polyP exerts its functions by neutralizing charge repulsion between neighboring lysine residues.


Conflict of interest statement

UJ is a member of the PLOS Biology Editorial Board.

Figures

Fig 1
Fig 1. Atomistic interactions between polyP and α-Syn fibrils.
(A) Molecular docking simulations showing polyP-14 binding sites in α-Syn fibrils (PDB ID: 6XYO). α-Syn and polyP-14 molecules are shown as surface and ball-and-stick, respectively in the cartoon structure. (B) A schematic model showing the bonding network (dashed lines) for lysine residues in α-Syn molecules distributed on the upper (D-F-B-J-H, blue) and lower (C-E-A-I-G, green) protofilaments of the 6XYO fibril structure. Shown are interactions (represented by pink lines) representing 1 free phosphate unit interacting with the first 2 α-Syn molecules facing opposite in each protofilament (chains G and H). (C) Cartoon structure of polyP-14 (red) docked against the 6XYO electron density (EMD-10650) showing the mystery high-charge density core is occupied by 7 phosphate units in polyP-14. (D, E) MD snapshots showing the polyP interaction with α-Syn monomeric single filament structure 8A9L (D) and fibril protofilament 6XYO (E) before and after 50 ns MD simulation in Gromacs. (F) Cartoon structure of the final MD snapshots obtained from 50 ns all-atom MD simulation in Gromacs showing the α-Syn residues in 6XYO interacting with polyP-14 (in stick). Chain names for individual residues are shown before each colon. (G) Interaction pattern of polyP-14 with α-Syn residues (6XYO fibril structure) obtained from 100 ns MD simulation in Desmond. The underlying data can be found in Mendeley (see data statement for details).
Fig 2
Fig 2. Effect of polyP on the kinetics of WT and mutant α-Syn fibril formation.
(A) ThT fluorescence curves of 100 μM α-Syn wild-type and mutant proteins in the absence (left panel) or presence of 500 μM polyP-130 (in Pi-units) in 40 mM KPi, 50 mM KCl (pH 7.5). n = 3 and a representative graph is shown. (B) Respective half-lives (t1/2) of fibril formation. The mean of 3 experiments ±SD is shown. Statistical analysis was prepared with one-way ANOVA (ns P-value >0.05, **** P-value <0.0001) comparing each polyP sample to the control sample (absence of polyP). The underlying data can be found in Mendeley (see data statement for details).
Fig 3
Fig 3. Effects of K43, K45 substitution on polyP binding, fibril stability and morphology.
(A) Fibrils of 100 μM WT α-Syn or α-SynK43A,45A were formed in the absence or presence of increasing amounts of polyP-130 for 48 h. Fibrils were pelleted, washed with high salt buffer and digested in 1 M hydrochloric acid to hydrolyze all bound polyP. Free Pi was measured using molybdate. (B) TEM of 100 μM WT α-Syn or α-SynK43A,K45A fibrils formed in the absence or presence of 500 μM polyP-130. Frequency distribution plots of the fibril width distributions and the mean fibril width and standard deviation are given in the middle panel. Ten representative filaments are presented on the right for each condition (scale bar is 10 nm). At least 100 fibrils per condition were measured across 3 separate experiments. (C) Fibrils were prepared in the absence or presence of 500 μM polyP-130 as before. Fibrils of WT α-Syn (black/gray) or α-SynK43A,K45A mutant (light and dark purple) fibrils were supplemented with ThT and incubated with increasing concentrations of SDS at 37°C for 5 min. Changes in ThT fluorescence were recorded; n = 3; mean ± SD is shown. The underlying data can be found in Mendeley (see data statement for details).
Fig 4
Fig 4. Effects of polyP binding on cytoxicity of α-Syn.
(A) Representative overlays of differentiated SH-SY5Y cells after 24 h treatment with 4 μM sonicated fibrils of WT α-Syn or α-SynK43A,K45A mutant in absence or presence of of polyP-130. Cells were stained with Hoechst to indicate all cells present in the image (blue), and with propidium iodide (PI) to identify the dead cells (red). Cells positive for both stains are observed in magenta and considered dead. All others are considered alive. Scale bars are 40 μm. (B) Quantification of the results shown in (A). Measurements are in biological triplicates with bars representing mean ± SD. Statistical analysis was performed using two-way ANOVA; ns: not significant; *p < 0.05, **p < 0.005. Pairwise comparisons across the subgroups did not show any significant differences. The underlying data can be found in Mendeley (see data statement for details).

Update of

References

    1. Goedert M, Jakes R, Spillantini MG. The Synucleinopathies: Twenty Years On. J Parkinsons Dis. 2017;7(s1):S51–S69. doi: 10.3233/JPD-179005 - DOI - PMC - PubMed
    1. Davidson WS, Jonas A, Clayton DF, George JM. Stabilization of alpha-synuclein secondary structure upon binding to synthetic membranes. J Biol Chem. 1998;273(16):9443–9449. - PubMed
    1. Bendor JT, Logan TP, Edwards RH. The function of alpha-synuclein. Neuron. 2013;79(6):1044–1066. - PMC - PubMed
    1. Burre J, Sharma M, Tsetsenis T, Buchman V, Etherton MR, Sudhof TC. Alpha-synuclein promotes SNARE-complex assembly in vivo and in vitro. Science. 2010;329(5999):1663–1667. doi: 10.1126/science.1195227 - DOI - PMC - PubMed
    1. Bartels T, Choi JG, Selkoe DJ. alpha-Synuclein occurs physiologically as a helically folded tetramer that resists aggregation. Nature. 2011;477(7362):107–110. - PMC - PubMed

LinkOut - more resources