. 2024 Nov;386(6721):eadp7710.
doi: 10.1126/science.adp7710. Epub 2024 Nov 1.

A molecular mechanism for bright color variation in parrots

Affiliations

A molecular mechanism for bright color variation in parrots

Roberto Arbore et al. Science. 2024 Nov.

Abstract

Parrots produce stunning plumage colors through unique pigments called psittacofulvins. However, the mechanism underlying their ability to generate a spectrum of vibrant yellows, reds, and greens remains enigmatic. We uncover a unifying chemical basis for a wide range of parrot plumage colors, which result from the selective deposition of red aldehyde- and yellow carboxyl-containing psittacofulvin molecules in developing feathers. Through genetic mapping, biochemical assays, and single-cell genomics, we identified a critical player in this process, the aldehyde dehydrogenase ALDH3A2, which oxidizes aldehyde psittacofulvins into carboxyl forms in late-differentiating keratinocytes during feather development. The simplicity of the underlying molecular mechanism, in which a single enzyme influences the balance of red and yellow pigments, offers an explanation for the exceptional evolutionary lability of parrot coloration.


Conflict of interest statement

Competing interests

RAr, SB, JB, PMA, JCC, and MC are inventors on a pending patent application related to the technology described in this work. The remaining authors declare no conflict of interest.

Figures

None
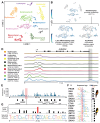
The molecular bases of bright color variation in parrots.
Yellow-to-red color variation in parrot feathers is due to differences in the concentration of yellow carboxyl and red aldehyde psittacofulvin pigments. Through a combination of genetic and biochemical techniques, we identify aldehyde dehydrogenase 3 family member A2 (ALDH3A2) as a key enzyme regulating the balance of aldehyde to carboxyl pigments in parrots.
Fig. 1
Fig. 1. Psittacofulvin-based coloration diversity and evolution in parrots.
Phylogeny of all 354 species of parrots showing whether species display: 1) only yellow/green hues (yellow circles), 2) only red hues (red circles), 3) simultaneously yellow/green and red hues (orange circles), or 4) no psittacofulvin-based hues (grey circles, i.e., color is produced by other mechanisms with no contribution from psittacofulvins). We note that green and yellow color patches were considered together since the green color is a combination of blue structural coloration and yellow psittacofulvin pigments. Lineages including several species of identical phenotype are collapsed. The phylogeny demonstrates the high number of evolutionary shifts among parrots expressing yellow, green, and red. Across the bottom is a compilation of photographs showcasing the diversity of parrot plumage coloration. From left to right: golden parakeet (Guaruba guarouba, CC BY-SA 3.0 Rodrigo Menezes), budgerigar (Melopsittacus undulatus, ML619272371, Robert Hynson), rosy-faced lovebird (Agapornis roseicollis, ML215809581, Niall Perrins), galah (Eolophus roseicapilla, CC BY-SA 2.0 Jim Bendon), scarlet macaw (Ara macao, ©Milan Kořínek, www.biolib.cz/en), and red lory (Eos bornea, CC BY-SA 3.0 Doug Janson).
Fig. 2
Fig. 2. Chemical analyses of psittacofulvin pigmentation.
(A) Schematic representation of a tail feather of a scarlet macaw (Ara macao). Psittacofulvins are deposited within the keratin matrix of both the ramus and barbules of feathers (insert). Psittacofulvins are linear polyenes with various carbon chain lengths (C16 examples shown) and with distinct terminal groups (aldehyde or carboxyl groups). (B) The plot illustrates the magnitude of the shifts in the positions of the two primary Raman bands characteristic of psittacofulvins (both y-axis). The dashed line at 0 represents the average spectrum. The variation in these Raman bands is shown for yellow, green, and red feathers of the studied parrot species. From left to right: budgerigar (Melopsittacus undulatus), Pesquet’s parrot (Psittrichas fulgidus), rosy-faced lovebird (Agapornis roseicollis), scarlet macaw (Ara macao), galah (Eolophus roseicapilla), cockatiel (Nymphicus hollandicus), and kea (Nestor notabilis). (C) Chromatograms of the presence of positive ions of the exact molecular masses corresponding to psittacofulvins in the carboxyl (green) and aldehyde forms (magenta) detected by mass spectrometry (HRAM-QTOF). Peak 1 corresponds to C14 carboxylic acid, 2 to C14 aldehyde, 3 to C16 carboxylic acid, 4 to C16 aldehyde, 5 to C18 carboxylic acids, and 6 to C18 aldehyde. The mass spectrometry peaks correspond to the UV-detected absorbance peaks (UHPLC UV/VIS) shown below – the slight shift is caused by the delay from the UV/VIS detection to the HRAM-QTOF molecular mass detection. The UHPLC UV/VIS chromatogram (black) shows absorbance peaks detected at 421 nm, which is close to the average maximum absorbance wavelength of psittacofulvins. The plots at the bottom show the maximum absorbance shifts between the carboxyl and aldehyde forms of psittacofulvins with different carbon chain lengths. The absorbance spectra have been normalized such that the maximum intensity = 1. (D) Differences in psittacofulvin content in red, yellow, and green feathers of parrot species. The total amount of psittacofulvins or the relative amount of each type was quantified as the area under the peak in the exact mass spectrum relative to the baseline. The upper row shows the total amount of psittacofulvins, the middle row shows the relative abundance of psittacofulvins of different lengths, and the lower row shows the ratio of aldehyde (magenta) and carboxylic forms (green). The order of the species is the same as in panel (B).
Fig. 3
Fig. 3. The genetic and transcriptomic bases of psittacofulvin colors.
(A) Images of red and yellow morphs of the dusky lory (Pseudeos fuscata). Photo credits: David Hosking/ Minden Pictures. (B) Differences in pigment composition between feathers of red and yellow morphs. The left panel shows the relative ratio of aldehydes (magenta) and carboxylic acids (green), and the right panel shows the relative abundance of psittacofulvins of different chain lengths. (C) Genetic mapping of the color polymorphism. The top panel summarizes the genome-wide association analysis using whole-genome resequencing data. Each dot represents the −log10 transformation of Wald test P-values for each variant. The horizontal red line indicates the Bonferroni-corrected genome-wide significance (P = 1.16 × 10⁻⁸;-log10 (P) = 7.94) based on the total number of tests (n = 4,303,897). The bottom panel is a zoomed-in view of the region of association shown on top. The protein-coding genes contained within the represented genomic interval are shown at the top of the panel. (D) Patterns of gene expression of ALDH3A2 between dusky lory morphs. The left panel shows RNA-seq normalized raw read counts (circles) from regenerating feather follicles from red (n = 3, left) and yellow (n = 3, right) birds, with colored boxes illustrating the range of read counts for the respective color morph. The right panel shows the proportion of full-length Iso-seq transcripts (n = 152) linked to the red and yellow alleles in heterozygous individuals (n = 3). (E) Differential expression of ALDH3A2 between red feathers from the forehead region (d) versus green feathers from the back (a), chest (b), and head (c) regions of rosy-faced lovebirds (n = 8 for each region; Welch’s test followed by Games-Howell post-hoc test; * adj-P < 0.05; ** adj-P < 0.01; *** adj-P < 0.001; **** adj-P < 0.0001). The sampled regions are indicated on the illustration at the bottom left of the graph.
Fig. 4
Fig. 4. ALDH3A2 expression during feather development.
(A) scRNA-seq analyses of budgerigar regenerating feather follicles (t-SNE projection): annotation of 6,262 cells clustered by gene expression profiles into 10 major clusters. Plots of selected marker genes supporting the annotation are reported for each cluster in fig. S11. (B) Expression of keratin 17-like (KRT17L; ENSMUNG00000017214.1) in keratinocyte clusters (t-SNE projection). (C) scRNA-seq analyses of keratinocytes (n = 2,753 cells; UMAP projections). Left: heatmap of average expression levels of five cell cycle genes defining a sub-cluster of dividing keratinocytes (i.e., follicle proliferation zone). Middle: heat map of average expression levels of five genes defining late differentiating keratinocytes (fig. S12) (34). Right: heatmap of ALDH3A2 expression. (D) Analyses of keratinocyte differentiation. Left: branching trajectory reflecting differentiation from dividing cells in the proliferative zone towards cells forming specialized structures in the follicle (i.e., the marginal, axial, and barbule plates). The color indicates the distance of each cell (pseudotime) from the root node in the proliferative zone (solid arrow): blue = early cells; yellow = late differentiating cells. The red line shows the trajectory leading to a sub-population of keratinocytes with the highest expression of ALDH3A2, likely axial plate cells (34). Right: normalized gene expression of KRT17L (all keratinocytes), CDK1 (proliferating keratinocytes), SCEL (late differentiating keratinocytes), and ALDH3A2 in the cells along the trajectory (n = 859 cells). ALDH3A2 expression is enriched towards late differentiating keratinocytes.
Fig. 5
Fig. 5. A regulatory region overlaps the candidate causal mutation.
(A) snATAC-seq analyses (t-SNE projection): annotation of 1,700 cells into nine major clusters based on chromatin accessibility profiles. (B) Accessibility at the Keratin 17-like promoter in the keratinocyte clusters (t-SNE projection; gene ID: ENSMUNG00000017214.1). (C) snATAC-seq analyses of keratinocytes (t-SNE projections). Left: heatmap of averaged DNA accessibility at the promoters of five genes identified in the scRNA-seq analyses as defining late differentiating keratinocytes (Fig. 4C and figs. S12 and S14) (34). Right: heatmap of DNA accessibility at the ATAC peak identified downstream of ALDH3A2 and corresponding to a late differentiating keratinocyte-specific regulatory element. (D) Chromatin accessibility at the ALDH3A2 locus for different cell types: normalized transposase cut site counts per cluster smoothed over 400 bp windows. The grey area highlights the region shown in (E). (E) Characterization of the regulatory element downstream of ALDH3A2 in budgerigar. Top: predicted nucleotide contribution for chromatin accessibility (per-nucleotide averaged contribution score from three independently trained models). Bottom: annotation of predicted TF binding sites enriched in late differentiating keratinocytes. The red box highlights the region shown in (G). (F) Sequence logos for 14 representative motifs (chosen from 10 motif sub-families) among the top 57 predicted TF binding sites which showed the greatest change in position-weight matrix (PWM) score between C and T nucleotides (shown on the right, rounded to one significant digit). (G) Top: per-nucleotide evolutionary conservation (phyloP scores) across 363 bird genomes projected to the budgerigar sequence. Only positive scores, indicating slower evolution than expected, are reported. The dashed line represents the non-coding genome-wide top 5th percentile. Bottom: per-nucleotide evolutionary conservation across 100 parrot genomes. Nucleotide symbols at the same position are scaled according to their frequency. The height of the stacked symbols describes the information content at each position in the alignment.
Fig. 6
Fig. 6. The role of aldehyde dehydrogenase activity in psittacofulvin biosynthesis.
(A-C) Analyses of yeast pigment extracts. A wild-type yeast strain (WT) was transformed to express PKS (WT + PKS). Two additional strains expressing PKS were engineered by knocking-out HFD1, the yeast homologous of ALDH3A2 (Δhfd1 + PKS), and by knocking-out HFD1 and knocking-in the dusky lory ALDH3A2 (Δhfd1 + PKS + ALDH3A2). (A) UHPLC spectra of yeast pigment extracts. Extracts for all the PKS-expressing strains contained varying amounts of chemically distinct psittacofulvins represented by three main absorbance peaks (1-3). Expression of ALDH3A2 (strain: Δhfd1 + PKS + ALDH3A2) restored the WT chromatogram (WT + PKS). (B) Absorption spectra of the main UHPLC peaks: peak 1 (carboxyl psittacofulvin), peaks 2a and 2b (alcohol psittacofulvins), and peak 3 (aldehyde psittacofulvin). (C) Chromatographic separation of peaks 2a and 2b. (D) Proposed model of psittacofulvin biosynthesis. After priming with an acetyl unit, PKS acts cyclically by adding malonyl units to extend the polyketide chain which is then reductively released as an aldehyde. Aldehyde psittacofulvin products are then converted into the carboxyl form by ALDH3A2. Tuning of ALDH3A2 enzymatic activity (e.g., by modulation of its expression) from ‘low’ to ‘high’ is sufficient to explain the production of red-to-yellow psittacofulvins in parrots.

References

    1. Cuthill IC, Allen WL, Arbuckle K, Caspers B, Chaplin G, Hauber ME, Hill GE, Jablonski NG, Jiggins CD, Kelber A, Mappes J, et al. The biology of color. Science. 2017;357:eaan0221. - PubMed
    1. Svensson, Wong Carotenoid-based signals in behavioural ecology: a review. Behaviour. 2011;148:131–189.
    1. Amundsen T. Why are female birds ornamented? Trends Ecol Evol. 2000;15:149–155. - PubMed
    1. Hill GE. In: Bird Coloration, Volume 2: Function and Evolution. Hill GE, McGraw KJ, editors. Harvard University Press; Cambridge, MA: 2006. Female choice for ornamental coloration; pp. 137–200.
    1. Terrill RS, Shultz AJ. Feather function and the evolution of birds. Biological Reviews. 2023;98:540–566. - PubMed

Publication types

Substances

LinkOut - more resources