. 2024 Nov;386(6721):573-580.
doi: 10.1126/science.adn1369. Epub 2024 Oct 31.

Two codependent routes lead to high-level MRSA

Affiliations

Two codependent routes lead to high-level MRSA

Abimbola Feyisara Adedeji-Olulana et al. Science. 2024 Nov.

Abstract

Methicillin-resistant Staphylococcus aureus (MRSA), in which acquisition of mecA [which encodes the cell wall peptidoglycan biosynthesis component penicillin-binding protein 2a (PBP2a)] confers resistance to β-lactam antibiotics, is of major clinical concern. We show that, in the presence of antibiotics, MRSA adopts an alternative mode of cell division and shows an altered peptidoglycan architecture at the division septum. PBP2a can replace the transpeptidase activity of the endogenous and essential PBP2 but not that of PBP1, which is responsible for the distinctive native septal peptidoglycan architecture. Successful division without PBP1 activity requires the alternative division mode and is enabled by several possible chromosomal potentiator (pot) mutations. MRSA resensitizing agents differentially interfere with the two codependent mechanisms required for high-level antibiotic resistance, which provides opportunities for new interventions.


Conflict of interest statement

Competing interests: The authors declare no competing interests.

Figures

Fig. 1
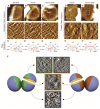
Fig. 1. Methicillin treatment of MRSA alters the architecture of the cell wall.
From left to right, (A-C) show the outer surfaces of newly revealed septa, in samples of isolated sacculi of untreated (A) SH1000, (B) mecA+, and (C) mecA+ rpoB* respectively. (D-E) Show the outer surface of the newly revealed septa of (D) mecA+ and (E) mecA+ rpoB* treated with methicillin (1.5 and 25 μg ml-1 respectively). In all columns: (i) shows an individual fragment of sacculus corresponding to the outer surface of the septum. Topographical height (z) range presented in each of these images (from left to right) is 140, 140, 150, 120, and 185 nm. (ii) Shows pseudo-three dimensional (3D) high resolution AFM images of the sections indicated by the white boxes in (i). Topographical height (z) range presented in each of these images (from left to right) is 7.5, 10, 7.5, 12, and 20 nm. (iii) Represents the combined angular histogram of fibre orientation of AFM high-resolution images similar to those in (ii). The fibre orientation analysis method used for the orientation detection is described in the Materials and Methods section. (F) Shows an interpretative diagram of different architectures (concentric rings, dense mesh, and open mesh) observed by high-resolution AFM on different surfaces (outer surface of newly revealed septa, inner surface of the septa, and outer surface of cell periphery) of untreated (left-hand side) and antibiotic treated (right-hand side) MRSA cell wall. The green colour represents the concentric rings associated with the outer surface of the septum of untreated cells, blue colour shows the open mesh at the cell periphery, yellow colour depicts the dense mesh on the inner wall of the cell and lastly the brown colour represents the dense mesh on the outer surface of the septum after treatment with methicillin. The modified AFM images in Fig. 1F span 400 nm by 400 nm in x and y dimension.
Fig. 2
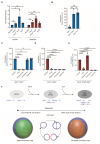
Fig. 2. Loss of PBP1 transpeptidase activity can be compensated for by rpoB* but not mecA.
(A) Representation of pbp1* genetic constructs. An ectopic pbp1 copy, at the lipase (geh) locus is controlled by the Pspac promoter. The pbp1 gene at its native locus has a point mutation (940T>G) resulting in inactivation of transpeptidase activity (S314A, pbp1*). The mecA+ gene is expressed from its native promoter at the lysA locus. In rpoB*, a point mutation results in an amino acid substitution (H929Q) in RpoB. tet, ery and kan represent tetracycline, erythromycin and kanamycin resistance cassettes, respectively. The graphics were created with BioRender.com. (B) Plating efficiency of pbp1*, pbp1* mecA+, pbp1* rpoB* and pbp1* mecA+ rpoB* without IPTG. Plating efficiencies were compared to controls grown with IPTG, using a one-way ANOVA with Dunnett’s multiple comparison test (ns, not significant; ****, P < 0.0001). Error bars show mean ± standard deviation (SD). (C) Fluorescence microscopy images of pbp1* rpoB* grown +/-IPTG for 4 h, labelled with ADA-DA (5 min) and then NHS-ester Alexa Fluor 555 to image nascent PG and cell wall, respectively. Images are z stack average intensity projections. Scale bars = 2 μm. (D) Quantification of cellular phenotypes based on ADA-DA incorporation in pbp1* rpoB* incubated with IPTG (+) or without IPTG (-), n = 511 and 654 (respectively). Examples of cells classified as abnormal with misshapen septal rings (yellow arrowhead), accumulation of ADA-DA at septal centre, ‘plug’ (blue arrowhead) and mislocalized ADA-DA incorporation (white arrowhead) are shown C. (E) AFM images of newly exposed outer surface of the septum after cell division of pbp1* rpoB* grown +/-IPTG for 4 h, reveal lack of concentric-ring structures in -IPTG. (i) Representative outer septal surfaces with height (z) range of 120 nm and the HS applies to both. (ii) Shows pseudo-3D AFM high resolution images of the region within the white box in (i). Topographical height (z) range (top) = 9.5 nm, and HS (bottom) = 21 nm. (iii) Represents the combined angular histogram of fibre orientation of AFM high resolution images similar to those in (ii).
Fig. 3
Fig. 3. Loss of PBP2 transpeptidase activity can be compensated for by mecA but not rpoB*.
(A-B) Schematic representation of mecA+ pbp2* (SJF5807) and mecA+ rpoB* pbp2* (SJF5809) genetic constructs. A copy of pbp2 with an inactive transpeptidase domain (pbp2*, 1191-1192TC>GG, S398G) was placed under the control of the Pspac promoter at the lipase (geh) locus of SH1000, pbp2 at its native locus was then deleted (marked with tet). In both strains, a copy of a mecA gene expressed from its native promoter was located at the lysA locus. In mecA+ rpoB* pbp2* (SJF5809) the rpoB gene has a point mutation which results in H929Q (rpoB*). ery and kan represent erythromycin and kanamycin resistance cassettes, respectively. The graphics in (A-B) were created with BioRender.com. (C) Growth curves of mecA+ pbp2 (SJF5663) grown in the presence (+) or absence (-) of IPTG, and mecA+ pbp2* (SJF5807) (+ IPTG). (D) Growth curves of mecA+ rpoB* pbp2 (SJF5674) grown in the presence (+) or absence (-) of IPTG, and mecA+ rpoB* pbp2* (SJF5809) (+ IPTG). (E-F) AFM images of the newly revealed outer surface of septa after cell division of mecA+ pbp2* (SJF5807) and mecA+ rpoB* pbp2* (SJF5809), respectively. In both E and F, (i) shows the outer surface of a representative septum. Topographical height (z) range of 130 nm applies to both. (ii) Shows a pseudo-3D high resolution image of the region within the white box in (i). Height range are 12 nm for E(ii) and 7 nm for F(ii). (iii) Represents the combined angular histogram of fibre orientation of AFM high resolution images similar to images in (ii).
Fig. 4
Fig. 4. Dual pathways to high-level MRSA.
(A) Measurement of ppGpp and (p)ppGpp levels in SH1000, mecA+, rpoB* and mecA+ rpoB, normalised to SH1000 and compared using one-way ANOVA with Dunnet’s multiple comparison test (ns, not significant; *, P <0.05; **, P <0.01). P values from left to right: 0.8727, 0.0425, 0.8290, 0.1470, 0.0051 and 0.4317. Error bars show the mean ± SD. (B) Plating efficiency of pbp1*, pbp1* rpoB* and pbp1* rel without IPTG. Plating efficiency values were compared to controls with IPTG, using one-way ANOVA with Tukey’s multiple comparison test (**, left to right P = 0.0049 and 0.003). Error bars show mean ± SD. (C-E) Plating efficiency of (C) pbp1* rpoB*, (D) mecA+ pbp2*and (E) mecA+ rpoB* pbp2* without IPTG supplemented with ECg, norgestimate, clomiphene or spermine. Data were compared to no inhibitor plates (Control) using a one-way ANOVA with Dunnett’s multiple comparison test (ns, not significant; ****, P <0.0001; ***, P = 0.0004). Error bars show mean ±SD from three independent biological repeats. (F) Model for high-level MRSA development via acquisition of mecA and pot mutations (including rpo* and rel*), resulting in low-level (low) and subsequently high-level (high) resistance. In MSSA, without methicillin, PBP1 and PBP2 transpeptidases are active. In low-level MRSA, at intermediate methicillin levels sufficient to kill MSSA, PBP2 transpeptidase is inhibited but complemented by PBP2a. In high-level MRSA, at methicillin levels sufficient to kill MSSA and low-level MRSA, PBP2 and PBP1 transpeptidases are inhibited but complemented by PBP2a transpeptidase and Pot*, respectively. PBP1 transpeptidase is responsible for the characteristic septal PG concentric rings, during conventional cell division (green regions on blue cell background). In high-level MRSA, in the presence of methicillin, septal PG concentric rings are replaced by mesh (brown regions on blue cell background), revealing a novel mode of cell division requiring both PBP2a and Pot*.

Comment in

References

    1. Ribeiro da Cunha B, Fonseca LP, Calado CRC. Antibiotic discovery: Where have we come from, where do we go? Antibiot. 2019;8:1–21. doi: 10.3390/antibiotics8020045. - DOI - PMC - PubMed
    1. Antimicrobial Resistance Collaborators. Global burden of bacterial antimicrobial resistance in 2019: a systematic analysis. Lancet. 2022;399:629–655. - PMC - PubMed
    1. Lakhundi S, Zhang K. Methicillin-resistant Staphylococcus aureus: Molecular characterization, evolution, and epidemiology. Clin Microbiol Rev. 2018;31 doi: 10.1128/CMR.00020-18. - DOI - PMC - PubMed
    1. Hartman BJ, Tomasz A. Low-affinity penicillin-binding protein associated with beta-lactam resistance in Staphylococcus aureus. J Bacteriol. 1984;158:513–516. doi: 10.1128/jb.158.2.513-516.1984. - DOI - PMC - PubMed
    1. Vollmer W, Blanot D, De Pedro MA. Peptidoglycan structure and architecture. FEMS Microbiology Reviews. 2008;32:149–167. - PubMed

Publication types

MeSH terms