. 2024 Dec 5;111(12):2720-2734.
doi: 10.1016/j.ajhg.2024.10.003. Epub 2024 Oct 30.

3D genome topology distinguishes molecular subgroups of medulloblastoma

Affiliations

3D genome topology distinguishes molecular subgroups of medulloblastoma

John J Y Lee et al. Am J Hum Genet. .

Abstract

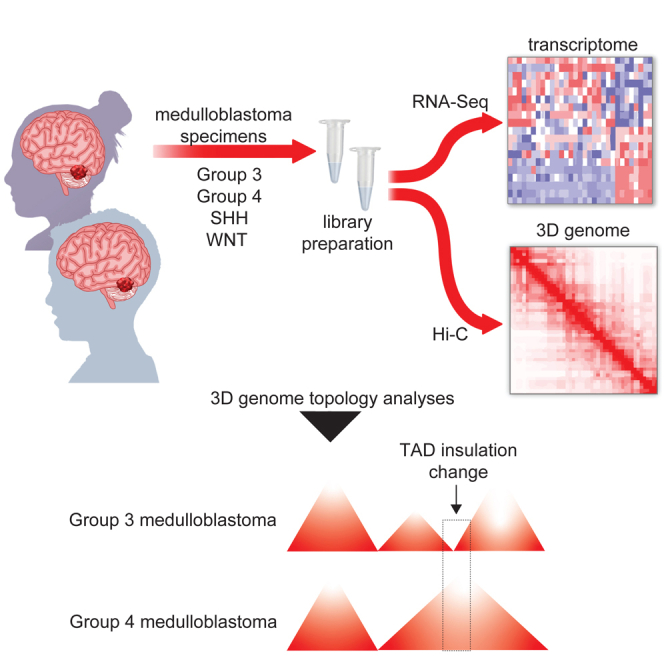
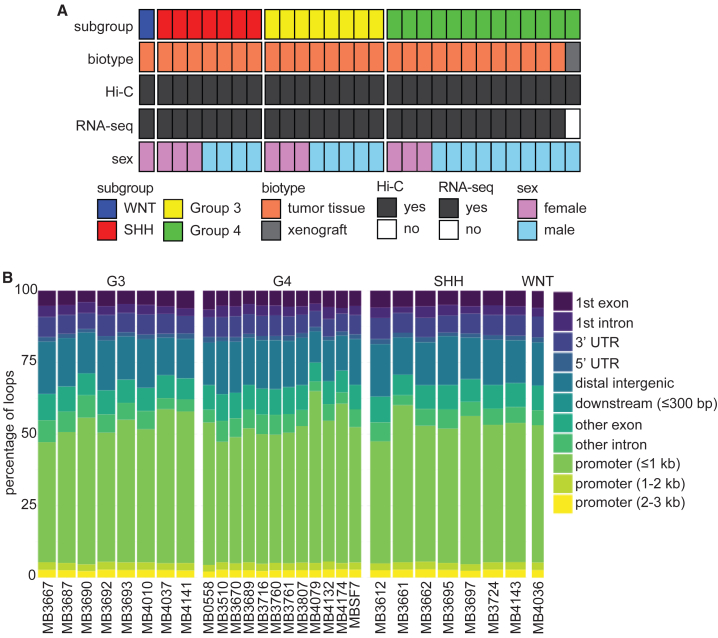
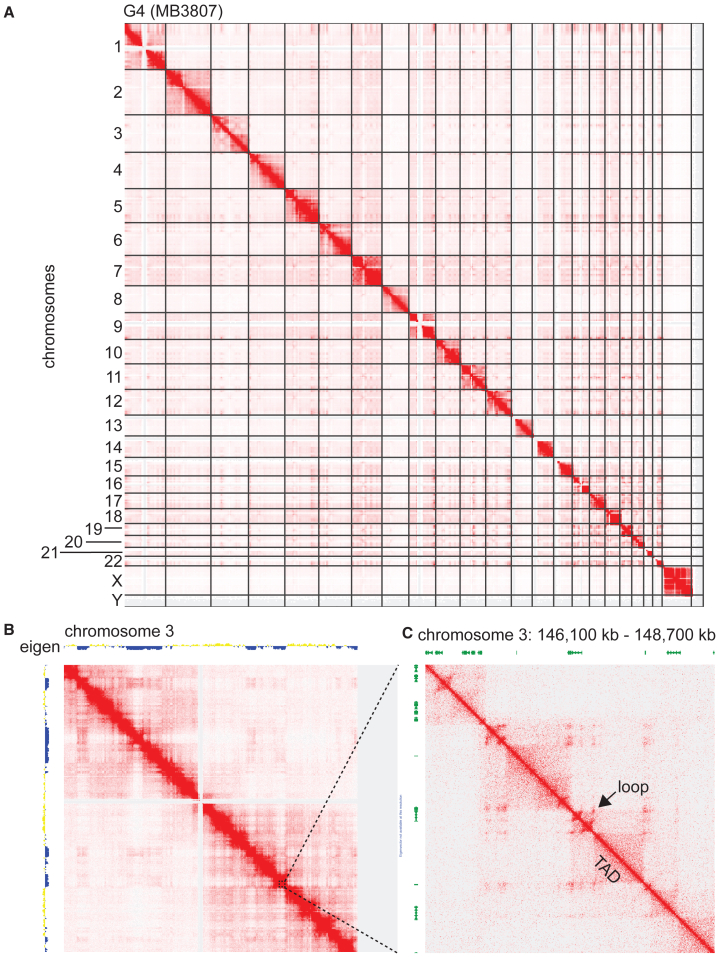
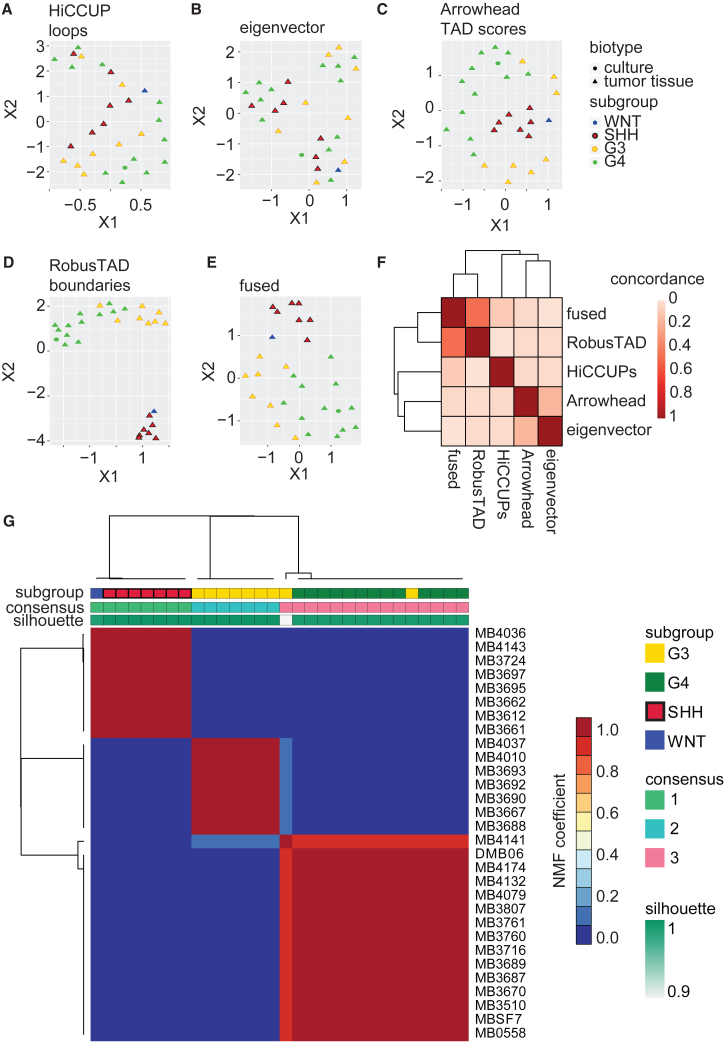
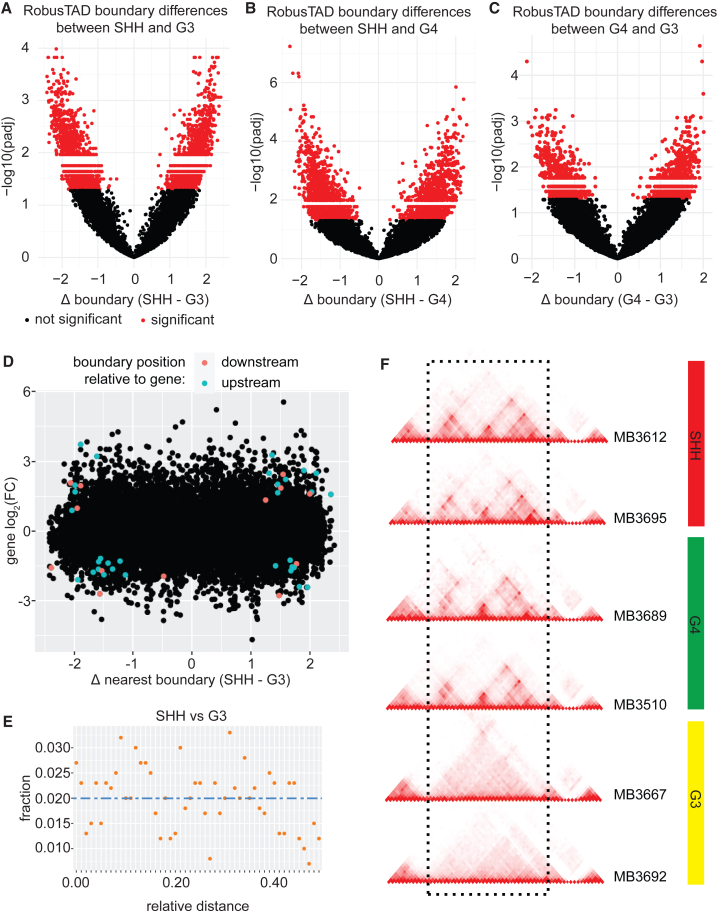
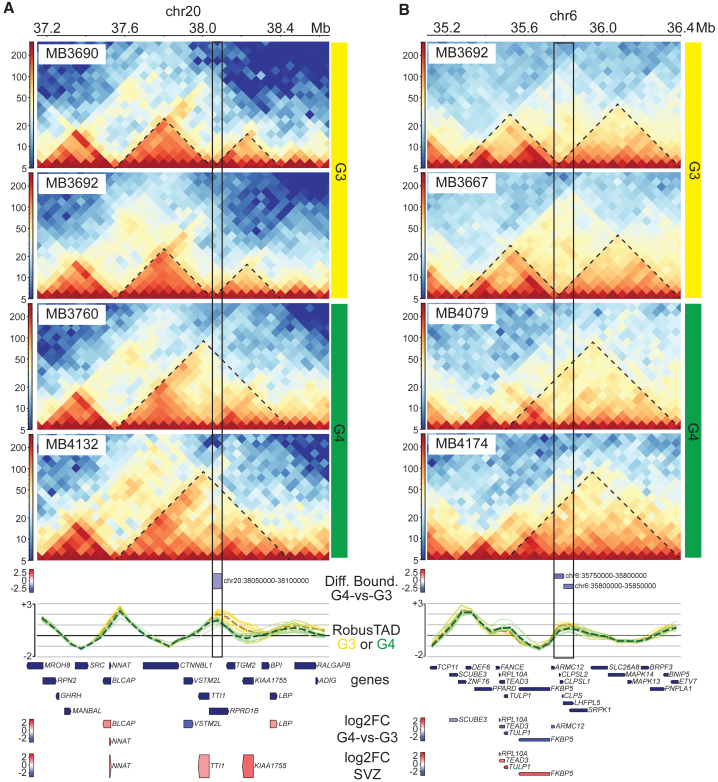
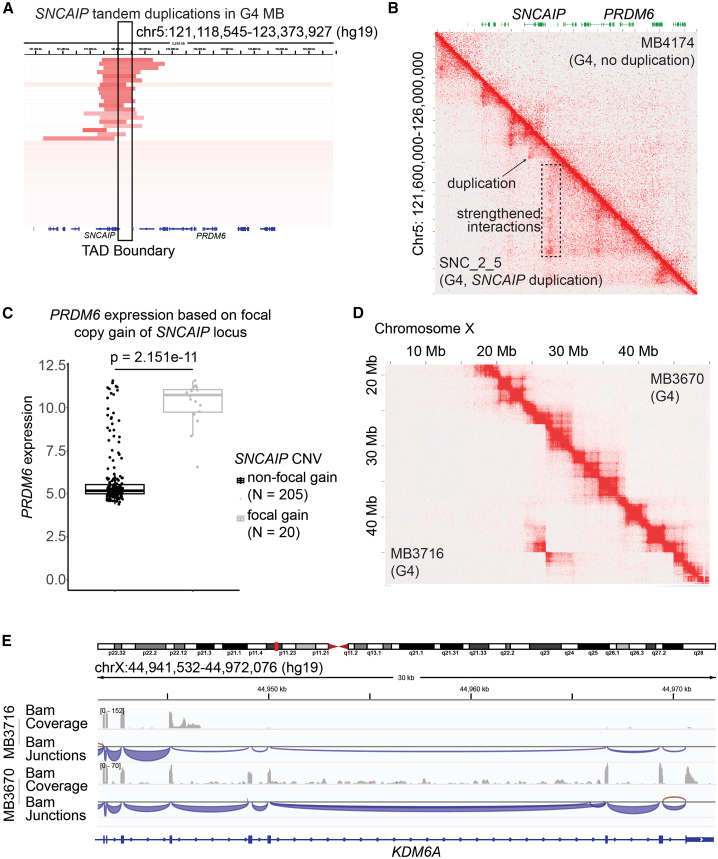
Four main medulloblastoma (MB) molecular subtypes have been identified based on transcriptional, DNA methylation, and genetic profiles. However, it is currently not known whether 3D genome architecture differs between MB subtypes. To address this question, we performed in situ Hi-C to reconstruct the 3D genome architecture of MB subtypes. In total, we generated Hi-C and matching transcriptome data for 28 surgical specimens and Hi-C data for one patient-derived xenograft. The average resolution of the Hi-C maps was 6,833 bp. Using these data, we found that insulation scores of topologically associating domains (TADs) were effective at distinguishing MB molecular subgroups. TAD insulation score differences between subtypes were globally not associated with differential gene expression, although we identified few exceptions near genes expressed in the lineages of origin of specific MB subtypes. Our study therefore supports the notion that TAD insulation scores can distinguish MB subtypes independently of their transcriptional differences.

Keywords: 3D genome; CNS tumor; Hi-C; cancer; medulloblastoma; transcriptome.


Conflict of interest statement

Declaration of interests The authors declare no competing interests.

Figures

None
Graphical abstract
Figure 1
Figure 1
3D genome and transcriptome analyses of MB subgroups (A) Summary of the MB samples used for the present study. Molecular subgroup, biotype, and biological sex are indicated for each specimen profiled by Hi-C. The successful generation of matched RNA-seq data is also indicated for each specimen. (B) Bar plot showing the percentage of loop anchors that fall within different types of genomic annotations.
Figure 2
Figure 2
Example of MB Hi-C data (A) Hi-C contact map for all chromosomes for sample MB3807, a G4 MB. Data for all chromosomes are displayed to enable visual detection of putative intra- and inter-chromosomal physical interactions between genomic regions. (B) Hi-C contact map for chromosome 3 of MB3807. Eigenvalues are represented along both the x and y axes, where yellow (positive) values identify type A compartments, and blue (negative) values correspond to type B compartments. (C) Enlarged image from (B) illustrates the use of Hi-C data to visualize TAD and loop structures. This region corresponds to 2,600 kb of genome on chromosome 3. Annotated genes are displayed in green along both the x and y axes of the heatmap. Computationally inferred loops are clearly visible off the diagonal, as indicated by the arrow in one example. TADs are visible as “triangles” as indicated in one example.
Figure 3
Figure 3
TAD insulation scores distinguish MB molecular subgroups (A) UMAP plot of MB samples based on loops called with HiCCUP. (B) UMAP plot generated with eigenvector values, which provide information on compartments. (C) UMAP plot generated with TAD scores called with Arrowhead. (D) UMAP plot generated with boundary scores calculated with RobusTAD. (E) UMAP plot based on fused distance metrics. (F) Concordance between metrics derived from Hi-C data described in this study. (G) Non-negative matrix factorization (NMF) analysis of TAD insulation scores for all MB samples, with k = 3. MB subgroups (G3, G4, SHH, and WNT) are indicated at the top of the image, highlighting the ability of TAD insulation scores to discriminate between subgroups. Consensus clusters are shown in green, blue, and pink. Silhouette scores provide the confidence level for the clustering calls for each sample.
Figure 4
Figure 4
TAD boundary differences between MB subgroups (A) Volcano plot displaying differential TAD boundaries between SHH and G3 MBs. Negative log10 of the adjusted p value (padj) are displayed along the y axis. (B) Volcano plot displaying differential TAD boundaries between SHH and G4 medulloblastomas. (C) Volcano plot displaying differential TAD boundaries between G4 and G3 medulloblastomas. (D) Relationship between gene expression and differences in boundary strengths between SHH and G3 MB. Each dot represents a gene. Colored dots represent differentially expressed genes between SHH and G3. Pink dots represent genes that are differentially expressed and have a differential boundary downstream. Blue dots represent genes that are differentially expressed and have a differential boundary upstream. (E) Relationship between differentially expressed genes and their distance from differential TAD boundaries between SHH and G3 samples. Blue dashed line represents the expected frequency of observations based on 50 kb bins. Orange points represent the observed frequencies. (F) Example of differential boundaries between G3 and other MB subgroups. Two SHH samples, two G4 samples, and two G3 samples are displayed. The dashed rectangle highlights a genomic region with locally different topology in G3 tumors compared to SHH and G4. Specifically, the TAD structures observed in SHH and G4 MB are lost in G3 samples.
Figure 5
Figure 5
TAD boundary differences between G3 and G4 MB (A) Heatmap representing Hi-C contacts along a region of chromosome 20 (coordinates indicated at the top). Imputed boundary strengths along this region are shown as yellow and green lines for G3 and G4 tumors, respectively, below the heatmap. Gene expression levels are shown in the bottom diagram, including differential gene expression between G4 and G3 tumors. (B) Heatmap representing Hi-C contacts along a region of chromosome 6. Imputed boundary strengths along this region are shown as yellow and green lines for G3 and G4 tumors, respectively, below the heatmap. Gene expression levels are shown in the bottom diagram.
Figure 6
Figure 6
Relationships between SVs, 3D genome, and transcriptional profiles (A) Location of recurrent SNCAIP tandem duplications in the context of TAD boundaries in G4 MB. The coordinates of the region of chromosome 5 shown are indicated at the top. Copy number data for each MB sample are displayed along rows. MB samples with duplications are visible at the top of the diagram, with duplicated regions shown in red. The TAD boundary between the SNCAIP and PRDM6 loci is highlighted with a black rectangle. (B) Observed minus expected (Obs-Exp) contact frequencies were determined by Hi-C data for a G4 MB with SNCAIP duplication (lower half) and for a G4 sample without the duplication (upper half). The genomic region represented is on chromosome 5 (coordinates shown along the y axis of the heatmap). (C) PRDM6 transcriptional levels in samples with and without the PRDM6 duplication. p value was calculated with the two-tailed Mann Whitney U test. (D) Inference of an SV affecting the KDM6A locus in a G4 MB (lower half of the Hi-C map). A G4 sample without SVs at this locus is displayed in the upper half of the heatmap. (E) RNA-seq data were used to determine the effects of the SV at the KDM6A locus on the transcriptional levels of this gene.

References

    1. Northcott P.A., Korshunov A., Witt H., Hielscher T., Eberhart C.G., Mack S., Bouffet E., Clifford S.C., Hawkins C.E., French P., et al. Medulloblastoma comprises four distinct molecular variants. J. Clin. Oncol. Off. J. Am. Soc. Clin. Oncol. 2011;29:1408–1414. doi: 10.1200/JCO.2009.27.4324. - DOI - PMC - PubMed
    1. Roussel M.F., Robinson G.W. Role of MYC in Medulloblastoma. Cold Spring Harb. Perspect. Med. 2013;3 doi: 10.1101/cshperspect.a014308. - DOI - PMC - PubMed
    1. Hendrikse L.D., Haldipur P., Saulnier O., Millman J., Sjoboen A.H., Erickson A.W., Ong W., Gordon V., Coudière-Morrison L., Mercier A.L., et al. Failure of human rhombic lip differentiation underlies medulloblastoma formation. Nature. 2022;609:1021–1028. doi: 10.1038/s41586-022-05215-w. - DOI - PMC - PubMed
    1. Kool M., Korshunov A., Remke M., Jones D.T.W., Schlanstein M., Northcott P.A., Cho Y.-J., Koster J., Schouten-van Meeteren A., van Vuurden D., et al. Molecular subgroups of medulloblastoma: an international meta-analysis of transcriptome, genetic aberrations, and clinical data of WNT, SHH, Group 3, and Group 4 medulloblastomas. Acta Neuropathol. 2012;123:473–484. doi: 10.1007/s00401-012-0958-8. - DOI - PMC - PubMed
    1. Northcott P.A., Buchhalter I., Morrissy A.S., Hovestadt V., Weischenfeldt J., Ehrenberger T., Gröbner S., Segura-Wang M., Zichner T., Rudneva V.A., et al. The whole-genome landscape of medulloblastoma subtypes. Nature. 2017;547:311–317. doi: 10.1038/nature22973. - DOI - PMC - PubMed