. 2024 Nov 19;5(11):101806.
doi: 10.1016/j.xcrm.2024.101806. Epub 2024 Oct 30.

Lnc-H19-derived protein shapes the immunosuppressive microenvironment of glioblastoma

Affiliations

Lnc-H19-derived protein shapes the immunosuppressive microenvironment of glioblastoma

Junju Chen et al. Cell Rep Med. .

Erratum in

Abstract

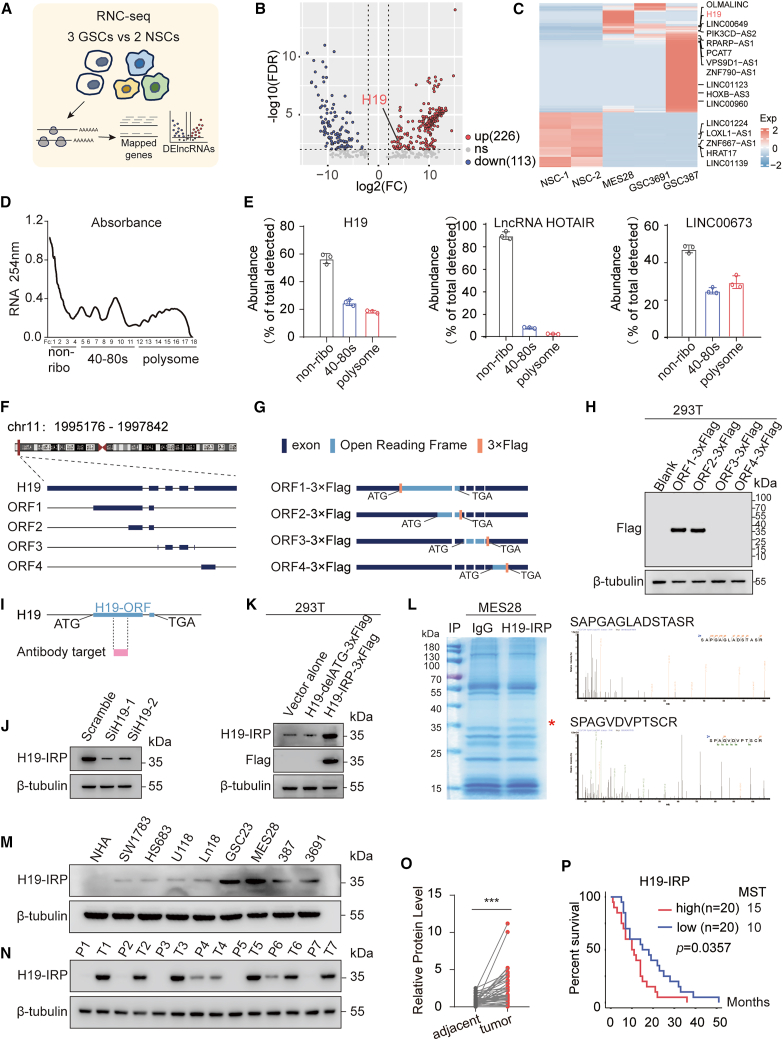
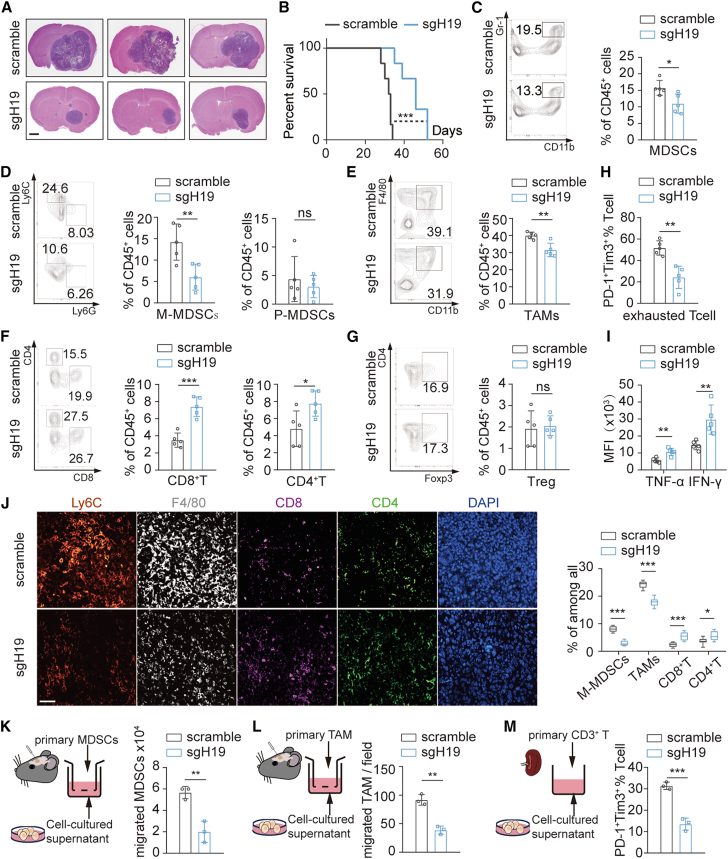
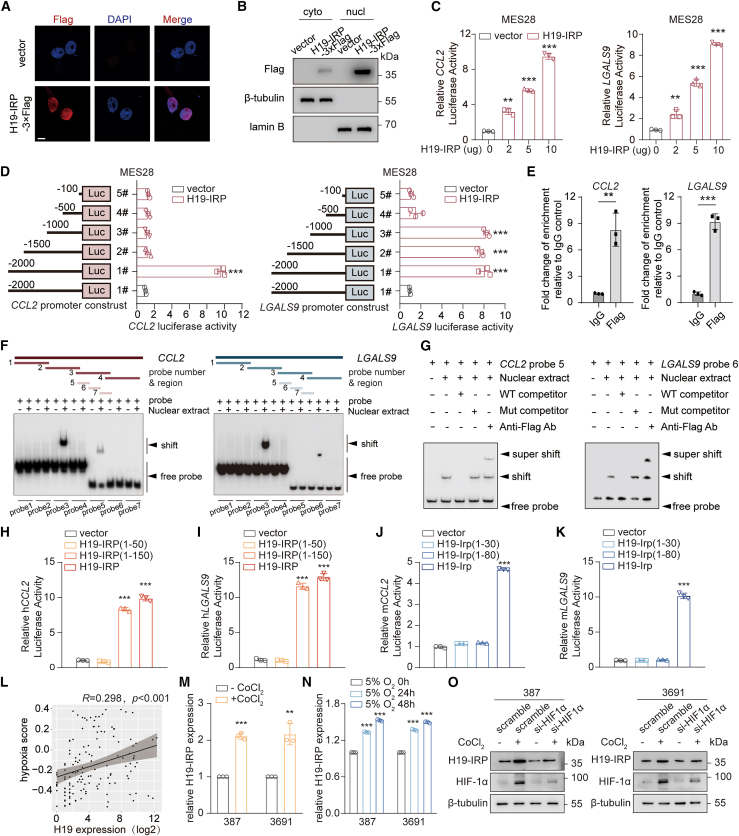
The immunosuppressive tumor microenvironment (TME) is a prominent feature of glioblastoma (GBM), the most lethal primary brain cancer resistant to current immunotherapies. The mechanisms underlying GBM-TME remain to be explored. We report that long non-coding RNA (LncRNA) H19 encodes an immune-related protein called H19-IRP. Functionally separated from H19 RNA, H19-IRP promotes GBM immunosuppression by binding to the CCL2 and Galectin-9 promoters and activating their transcription, thereby recruiting myeloid-derived suppressor cells (MDSCs) and tumor-associated macrophages (TAMs), leading to T cell exhaustion and an immunosuppressive GBM-TME. H19-IRP, overexpressed in clinical GBM samples, acts as a tumor-associated antigen (TAA) presented by major histocompatibility complex class I (MHC-I). A circular RNA vaccine targeting H19-IRP (circH19-vac) triggers a potent cytotoxic T cell response against GBM and inhibits GBM growth. Our results highlight the unrevealed function of H19-IRP in creating immunosuppressive GBM-TME by recruiting MDSCs and TAMs, supporting the idea of targeting H19-IRP with cancer vaccine for GBM treatment.

Keywords: GBM; H19; H19-IRP; LncRNA; TME; circular RNA vaccine; immunotherapy.


Conflict of interest statement

Declaration of interests The authors declare no competing interests.

Figures

None
Graphical abstract
Figure 1
Figure 1
H19 is associated with the TME and is highly expressed in GBM (A) Strategy for identifying H19 from LncRNAs that are associated with the infiltration of immune cells, negatively correlated with patient survival, and differentially expressed between tumor and adjacent tissues in the TCGA/CGGA-GBM datasets and GTEx dataset. (B–E) Spearman correlation between H19 RNA expression and the percentages of (C) activated CD8+ T cells, (D) MDSCs, (E) macrophages, and (F) Tregs. (F) Kaplan-Meier survival analysis of patients’ overall survival in TCGA (left, n = 167) and CGGA (right, n = 140) GBM patients. The upper quartile serves as the cutoff value to define high/low expression. (G) Left, UMAP plot of identified cell types from the single-cell dataset GSE182109. Right, boxplot showing H19 RNA expression in annotated cell types. (H) Relative H19 RNA levels in NHA and glioma cell lines detected by qPCR. Two-sided unpaired t test, ∗∗p < 0.01, ∗∗∗p < 0.001. (I) Fold change of H19 RNA expression (tumor specimens vs. paired adjacent brain tissues) in a cohort of GBM patients (n = 40) detected by qPCR. (J) Relative H19 RNA expression levels in the same cohort (n = 40) detected by qPCR. Two-sided paired t test, ∗∗p < 0.01. (K) The expression of H19 RNA in representative GBM patient cohorts from the TCGA and GTEx databases. Two-sided unpaired t test, ∗p < 0.05. The data in (H), (I), and (J) were pooled from three independent experiments. The data are presented as the mean ± SD. For boxplots in (G) and (K), boxes containing the median (center line), the first and third quartiles (box limits). The whiskers indicate the maxima and minima.
Figure 2
Figure 2
H19 encodes a 256-amino-acid protein (A) RNC-seq workflow. Two neural stem cell (NSC) lines and three GSC lines were subjected to RNC-seq analysis. (B) Volcano plot showing the differentially expressed LncRNAs in GSCs compared with those in NSCs. (C) Heatmap showing the different expression of LncRNA. (D and E) 293T cells transfected with the H19 plasmid were subjected to polysome profiling. H19 was detected by qPCR in the indicated fractions. LncRNA HOTAIR and LINC00673 served as negative and positive controls, respectively. (F) Illustration of the annotated genomic region of H19 and H19 RNA and the potentially translatable ORFs of H19. (G) Illustration of the different FLAG knockin strategies. (H) 293T cells were transfected with different FLAG knockin plasmid in (G). FLAG was detected by immunoblotting. (I) Illustration of the H19 antibody-targeted region. (J) H19-IRP expression in MES28 transfected with scramble, siH19-1, or siH19-2. (K) Immunoblotting of cells overexpressing the above constructs using custom anti-H19-IRP and anti-FLAG antibodies. (L) MS detection of H19-IRP-specific peptide sequences in MES28. (M) H19-IRP expression levels were measured by immunoblotting in NHAs and different glioma cell lines. (N) Immunoblotting of H19-IRP in seven randomly selected paired GBM samples using the custom anti-H19-IRP antibody. (O) Semiquantitative analysis of H19-IRP expression levels based on grayscale analysis in the cohort of 40 GBM samples. Two-sided paired t test, ∗∗∗p < 0.001. (P) Survival analysis of patients stratified by H19-IRP expression (with median expression score as cutoff value) in the same cohort. Log rank test. p = 0.0357. The data in (D), (E), (H), (J), (K), and (M) were pooled from three independent experiments. The data are presented as the mean ± SD.
Figure 3
Figure 3
H19-IRP deficiency disrupts the formation of immunosuppressive TME in GBM progression (A) H&E-stained brain slices from mice with the indicated modifications. Scale bar, 1 mm. (B) Survival analysis via an in vivo tumorigenicity assay using the indicated cells. Each group contained 6 mice. Log rank test. ∗∗∗p < 0.001. (C–G) Flow cytometric analysis of (C) MDSC (CD11b+Gr1+), (D) M-MDSC (CD11b+Ly6C+), (D) P-MDSC (CD11b+Ly6G+), (E) TAM (CD11b+F4//80+), (F) CD8+T cell (CD8+CD4), (F) CD4+T cell (CD4+CD8), and (G) Treg (CD4+Foxp3+) populations of tumors isolated from C57BL/6 mice after orthotopic implantation with the indicated cells. Each group contained 5 mice. Two-sided unpaired t test; ns, not significant, ∗p < 0.05, ∗∗p < 0.01, ∗∗∗p < 0.001. (H and I) Flow cytometric analysis of (H) PD1 and TIM-3 and (I) TNF-α and IFN-γ expression on T cells. Each group contained 5 mice. Two-sided unpaired t test, ∗∗p < 0.01. (J) Left, immunofluorescence images showing the expression of Ly6C, F4/80, CD8, and CD4 in tumor samples from mice after orthotopic implantation of the indicated cells. Right, quantification of the proportions of M-MDSC (Ly6C+), TAM (F4/80+), CD8+T cell, and CD4+T cell populations among all cells. Scale bar, 50 μm. Two-sided unpaired t test, ∗p < 0.05, ∗∗∗p < 0.001. (K and L) The migration of (K) MDSCs and (L) TAMs toward conditioned medium from the indicated cells was analyzed by transwell migration assays, which were performed in triplicate. Two-sided t test, ∗∗p < 0.01. (M) Flow cytometric analysis of PD1 and TIM-3 expression on primary CD3+ T cells cocultured with conditioned medium from the indicated cells. Two-sided unpaired t test, ∗∗∗p < 0.001. The data in (K), (L), and (M) were pooled from three independent experiments. The data are presented as the mean ± SD. For the boxplots in (J), boxes containing the median (center line), the first and third quartiles (box limits). The whiskers indicate the maxima and minima.
Figure 4
Figure 4
H19-IRP, but not H19, exerts the immunosuppressive function (A) Proliferation of GL261 cells with the indicated modifications. n = 3 independent experiments. Two-sided unpaired t test; n.s., not significant, ∗∗p < 0.01. (B) H&E-stained brain slices from mice with the indicated modifications. Scale bar, 1 mm. (C) Survival analysis via an in vivo tumorigenicity assay using the indicated cells. Each group contained 5 mice. Log rank test. ∗∗p < 0.01. (D–G) Flow cytometric analysis of (D) MDSC (CD11b+Gr1+), (E) M-MDSC (CD11b+Ly6C+), (E) P-MDSC (CD11b+Ly6G+), (F) TAM (CD11b+F4//80+), (G) CD8+T cell (CD8+CD4), and (G) CD4+T cell (CD4+CD8) populations of tumor cells isolated from C57BL/6 mice after orthotopic implantation of the indicated cells. Each group contained 6 mice. Two-sided unpaired t test; ns, nonsignificant, ∗p < 0.05, ∗∗p < 0.01, ∗∗∗p < 0.001. (H and I) Flow cytometric analysis of (H) TNF-α, IFN-γ and (I) PD1, TIM-3 expression in T cells. Each group contained 6 mice. Two-sided unpaired t test, ∗p < 0.05, ∗∗p < 0.01, ∗∗∗p < 0.001. (J) Immunofluorescence images showing the expression of Ly6C, F4/80, CD8, and CD4 in tumor samples from mice after orthotopic implantation of the indicated cells. Scale bar, 50 μm. (K and L) The proportions of M-MDSCs (Ly6C+), TAMs (F4/80+), CD8+T cells, and CD4+T cells among all cells. Two-sided unpaired t test, ∗p < 0.05, ∗∗p < 0.01, ∗∗∗p < 0.001. For boxplots in (K‒L), boxes containing the median (center line), the first and third quartiles (box limits). The whiskers indicate the maxima and minima.
Figure 5
Figure 5
H19-IRP shapes the inhibitive TME by targeting CCL2 and Galectin-9 (A) Lollipop chart showing the top 20 GO pathways related to genes differentially expressed between GL261 cells transfected with and without H19 sgRNAs, which were identified by RNA-seq. (B) GSEA analysis of monocyte chemotaxis (left) and the cellular response to interferon-gamma (right) pathways. The top 10 genes were listed below. (C) Rank plot illustrates the significance of gene expression detected by qPCR in Figure S5A. Ccl2 and Galectin-9 were the most significant changed genes. (D) Myeloid chemokines in the scramble and sgH19 groups were detected using antibody microarrays. The blue boxes indicate that CCL2, CCL19, and CCL5 were downregulated in the sgH19 group. The “no background” regions may be due to the neglect of the influence of bubbles during incubation. (E) Semiquantitative grayscale analysis of (D). CCL2, CCL19, and CCL5 were significantly downregulated in the sgH19 group compared with the scramble group. (F and G) ELISA analysis of CCL2 and Galectin-9 expression in the scramble and sgH19 groups. Two-sided unpaired t test, ∗∗∗p < 0.001. (H) Left, immunohistochemistry (IHC) images of CCL2 and Galectin-9 in tumor samples from mice after orthotopic implantation of the indicated cells. Scale bar, 50 μm. Right, Semiquantitative scoring of CCL2 and Galectin-9 expression in tumor samples from mice after orthotopic implantation of the indicated cells. Two-sided unpaired t test, ∗∗p < 0.01, ∗∗∗p < 0.001. (I and J) Migration of (I) MDSCs and (J) TAMs toward conditioned medium from GL261 treated with scramble or sgH19 supplemented with recombinant CCL2. Two-sided unpaired t test, ∗∗p < 0.01. (K) Percentage of PD1+Tim-3+ T cells cocultured with conditioned medium from GL261 treated with scramble or sgH19 and supplemented with recombinant Galectin-9. Two-sided unpaired t test, ∗∗∗p < 0.001. (L) Illustration of the in situ GBM model in C57BL/6 mice and treatment with anti-PD1 antibody. (M) Survival analysis of mice intracranially implanted with GL261 cells with sgH19 or scramble control cells and treated with anti-PD1 antibody or PBS (n = 5 per group). (N) Representative images of H&E-stained brain slices from mice subjected to the indicated treatments in (M). Scale bar, 1 mm (O) Flow cytometric analysis of MDSC, M-MDSC, P-MDSC, TAM, CD8+T cell, and CD4+T cell populations in tumors isolated from C57BL/6 mice after orthotopic implantation of the indicated cells. Two-sided unpaired t test, ∗p < 0.05, ∗∗p < 0.01, ∗∗∗p < 0.001. (P) Flow cytometric analysis of TNF-α and IFN-γ in T cells and the percentage of PD1+Tim-3+ T cells. Two-sided unpaired t test, ∗p < 0.05, ∗∗p < 0.01, ∗∗∗p < 0.001. The data in (F), (G), (I), (J), and (K) were pooled from three independent experiments. For boxplots in (H), boxes containing the median (center line), the first and third quartiles (box limits). The whiskers indicate the maxima and minima.
Figure 6
Figure 6
H19-IRP directly activates the transcription of CCL2 and Galectin-9 (A) Representative immunofluorescence image of 293T cells transfected with H19-IRP-3×FLAG and stained with anti-FLAG antibody. Scale bar, 5 μm. (B) Immunoblotting of H19-IRP-3×FLAG in the indicated cellular fraction of 293T cells using anti-FLAG antibody. (C) Luciferase activity driven by CCL2 (left) and LGALS9 (right) in MES28 transfected with increasing doses of the H19-IRP-overexpressing plasmid. Two-sided t test, ∗∗p < 0.01, ∗∗∗p < 0.001. (D) Luciferase activity of the CCL2 (left) and LGALS9 (right) promoter fragments fused to a luciferase reporter gene in MES28. Two-sided t test, ∗∗∗p < 0.001. (E) Chromatin immunoprecipitation (ChIP)-qPCR analysis of the binding site of H19-IRP-3×FLAG in the CCL2 (left) and LGALS9 (right) promoters in MES28 transfected with the H19-IRP-3×FLAG plasmid. Two-sided t test, ∗∗p < 0.01, ∗∗∗p < 0.001. (F) EMSA was performed using the nuclear extract of MES28 transfected with H19-IRP-3×FLAG and 7 specific biotin-labeled CCL2 (left) and LGALS9 (right) probes. Independent experiments were performed three times with similar results. The top bars represent the promoter position of CCL2/LGALS9 corresponding to the probe. (G) EMSA was performed using the nuclear extract of MES28 transfected with H19-IRP-3×FLAG, biotin-labeled CCL2 or LGALS9 probes, an unlabeled CCL2 or LGALS9 probes (wild-type competitor), biotin-labeled mutated CCL2 or LGALS9 probes (Mut competitor), and anti-FLAG antibody. Independent experiments were performed three times with similar results. (H and I) The activities of serially truncated homo-H19-IRP in MES28 transfected with CCL2 (H) and LGALS9 (I) promoter luciferase reporter vectors. Two-sided t test, ∗∗∗p < 0.001. (J and K) The activities of serially truncated murine H19-Irp in GL261 cells transfected with the CCL2 (J) and LGALS9 (K) promoter luciferase reporter vectors. Two-sided t test, ∗∗∗p < 0.001. (L) Correlation between H19 expression and hypoxia score in the CGGA-GBM dataset. R and p values were determined by Pearson correlation. (M) Quantification of the protein level of H19-IRP in 387 and 3,691 GSCs treated with CoCl2 to mimic hypoxia detected by immunoblotting based on gray scale. Two-sided t test, ∗∗p < 0.01, ∗∗∗p < 0.001. (N) 387 and 3,691 GSCs were cultured under 5% oxygen for the indicated times, and the protein level of H19-IRP was detected by immunoblotting and quantified based on gray scale. Two-sided t test, ∗∗∗p < 0.001. (O) Immunoblotting of H19-IRP and HIF-1α expression in 387 and 3,691 GSCs treated with CoCl2 and HIF-1α siRNAs. The data in (B–K) and (M–O) were pooled from three independent experiments.
Figure 7
Figure 7
H19-IRP, a tumor-associated antigen, has potential value as a vaccine target (A) Expression levels of H19 in (left) human and (right) mouse normal organs. The data were obtained from the ArrayExpress Archive (www.ebi.ac.uk/arrayexpress/) under the accession numbers E-MTAB-1733 and GSE10246. The data are presented as boxes containing the median (center line), the first and third quartiles (box limits). The whiskers indicate the maxima and minima. (B) Immunoblot showing the protein levels of H19-Irp in GBM tumor and different health organs from C57BL/6 mice. (C) Schematic of the immunopeptidome analysis of MES28. Two peptide segments (pep1: ASVGSSTW and pep2: TRRGGRGGVNEL) that bind to HLA class I were identified. (D) Left, schematic of the IFN-γ ELISpot assay. Right, IFN-γ ELISpot well image of immunogenic peptides. T cells treated with PMA + ionomycin (Iono) were used as a positive control. T-cells-only group was served as negative control. (E) Illustration of the homo-circH19 plasmid structure. The arrow indicates the starting position and direction of translation. (F) A schematic of the homo-circH19-vac vaccination study in tumor-bearing humanized mice is shown. (G) Images of H&E-stained brain slices from mice subjected to the indicated treatments. Scale bar, 1 mm (left). Quantification of HE-stained brain sections from the groups of vector-vac and homo-circH19-vac (n = 3) (right). Two-sided t test, ∗∗∗p < 0.001. (H) Survival analysis of mice intracranially implanted with MES28 injected with homo-circH19-vac or vector-vac (n = 5 per group). Log rank test. ∗∗p < 0.01. (I) Flow cytometric analysis of M-MDSCs, TAMs, CD8+T cells, CD4+T cells, TNF-α, IFN-γ, and the degree of exhaustion in T cells from tumors isolated from huHSC-NCG humanized mice after orthotopic implantation of the indicated cells. Each group contained 5 mice. Two-sided t test, ∗p < 0.05, ∗∗p < 0.01, ∗∗∗p < 0.001. The data in (B) and (D) were pooled from three independent experiments.

References

    1. Aldape K., Brindle K.M., Chesler L., Chopra R., Gajjar A., Gilbert M.R., Gottardo N., Gutmann D.H., Hargrave D., Holland E.C., et al. Challenges to curing primary brain tumours. Nat. Rev. Clin. Oncol. 2019;16:509–520. doi: 10.1038/s41571-019-0177-5. - DOI - PMC - PubMed
    1. Le D.T., Uram J.N., Wang H., Bartlett B.R., Kemberling H., Eyring A.D., Skora A.D., Luber B.S., Azad N.S., Laheru D., et al. PD-1 Blockade in Tumors with Mismatch-Repair Deficiency. N. Engl. J. Med. 2015;372:2509–2520. doi: 10.1056/NEJMoa1500596. - DOI - PMC - PubMed
    1. Robert C., Schachter J., Long G.V., Arance A., Grob J.J., Mortier L., Daud A., Carlino M.S., McNeil C., Lotem M., et al. Pembrolizumab versus Ipilimumab in Advanced Melanoma. N. Engl. J. Med. 2015;372:2521–2532. doi: 10.1056/NEJMoa1503093. - DOI - PubMed
    1. Topalian S.L., Hodi F.S., Brahmer J.R., Gettinger S.N., Smith D.C., McDermott D.F., Powderly J.D., Carvajal R.D., Sosman J.A., Atkins M.B., et al. Safety, Activity, and Immune Correlates of Anti–PD-1 Antibody in Cancer. N. Engl. J. Med. 2012;366:2443–2454. doi: 10.1056/NEJMoa1200690. - DOI - PMC - PubMed
    1. Reardon D.A., Brandes A.A., Omuro A., Mulholland P., Lim M., Wick A., Baehring J., Ahluwalia M.S., Roth P., Bähr O., et al. Effect of Nivolumab vs Bevacizumab in Patients With Recurrent Glioblastoma. JAMA Oncol. 2020;6:1003–1010. doi: 10.1001/jamaoncol.2020.1024. - DOI - PMC - PubMed

MeSH terms