. 2024 Nov 13;32(11):2004-2018.e9.
doi: 10.1016/j.chom.2024.10.006. Epub 2024 Oct 30.

Longitudinal analysis of the gut microbiota during anti-PD-1 therapy reveals stable microbial features of response in melanoma patients

Affiliations

Longitudinal analysis of the gut microbiota during anti-PD-1 therapy reveals stable microbial features of response in melanoma patients

Angeli D G Macandog et al. Cell Host Microbe. .

Abstract

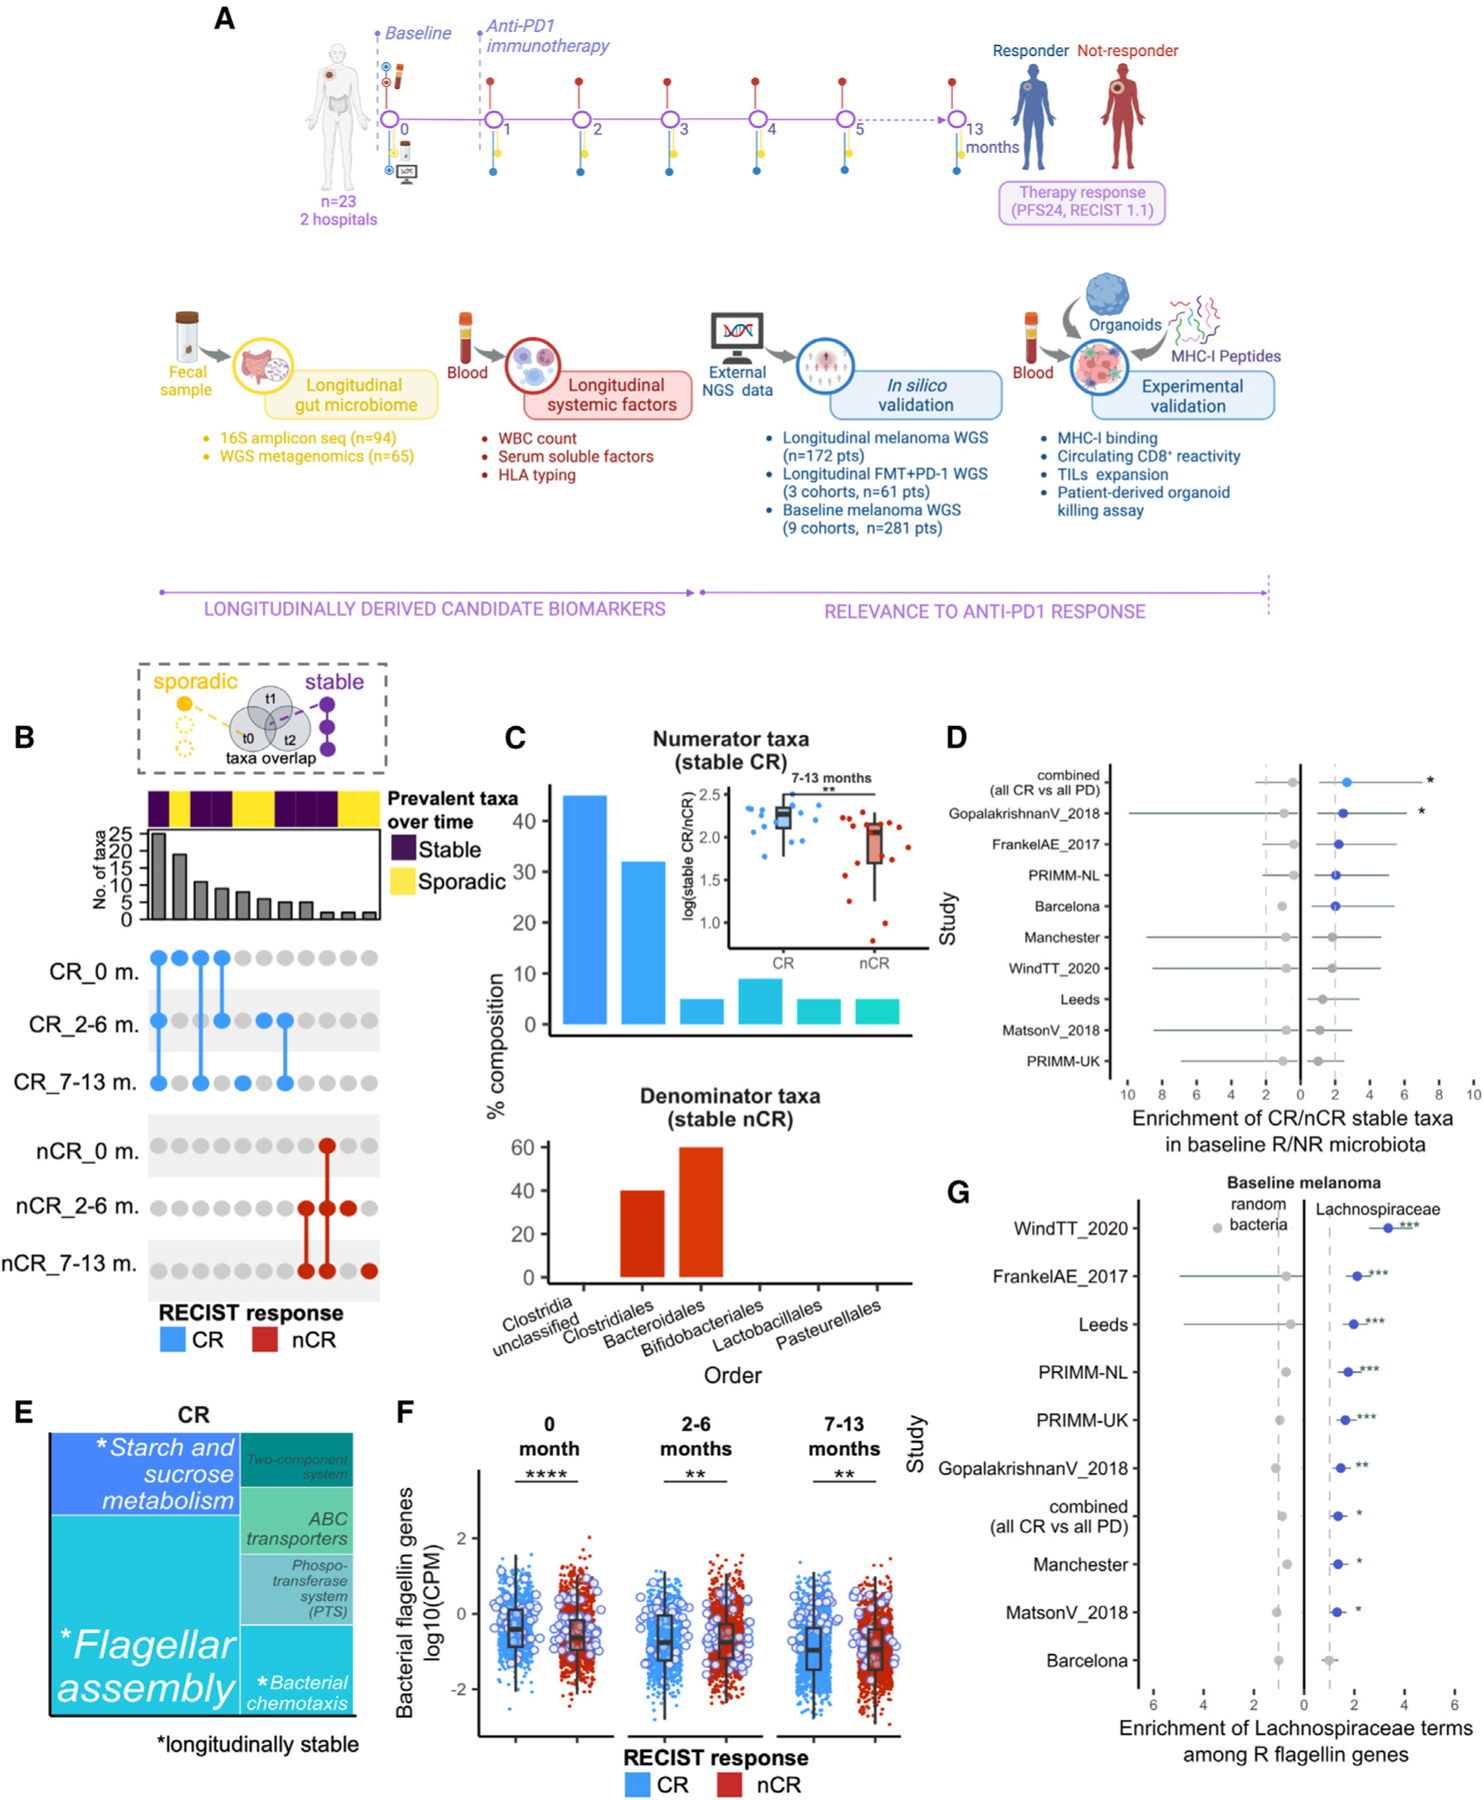
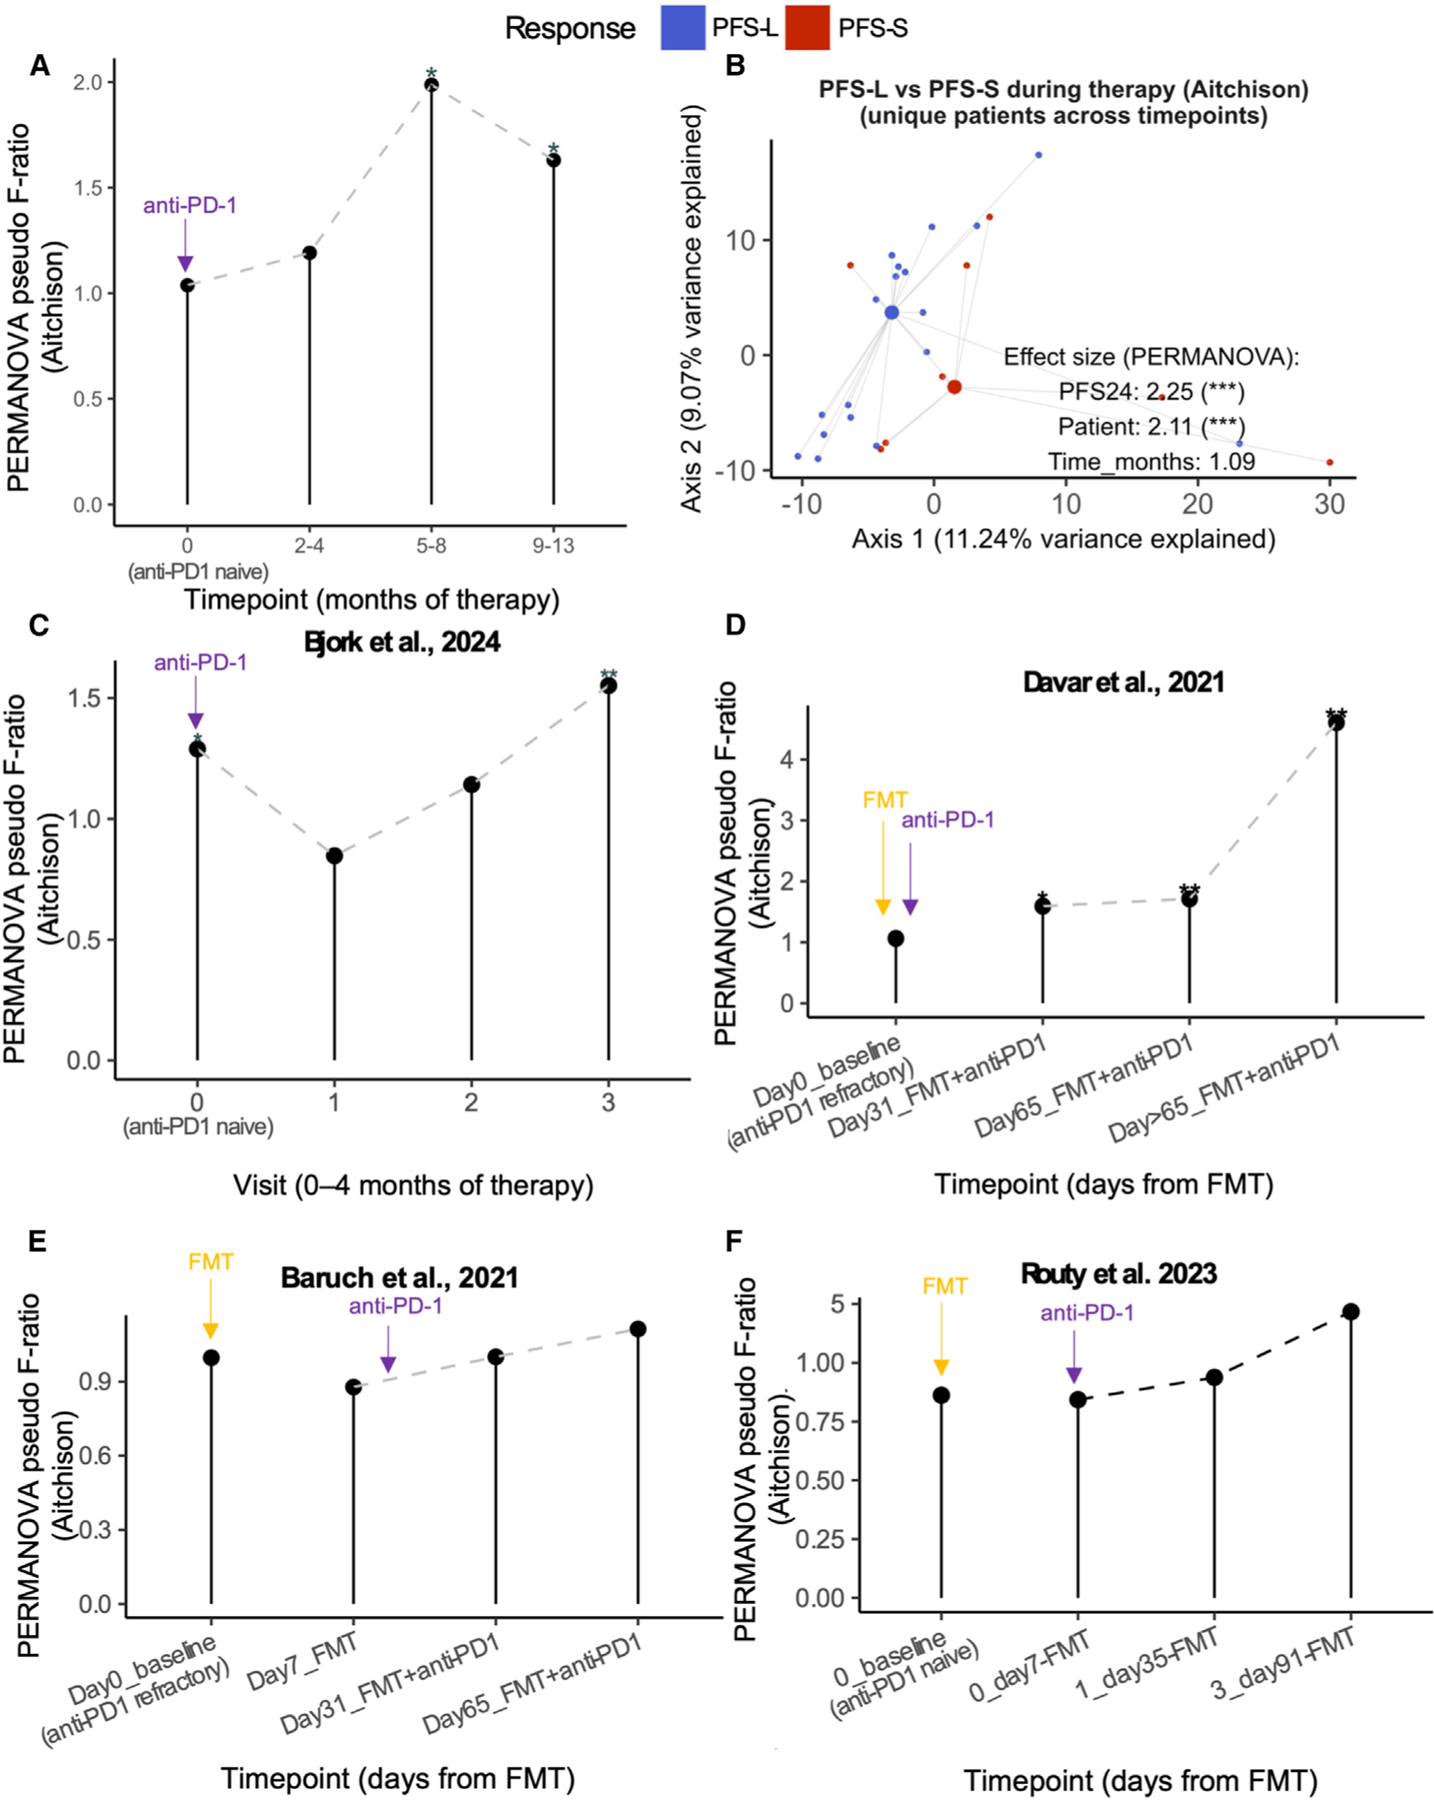
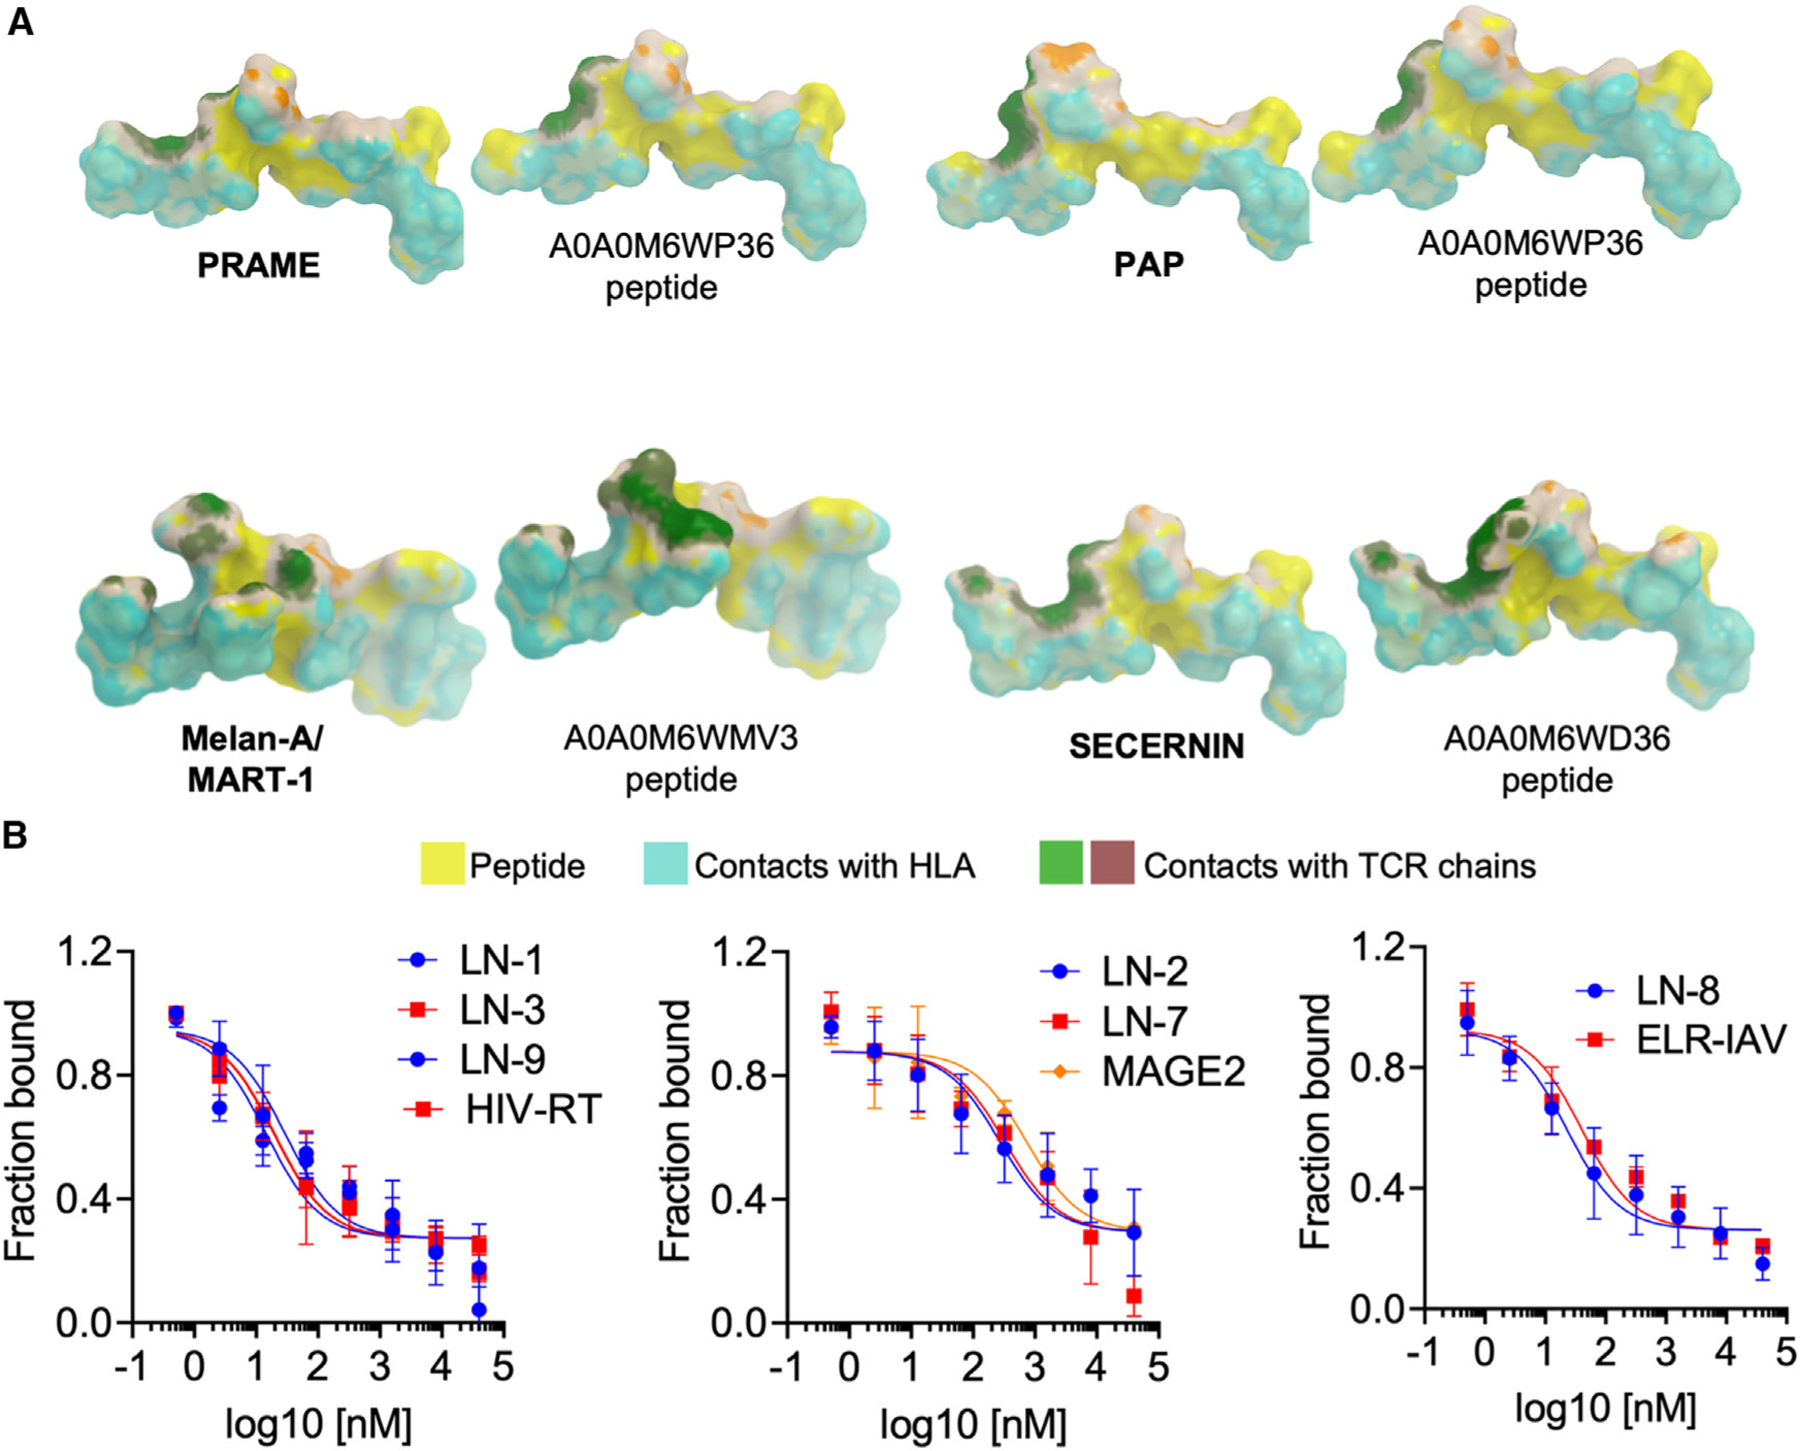
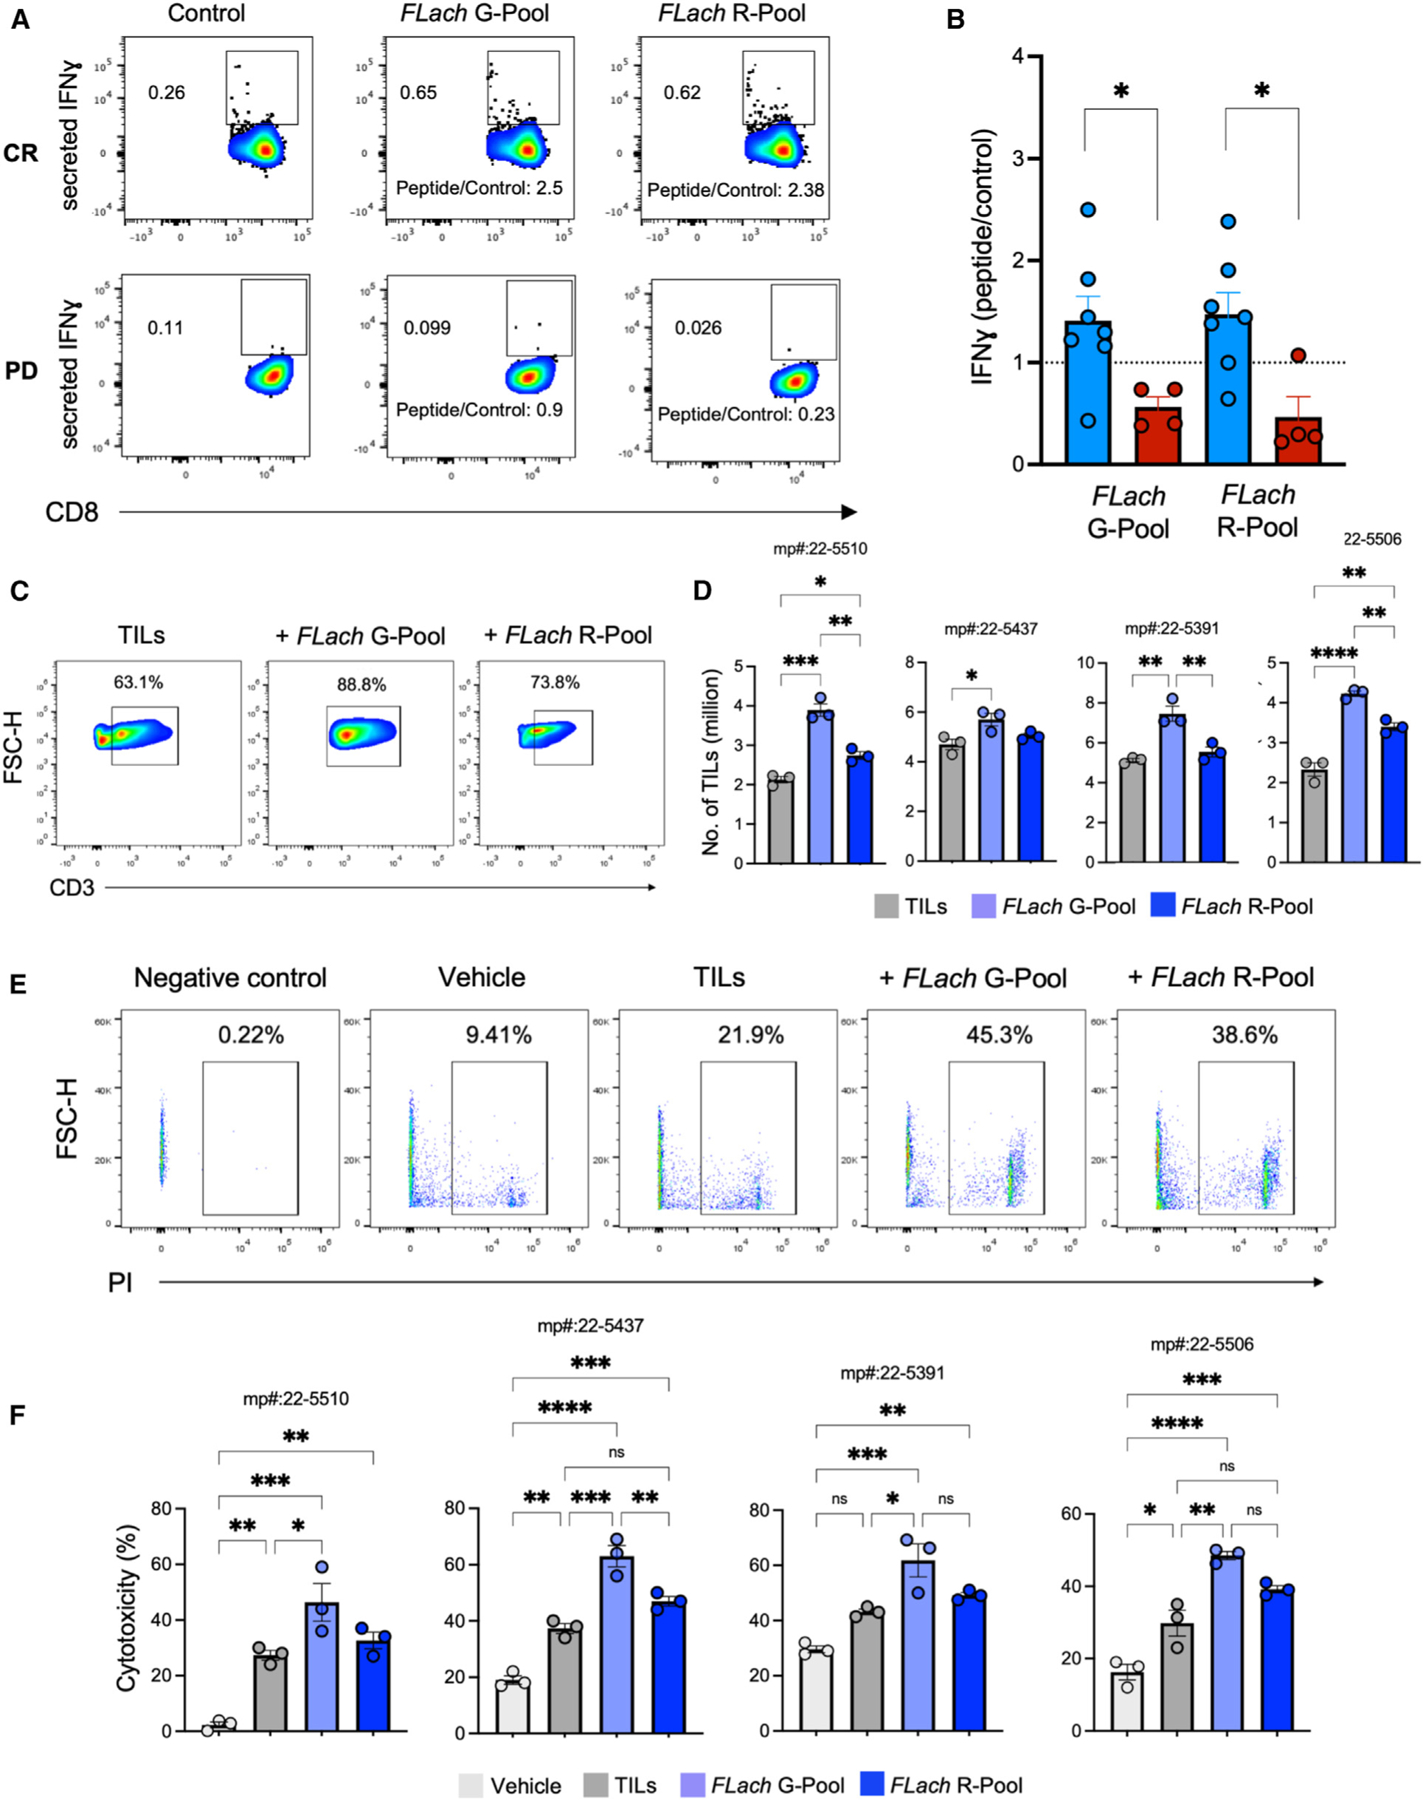
Immune checkpoint inhibitors (ICIs) improve outcomes in advanced melanoma, but many patients are refractory or experience relapse. The gut microbiota modulates antitumor responses. However, inconsistent baseline predictors point to heterogeneity in responses and inadequacy of cross-sectional data. We followed patients with unresectable melanoma from baseline and during anti-PD-1 therapy, collecting fecal and blood samples that were surveyed for changes in the gut microbiota and immune markers. Varying patient responses were linked to different gut microbiota dynamics during ICI treatment. We select complete responders by their stable microbiota functions and validate them using multiple external cohorts and experimentally. We identify major histocompatibility complex class I (MHC class I)-restricted peptides derived from flagellin-related genes of Lachnospiraceae (FLach) as structural homologs of tumor-associated antigens, detect FLach-reactive CD8+ T cells in complete responders before ICI therapy, and demonstrate that FLach peptides improve antitumor immunity. These findings highlight the prognostic value of microbial functions and therapeutic potential of tumor-mimicking microbial peptides.

Keywords: antigen mimicry; gut microbiome; immunotherapy; longitudinal; melanoma.


Conflict of interest statement

Declaration of interests L.N., T.M., P.A.A., and A.D.G.M. are named co-inventors on a patent application relating to this work (EP n. 24164184.4 “Flagellin-related peptides and uses”). M.C.A. reports advisory board participation, honoraria, or research funds to institutions from MSD Australia, BMS Australia, and Pierre Fabre Australia and is a named co-inventor on a patent application relating to Methods and compositions for treating cancer (WO2020106983A1), all unrelated to this work. P.A.A. reports grants or contracts from Bristol Myers Squibb, Roche-Genentech, Pfizer, and Sanofi; consulting fees from Bristol Myers Squibb, Roche-Genentech, Merck Sharp & Dohme, Novartis, Merck Serono, Pierre Fabre, Sun Pharma, Sanofi, Sandoz, Italfarmaco, Nektar, Pfizer, Lunaphore, Medicenna, Bio-Al Health, ValoTx, Replimmune, and Bayer; support for attending meetings and/or travel from Pfizer, Bio-Al Health, and Replimmune; and participating on a data safety monitoring board or advisory board for Bristol Myers Squibb, Roche-Genentech, Merck Sharp & Dohme, Novartis, AstraZeneca, Boehringer Ingelheim, Eisai, Regeneron, Daiichi Sankyo, Oncosec, Nouscom, Seagen, iTeos, and Erasca. L.N. reports research funds from BMS Europe unrelated to this work.

Figures

Figure 1.
Figure 1.. Longitudinally stable functions are enriched in the gut microbiome of patients with melanoma responsive to anti-PD-1 immunotherapy
(A) Overview of study design. See also Figure S1A and Table S1. (B) UpSet plot showing overlaps of prevalent taxa (present in >80% of samples) found in complete responder (CR) and non-CR (nCR) groups at 0, 2–6, and 7–13 months of therapy. Connected dots indicate prevalent taxa shared between time point groups (“stable”), whereas non-connected dots indicate prevalent taxa detected only in one time point group (“sporadic”). Plot is filtered to exclude taxa that have overlaps across CR and nCR (not group-specific). Stable CR is defined as prevalent taxa that are present across 0, 2–6, and 7–13 months, whereas stable nCR is defined as prevalent taxa that are present in at least two time point groups. See also Figures S1B–S1F. (C) Order-level composition of stable CR (top) and nCR taxa (bottom) and the corresponding stable taxa measure in CR and nCR (i.e., log-ratio of their sum-aggregated relative abundances (inset). Asterisks indicate significance by Wilcoxon rank sum test. See also Figures S2A–S2D. For further biological correlations of stable taxa, see Figures S3 and S4. (D) Baseline enrichment of stable CR and stable nCR taxa among R- and nR-prevalent taxa, respectively, across the indicated nine external melanoma cohorts. Dashed line indicates arbitrary cutoff for enrichment (Fisher’s exact test |OR|=2), line plots in blue indicate enrichment, line plots in gray indicate no enrichment, asterisks indicate significant enrichment at unadjusted p < 0.05 (Fisher’s exact test), and whiskers depict the interval for 95% confidence. (E) Treemap of over-represented pathways in CR at p-adj < 0.05, based on KOs associated with CR across all samples (|LM coefficient| > 1.5). Terms in white indicate stable pathways, defined as over-represented pathways appearing at 0, 2–6, and 7–13 months (p-adj < 0.05) within CR, whereas terms in gray indicate non-stable pathways. See also Figures S5A–S5C and Table S3. (F) Average gene family abundances (log10(CPM)) per patient of bacterial flagellin-related terms in CR and nCR, compared at 0, 2–6, and 7–13 months. Points outlined in blue indicate the top CR-associated flagellin genes by log2(fold-change). See also Figures S5D and S5E and Table S5. (G) Baseline enrichment of Lachnospiraceae-associated terms among R-associated flagellin gene families across nine melanoma cohorts, dashed lines indicate arbitrary cutoff for enrichment in R (Fisher’s exact test |OR|>1), line plots to the left indicate enrichment of non-specific bacterial flagellin terms subsampled to the same size, line plots in gray indicate no enrichment, whiskers depict the interval for 95% confidence, and asterisks indicate significant enrichment at p-adj<0.05 (Fisher’s exact test). See also Tables S4 and S5. Legend: with overlap (violet), spurious (yellow). CR (light blue), nCR (red). p-adj<0.001 (***), p-adj<0.01 (**), p-adj<0.05 (*), ns (unannotated).
Figure 2.
Figure 2.. Patients with melanoma responding differently to anti-PD-1 therapy have progressively different gut microbiome diversity
(A) Aitchison gut composition distance (PERMANOVA pseudo F-ratio) between PFS-L (PFS > 24 months) and PFS-S (PFS < 24 months) groups compared across time (0, 2–4, 5–8, and 9–13 months of therapy). Asterisk indicates PERMANOVA p-adj (distance~Response) at the given time point group. See also Table S1 and Figure S6A. (B) PCA plot of PFS-L and PFS-S Aitchison beta diversity using randomly sampled unique patient samples at each time point group during therapy (2–4, 5–8, and 9–13 months). Statistics are from multi-variate PERMANOVA (distance~Response+Patient+Time point). See also Figure S6B. For similar analyses on 16S data, see Figures S5C–S5G. For comparison against tumor-free, see Figures S7A–S7C and Table S2. (C–F) Aitchison gut composition difference between R and nR from Shotgun sequencing of (C) longitudinal melanoma-ICI study by Bjork et al., compared at visits 0, 1, 2, and 3, spanning 0 to 1–4 months of therapy, depending on patient. Cutoff of < 4 months of therapy was set for this analysis based on sample size distribution across time points of this study, and FMT melanoma-ICI studies by (D) Davar et al., 2021, (E) Baruch et al., and (F) Routy et al. and compared at different time points as indicated. Asterisk indicates PERMANOVA p-adj (distance~group) at the given time point group. Arrows indicate time point at which fecal microbiota transplant (FMT, yellow) and/or anti-PD1 immunotherapy (violet) commenced for that study. Differences among these studies are outlined in detail in Table S8. Legend: PFS-L (blue), PFS-S (red). p-adj<0.001 (***), p-adj<0.01 (**), p-adj<0.05 (*), ns (unannotated).
Figure 3.
Figure 3.. MHC class I-restricted peptides derived from flagellin-related Lachnospiraceae gene families show structural homology with human tumor-associated antigens
(A) Structural simulation of three candidate epitopes (right of pair) predicted from CR-associated flagellin gene families, determined to have sequence and structural homology to a tumor-associated antigen (TAA) (left of pair) and strong affinity to the same HLA allele as that of the TAA (<100 nM). See also Table S6. For immunohistochemistry results, also see Figure S8A. (B) Experimental binding affinities of the selected flagellin peptides toward A02:01 (left), B07:02 (center), and B08:01 (right), calculated by titrating different concentrations of the test peptide in the presence of 1 μM of protein and fixed concentration (25 nM) of probe peptide HIV-RT (left), MAGE2 (center), and ELR-IAV (right), respectively. See Table 3.
Figure 4.
Figure 4.. Complete response associates with a higher FLach-directed reactivity and antitumor immunity in melanoma patients
(A and B) (A) Representative flow cytometry contour plots and (B) MFI measurements of IFN-γ (normalized on untreated controls) on CD8+ T cells in peripheral blood monocytic cells (PBMCs) from patients with melanoma grouped by response to ICI (responsive = 7, non-responsive = 4). See also Figures S8B–S8E and Table S7. (C and D) (C) Representative flow cytometry contour plots and (D) number of TILs from four human melanoma tumors expanded with or without adding the indicated peptide pools. See also Figure S8F. (E and F) (E) Flow cytometry and (F) bar plots showing cytotoxicity (measured as % of PI-positive melanoma cells) of TILs expanded with or without adding the indicated peptide pools and tested on four matching melanoma patient-derived organoids.

References

    1. Luke JJ, Flaherty KT, Ribas A, and Long GV (2017). Targeted agents and immunotherapies: optimizing outcomes in melanoma. Nat. Rev. Clin. Oncol 14, 463–482. 10.1038/nrclinonc.2017.43. - DOI - PubMed
    1. Robert C, Long GV, Brady B, Dutriaux C, Maio M, Mortier L, Hassel JC, Rutkowski P, McNeil C, Kalinka-Warzocha E, et al. (2015). Nivolumab in previously untreated melanoma without BRAF mutation. N. Engl. J. Med 372, 320–330. 10.1056/NEJMoa1412082. - DOI - PubMed
    1. Gopalakrishnan V, Spencer CN, Nezi L, Reuben A, Andrews MC, Karpinets TV, Prieto PA, Vicente D, Hoffman K, Wei SC, et al. (2018). Gut microbiome modulates response to anti–PD-1 immunotherapy in melanoma patients. Science 359, 97–103. 10.1126/science.aan4236. - DOI - PMC - PubMed
    1. Matson V, Fessler J, Bao R, Chongsuwat T, Zha Y, Alegre ML, Luke JJ, Gajewski TF, and Gajewski TF (2018). The commensal microbiome is associated with anti–PD-1 efficacy in metastatic melanoma patients. Science 359, 104–108. 10.1126/science.aao3290. - DOI - PMC - PubMed
    1. Routy B, Le Chatelier E, Derosa L, Duong CPM, Alou MT, Daillère R, Fluckiger A, Messaoudene M, Rauber C, Roberti MP, et al. (2018). Gut microbiome influences efficacy of PD-1–based immunotherapy against epithelial tumors. Science 359, 91–97. 10.1126/science.aan3706. - DOI - PubMed

Substances