. 2024 Dec;11(47):e2400660.
doi: 10.1002/advs.202400660. Epub 2024 Nov 1.

TGFβ2-Driven Ferritin Degradation and Subsequent Ferroptosis Underlie Salivary Gland Dysfunction in Postmenopausal Conditions

Affiliations

TGFβ2-Driven Ferritin Degradation and Subsequent Ferroptosis Underlie Salivary Gland Dysfunction in Postmenopausal Conditions

Su-Jeong Oh et al. Adv Sci (Weinh). 2024 Dec.

Abstract

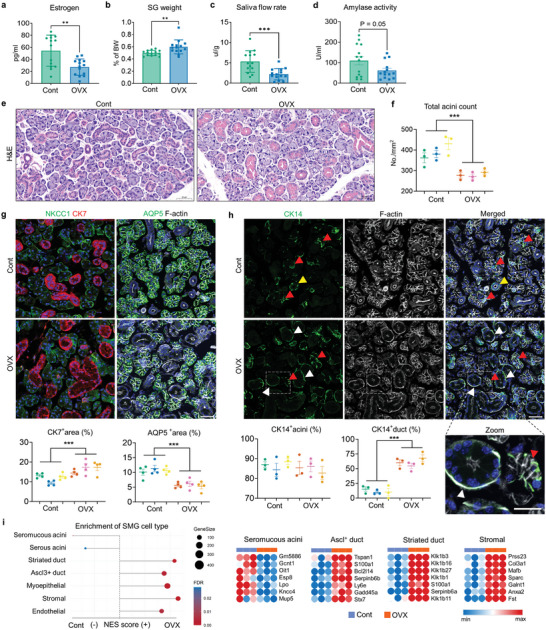
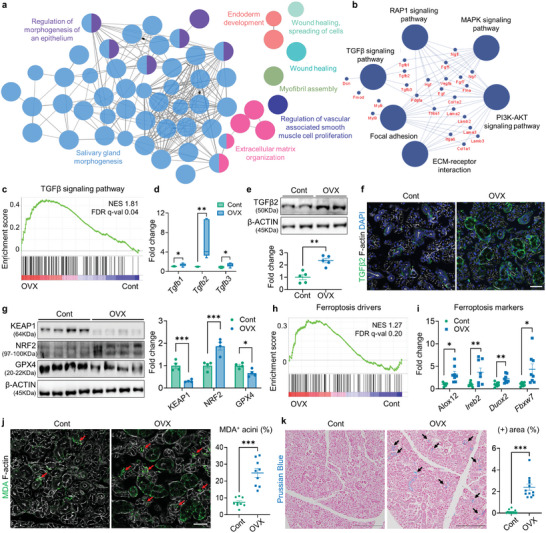
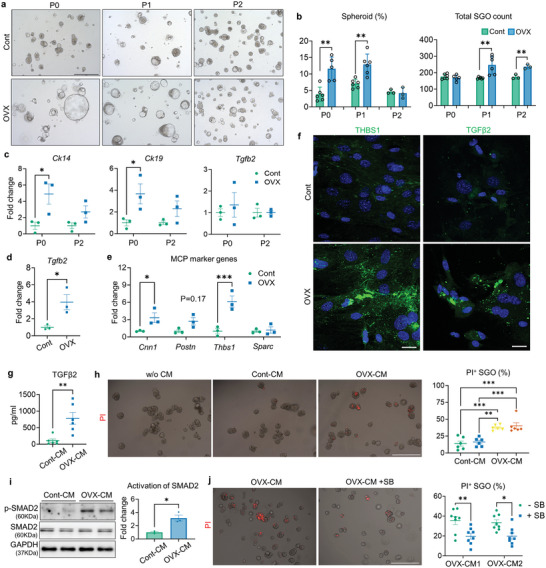
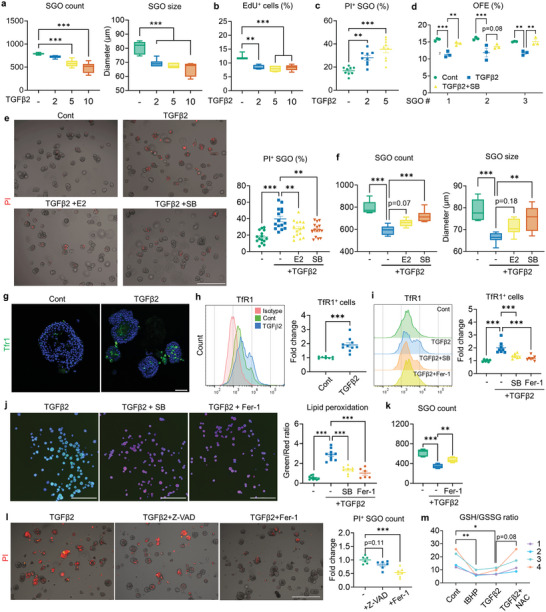
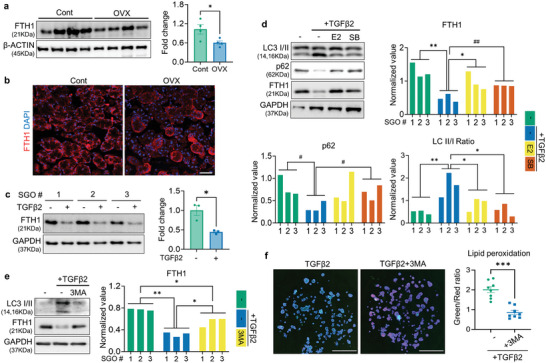
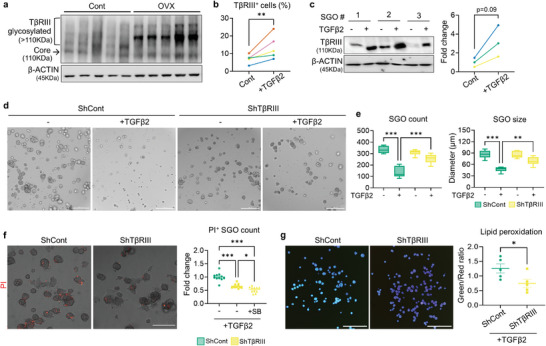
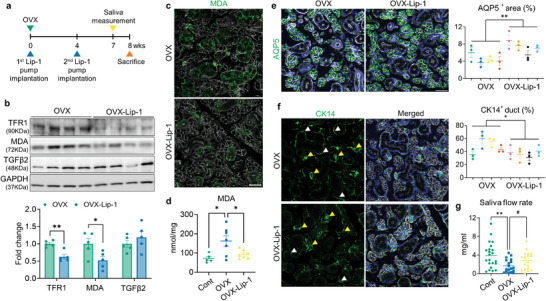
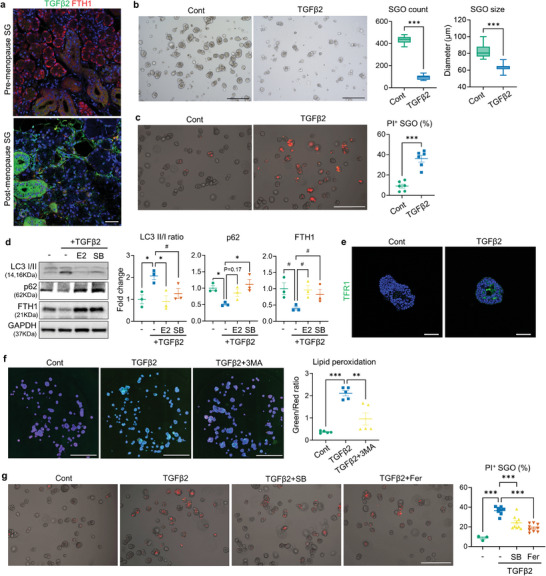
Despite the high incidence of dry mouth in postmenopausal women, its underlying mechanisms and therapeutic interventions remain underexplored. Using ovariectomized (OVX) mouse models, here this study identifies ferroptosis, an iron-dependent regulated cell death, as a central mechanism driving postmenopausal salivary gland (SG) dysfunction. In the OVX-SGs, TGFβ signaling pathway is enhanced with the aberrant TGFβ2 expression in SG mesenchymal cells. Intriguingly, TGFβ2 treatment reduces iron-storing ferritin levels, leading to lipid peroxidation and ferroptotic death in SG epithelial organoids (SGOs). Mechanistically, TGFβ2 promotes the autophagy-mediated ferritin degradation, so-called ferritinophagy. A notable overexpression of the type III TGFβ receptor (TβRIII) is found in the OVX-SGs and TGFβ2-treated SGOs, while the silencing of TβRIII mitigates the ferroptosis-mediated deleterious effects of TGFβ2 on SGOs. Finally, administration of ferroptosis inhibitor, Liproxstatin-1 (Lip-1), improves saliva secretion in OVX mice. Present findings collectively suggest a link between TGFβ signaling, ferroptosis, and SG injury, offering new therapeutic avenues for postmenopausal xerostomia.

Keywords: TGFβ2; estrogen; ferroptosis; organoids; salivary gland; xerostomia.


Conflict of interest statement

The authors declare no conflict of interest.

Figures

Figure 1
Figure 1
Comparison of SG structure between Cont‐ and OVX mice. Two months after OVX or sham surgery, a) serum estrogen levels, b) the ratio of SG weight to total body weight (BW), c) relative saliva secretion capacity and d) amylase activity in the secreted saliva were assessed in cont‐ and OVX mice (n = 14 for each group). e) Representative SG images of H&E staining and f) quantification results of total acini number. g) Immunofluorescence SG images showing acinar structure (NKCC1 and AQP5; green) and duct (CK7; red), with the area fraction occupied either by CK7 or AQP5 quantified. h) Immunofluorescence SG images showing the distribution of CK14+ (green) cells, with quantification results showing the proportion of CK14‐expressing acini and duct within the SG. Red arrowheads indicate CK14+ myoepithelial cells; yellow arrowheads and white arrowheads indicate CK14+ basal duct cells and ID cells, respectively. i) A dot plot depicting the gene set enrichment pattern for adult SMG cell types in the SG of Cont‐ and OVX mice and the Top 7 Gene set members on the rank‐ordered list. A total of three mice from each group were used for histological and microarray analysis. In g,h), F‐actin staining was performed to indicate the epithelial structure of the SG. Scale bar = 50 µm (e) and 40 µm (g, h). Data are shown as the mean ± SEM and compared by unpaired t‐test. **P < 0.01, ***P < 0.001.
Figure 2
Figure 2
Transcriptome profiling reveals enrichment of TGFβ signaling and ferroptosis pathways in OVX‐SG. a,b) Visualization of functionally grouped networks via ClueGO, showing enriched GO‐BP terms (a) and KEGG pathways (b) within the Top three upregulated modules of OVX‐SGs. Hub genes shared in KEGG pathways are indicated. c) GSEA of Cont‐ and OVX‐SGs using a TGFβ signaling pathway gene signature extracted from Wiki Pathway. d) Comparison of Tgfb1‐3 mRNA levels between Cont‐ and OVX‐SGs, conducted by qPCR. e) Analysis of TGFβ2 protein levels in Cont‐ and OVX‐SGs by Western blot (WB). f) Representative immunofluorescence images depicting TGFβ2 expression in the SG. g) Assessment of redox‐regulating protein levels in the SGs by WB. h) GSEA illustrating enrichment of ferroptosis drivers between Cont‐ and OVX‐SGs. i) Evaluation of relative mRNA expression levels of ferroptosis marker genes using qPCR. j) Detection and quantification of MDA+ acini (red arrows) relative to total acini in the SGs. k) Representative images of Prussian blue staining showing iron deposits (black arrows) within the SGs and quantification of the stained area. A total of three mice from each group were used for histological analysis. The number of biological replicates for WB and qPCR analysis corresponds to the number of dots on the graph. In (f) and (j), F‐actin staining was performed to indicate the epithelial structure of the SG. Scale bars = 40 µm (f, j) and 1 mm (k). Data are shown as the mean ± SEM and compared by unpaired t‐test. *P < 0.05, **P < 0.01, ***P < 0.001.
Figure 3
Figure 3
Characteristics of SGOs and SGMCs derived from Cont‐ and OVX mice. a) Representative images of SGOs derived from Cont‐ and OVX mice at day 7. b) Total count and proportion of spheroid‐shaped organoids assessed at day 7. c) qPCR results showing the mRNA expression levels of Ck14, Ck19 and Tgfb2 in cont‐ and OVX‐SGOs at P0 and P2. d,e) qPCR results comparing the mRNA expression of Tgfb2 (d) and MCP genes (e) between SGMCs isolated from Cont‐ and OVX mice. f) Immunofluorescence detection of THBS1 and TGFβ2 expression in SGMCs. g) ELISA‐based measurement of TGFβ2 levels released into the SGMC medium. h,i) SGOs were cultured with CMs from Cont‐ and OVX‐SGMCs (Cont‐CM and OVX‐CM) (n = 2 for each) for 48 h, then the impact of SGMC‐CMs on SGO viability (h) and Smad2 activation (p‐SMAD2/SMAD2 ratio) (i) were determined by PI staining and WB, respectively. j) SGOs were cultured with SGMC‐CM derived from OVX mice with or without SB treatment (10 µm) for 48 h, then their viability was assessed by quantification of PI+ SGOs. At least three lines of SGOs, SGMCs, and their CMs were used for all experiments, except for (h) and (j), where CMs were collected from two lines of SGMCs. Scale bar = 500 µm (a, h, i) and 40 µm (f). Data are shown as the mean ± SEM and compared by One‐way ANOVA with Dunnett`s multiple comparisons tests (h) or unpaired t‐test (rest of the analysis). *P < 0.05, **P < 0.01, ***P < 0.001.
Figure 4
Figure 4
TGFβ2 impairs the growth and viability of SGOs by inducing ferroptosis. a–c) TGFβ2 treatment, initiated on day 4 and analyzed at day 7, resulted in a dose‐dependent decrease in the total count and size of SGOs (a), reduced the EdU incorporation ratio (b), and increased the number of PI+ SGOs (c). d) SB (10 µm) counteracts the negative impact of TGFβ2 (5 ng mL−1) on the OFE of SGOs. e,f) Co‐treatment with E2 or SB mitigated the TGFβ2 impact on SGOs, reducing cell death (e) and increasing the total organoid count and size in TGFβ2‐treated SGOs (f). g,h) Expression patterns of TfR1 in Cont‐ and TGFβ2‐treated SGOs were determined by immunostaining (g) and flow cytometry (h). i,j) Baseline ferroptosis in SGOs was estimated by TFR1 detection via flow cytometry (i) and lipid peroxidation assay (j). Induction of ferroptosis in TGFβ2‐treated organoids was impeded by SB and Fer‐1 (1 nM). k) Recovery of TGFβ2‐mediated reduction in SGO count with Fer‐1 co‐treatment. l) Viability of TGFβ2‐treated SGOs exposed to either Z‐VAD (10 µm) or Fer‐1 assessed by PI staining. Quantification analysis highlights the dominance of ferroptosis over apoptosis in TGFβ2‐induced SGO damage. m) Reduced‐ and oxidized GSH levels in SGOs were evaluated after 24 h of TGFβ2 treatment. tBHP was used to induce oxidative stress, while antioxidant NAC was co‐treated with TGFβ2 to recover GSH depletion. At least three lines of SGOs were used for all experiments. For (g) and (i), Hoechst staining was conducted to visualize each organoid for analysis. Scale bars = 500 µm (e, l), 40 µm (g) and 1 mm (j). Data are shown as the mean ± SEM and compared by one‐way ANOVA with Dunnett`s multiple comparisons test. *P < 0.05, **P < 0.01, ***P < 0.001.
Figure 5
Figure 5
TGFβ2 induces ferritinophagy in SGOs. a,b) FTH1 expression in SG tissues of Cont‐ or OVX mice was analyzed by WB (a) and immunofluorescence (b). c,d) SGOs were treated with TGFβ2, SB, and E2 as indicated and analyzed by WB. TGFβ2 treatment led to a downregulation of FTH1 protein levels in SGOs (c), while co‐treatment with E2 or SB restored autophagic flux and FTH1 levels in TGFβ2‐exposed SGOs (d). e,f) 3MA (2.5 mm) was co‐treated with TGFβ2 to SGOs to intervene TGFβ2‐meidated ferritinophagy. The basal levels of autophagic flux and FTH1 protein (e) and lipid peroxidation in TGFβ2‐treated SGOs (f) were normalized by the autophagy inhibitor 3‐MA. At least 3 lines of SGOs were used for all experiments. Hoechst staining was conducted in (f) to visualize each organoid for the analysis. Scale bar = 40 µm (b) and 1 mm (f). Data are shown as the mean ± SEM and compared by unpaired t‐test (a, c, f) or one‐way ANOVA with Dunnett`s multiple comparisons tests (d, e). *P < 0.05, **P < 0.01, ***P < 0.001. For (d), # P < 0.05 and ## P < 0.01, where the statistical significance was determined by unpaired t‐test.
Figure 6
Figure 6
TβRIII is involved in a detrimental action of TGFβ2 on SGOs. a) Representative WB image detecting TβRIII in the SG of cont‐ and OVX mice (n = 5 for each). b,c) The impact of TGFβ2 on TβRIII expression in SGOs was investigated with flow cytometry (b) and WB (c). d–f) Representative images of shCont‐ and shTβRIII‐SGOs after TGFβ2 exposure (d) and their growth parameters (e) as well as viability assessment (f). g) Lipid peroxidation levels in shCont‐ and shTβRIII‐SGOs were evaluated after TGFβ2 treatment. TGFβ2 was administered on culture day 5 for 72 h (c‐e) or 24 h (f, g). At least three lines of SGOs were used for all experiments. Hoechst staining was conducted in (g) to visualize each organoid for the analysis. Scale bar = 300 µm (d, f) and 1 mm (g). Data are shown as the mean ± SEM and compared by unpaired t‐test (b, c, g) or one‐way ANOVA with Dunnett`s multiple comparisons tests (e, f). *P < 0.05, **P < 0.01, ***P < 0.001.
Figure 7
Figure 7
In vivo administration of ferroptosis inhibitor contributes to SG recovery in OVX mice. a) Experimental timeline schematic for the animal study. b) Immunoblot analysis showing the influence of Lip‐1 treatment on the regulation of ferroptosis, lipid peroxidation and TGFβ2 level in the OVX‐SGs. c,d) Representative images of MDA immunostaining (c) and quantification of MDA levels (d) within the SG tissues, demonstrating the beneficial impact of Lip‐1 treatment in reducing lipid peroxidation levels in OVX‐SGs. e) The quantity of acini in the SG was estimated by AQP5 immunostaining. f) SG images labeled with CK14 and assessment of the proportion of CK14+ ducts. CK14‐expressing acini and duct are indicated by yellow and white arrowheads, respectively. g) 7 weeks after OVX or sham surgery, the saliva secretory capacity of each group upon pilocarpine injection was measured. A total 4 mice for each group were used for histological analysis. The number of biological replicates for the WB analysis, MDA measurement and saliva measurement corresponds to the number of dots on the graph. In (c, e, f), F‐actin staining was performed to indicate the epithelial structure of the SG. Scale bar = 40 µm. Data are shown as the mean ± SEM and compared by unpaired t‐test (e, f) or one‐way ANOVA with Dunnett's multiple comparisons tests (d, g). *P < 0.05, **P < 0.01. For (g), # P < 0.05, where the statistical significance was determined by unpaired t‐test.
Figure 8
Figure 8
Validation of the detrimental impact of TGFβ2 on human SG epithelium using tissue samples and organoids (hSGOs). a) Representative immunofluorescence images showing TGFβ2 and FTH1 expression patterns in SG sections derived from pre‐ and postmenopausal women. b,c) TGFβ2 treatment was applied to hSGO cultures on day 4. Both the growth (b) and viability (c) of hSGOs were impaired by TGFβ2. d) Immunoblot analysis focusing on autophagy proteins and FTH1 was performed on hSGOs in the presence of indicated chemicals. e) Immunofluorescent images showing TFR1 expression in Cont‐ and TGFβ2‐treated hSGOs. f) 3MA treatment reduced the lipid peroxidation levels in TGFβ2‐treated hSGOs. g) Quantification of PI+ hSGOs indicating the protective effect of SB and Fer‐1 against TGFβ2‐mediated cell death. In (f), Hoechst staining was conducted to visualize each organoid for the analysis. Scale bar = 40 µm (a, e), 500 µm (b, c, g) and 1 mm (f). Data are shown as the mean ± SEM and compared by unpaired t‐test (b, c) or one‐way ANOVA with Dunnett`s multiple comparisons test (d, f, g). **P < 0.01, ***P < 0.001.

References

    1. Guggenheimer J., Moore P. A., J. Am. Dent. Assoc. 2003, 134, 61. - PubMed
    1. Jacob L. E., Krishnan M., Mathew A., Mathew A. L., Baby T. K., Krishnan A., J. Midlife Health 2022, 13, 100. - PMC - PubMed
    1. Soundarya B., Massillamani F., Kailasam S., Jayashree G., Narmadha N., Sornaa N., J. Mid‐Life Health 2022, 13, 157. - PMC - PubMed
    1. Wang L. N., Zhu L. L., Yao Y., Ren Y. J., Zhang H. C., Bmc Oral Health 2021, 21, 615. - PMC - PubMed
    1. Niklander S., Veas L., Barrera C., Fuentes F., Chiappini G., Marshall M., Braz. Oral. Res. 2017, 31, e14. - PubMed

LinkOut - more resources