. 2024 Dec;15(12):100330.
doi: 10.1016/j.advnut.2024.100330. Epub 2024 Oct 29.

Effects of Dietary Approaches and Exercise Interventions on Gestational Diabetes Mellitus: A Systematic Review and Bayesian Network Meta-analysis

Affiliations

Effects of Dietary Approaches and Exercise Interventions on Gestational Diabetes Mellitus: A Systematic Review and Bayesian Network Meta-analysis

Liang Zhang et al. Adv Nutr. 2024 Dec.

Abstract

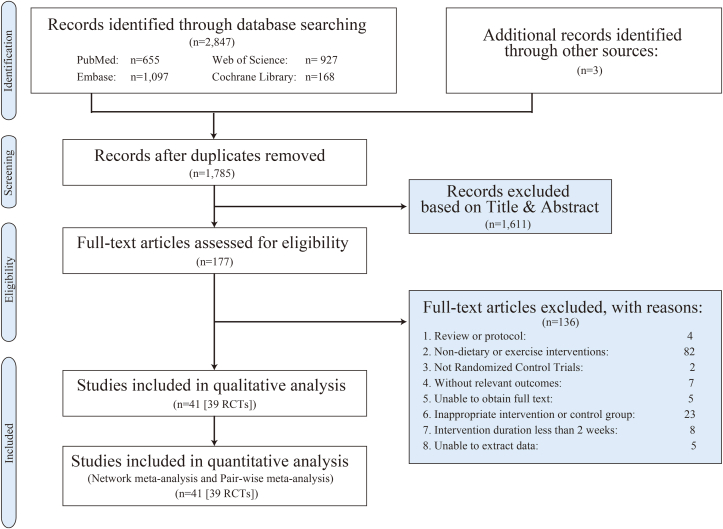
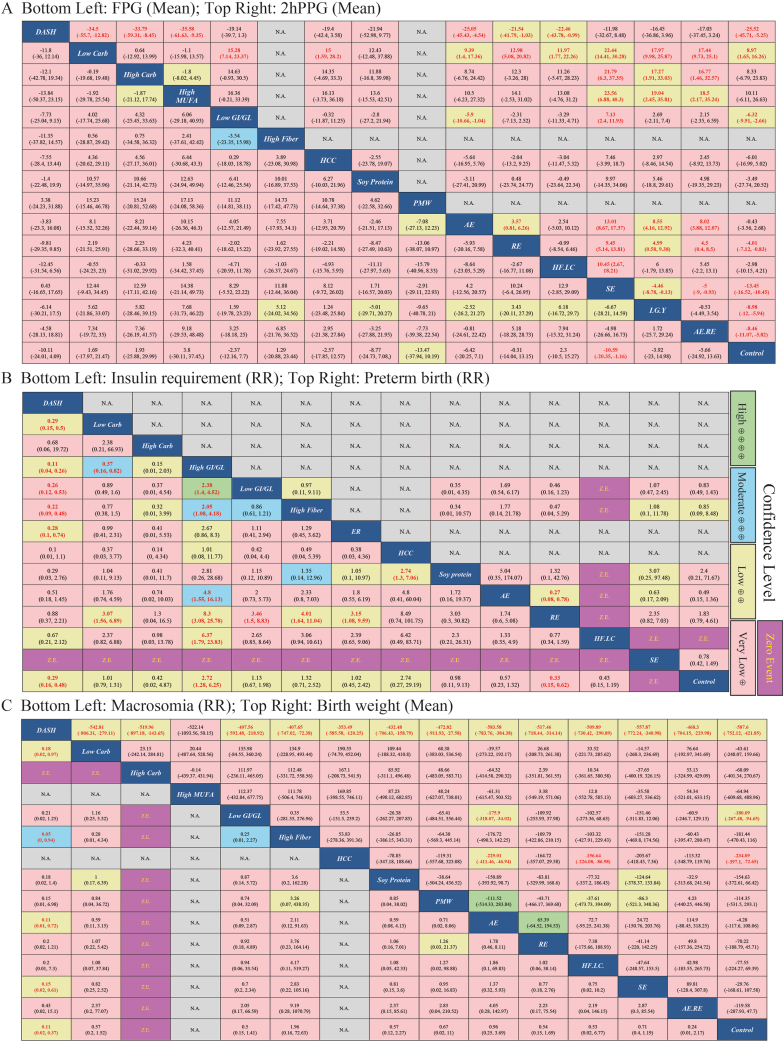
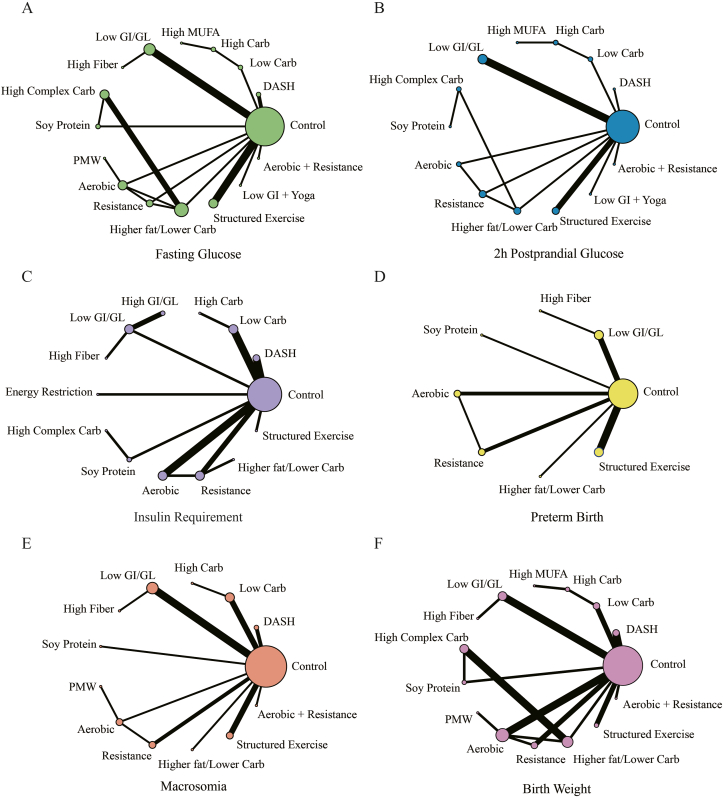
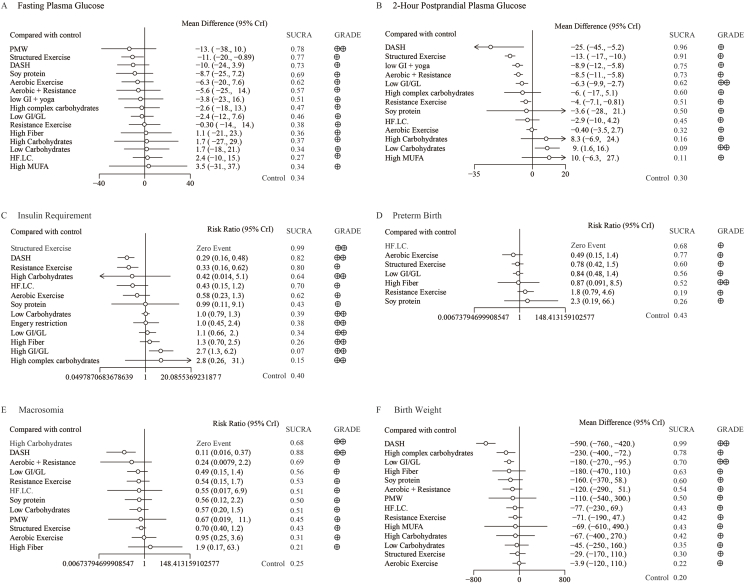
Although lifestyle interventions are recommended as the frontline therapeutic strategy for women with gestational diabetes mellitus (GDM), the optimal dietary regimen or form of exercise has yet to be definitively established. We aimed to compare the effectiveness of lifestyle therapies for GDM. Four databases (PubMed, Web of Science, EMBASE, and Cochrane Library) were systematically searched by multiple researchers for randomized controlled trials (RCTs). RCTs comparing lifestyle therapies to treat GDM with control or another treatment were included. Data extraction and synthesis were performed, estimating mean differences (MDs) or relative risk (RR) through pair-wise and network meta-analysis with a randomized or fixed-effects model when appropriate. The primary outcomes were maternal glucose control, birth weight of newborns, macrosomia and preterm birth rate, and rate of need for insulin therapy. In total, 39 trials with information obtained from 2712 women assessed 15 treatments. After sensitivity analysis, we confirmed the dietary approaches to stop hypertension (DASH) diet [MD: -11.52; 95% credible intervals (CrIs): -14.01, -9.07, very low certainty of evidence (CoE)] and low glycemic index (GI) diets (MD: -6.3; 95% CrI: -9.9, -2.7, low CoE) have shown significant advantages in fasting plasma glucose and 2-h postprandial glucose control, respectively. Furthermore, the DASH diet and resistance exercise reduced insulin requirements independently by 71% (95% CrI: 52%, 84%) and 67% (95% CrI: 48%, 85%), respectively. Additionally, both the DASH (MD: -587.6; 95% CrI: -752.12, -421.85, low CoE) and low GI diets (MD: -180.09, 95% CrI: -267.48, -94.65, low CoE) reduced birth weight significantly, with the DASH diet also demonstrating effects in reducing macrosomia by 89% (95% CrI: 53%, 98%) and lowering the cesarean section rate by 46% (95% CI: 27%, 60%). However, exercise did not affect infant outcomes. Our findings suggest that the DASH diet and low GI diet and resistance exercise may be beneficial for maternal outcomes in pregnancies with GDM. The impact on infants is primarily observed through dietary interventions. Future research, characterized by higher quality and evidence grades, is necessary to complement and substantiate our findings. This study was registered with PROSPERO as CRD 42024527587.

Keywords: dietary pattern; lifestyle modification; medical nutrition therapy; perinatal complications; physical activity.


Conflict of interest statement

Conflict of interest The authors report no conflicts of interest.

Figures

FIGURE 1
FIGURE 1
PRISMA flow diagram. During the literature selection process, we retrieved 2850 articles from 4 databases that aligned with our initial search strategy. After screening, we excluded 2809 articles that did not meet the inclusion criteria. Ultimately, 41 studies from 39 randomized controlled trials (RCTs) were included in our quantitative and qualitative analysis.
FIGURE 3
FIGURE 2
League table for maternal and infant outcomes. (A) The mean difference and 95% credible interval (CrI) for fasting plasma glucose (bottom left) and 2-h postprandial glucose (top right). (B) The relative risk (RR) and 95% CrI for insulin requirements (bottom left) and preterm birth (top right). (C) The RR and 95% CrI for macrosomia (bottom left), and the mean difference and 95% CrI for birth weight (top right). Different colors represent varying levels of certainty of evidence (CoE): green for high, blue for moderate, yellow for low, and pink for very low CoE. Purple indicates zero events, while gray denotes missing data. The red numbers represent statistical significance. All data are interpreted from left to right, and less is better for all measures. For mean, negative values indicate that the interference on the left is better than the interference on the right, while positive values indicate that the interference on the left is worse than the interference on the right. For RR, values <1 indicate that the interference on the left is better than the interference on the right, while values >1 indicate that the interference on the left is worse than the interference on the right. 2hPPG, 2-h postprandial glucose; AE, aerobic exercise; AE.RE, aerobic exercise+resistance exercise; Carb, carbohydrates DASH, dietary approaches to stop hypertension; ER, energy restriction; FPG, fasting plasma glucose; GI/GL, glycemic index/glycemic load; HCC, high complex carbohydrate; HF.LC, higher fat/lower carbohydrates; LG.Y, low GI+yoga; MUFA, monounsaturated fatty acid; N.A., no available data; PMW, postmeal walking; RE, resistance exercise; SE, structured exercise; Z.E., zero event.
FIGURE 3
FIGURE 3
Network plots for maternal and infant outcomes. (A) Network comparisons of different treatments regarding the outcome of fasting plasma glucose. Network plots for the outcome of 2-h postprandial glucose levels (B), for insulin requirements (C), and for the outcome of preterm birth (D). (E) Network plots depicting study comparisons for the outcome of macrosomia. (F) Comparisons between treatments in terms of birth weight. Network plots are composed of nodes and lines. The different nodes represent different studies, with the node size corresponding to the number of participants. The lines connecting the nodes indicate direct comparisons between studies, and the width of each line is proportional to the number of studies involved in that particular comparison. Aerobic, aerobic exercise; Carb, carbohydrates DASH, Dietary approaches to stop hypertension; GI/GL, glycemic index/glycemic load; MUFA, monounsaturated fatty acid; PMW, postmeal walking; Resistance, resistance exercise.
FIGURE 4
FIGURE 4
Forest plot comparison with the control group, SUCRA, and GRADE rating. The forest plots present network effect estimates of the direct and indirect evidence relative to the control group. (A) Fasting plasma glucose; (B) 2-h postprandial glucose; (C) insulin requirements; (D) preterm birth; (E) macrosomia; and (F) birth weight. The effect estimates are presented using means, relative risks, and 95% credible intervals. ⊕, very low certainty; ⊕⊕, low certainty. Aerobic, aerobic exercise; Carb, carbohydrates DASH, dietary approaches to stop hypertension; GI/GL, glycemic index/glycemic load; GRADE, Grading of Recommendations Assessment, Development and Evaluation; MUFA, monounsaturated fatty acid; PMW, postmeal walking; Resistance, resistance exercise; SUCRA, surface under the cumulative ranking curve.

Similar articles

Cited by

References

    1. Guariguata L., Linnenkamp U., Beagley J., Whiting D.R., Cho N.H. Global estimates of the prevalence of hyperglycaemia in pregnancy. Diabetes Res. Clin. Pract. 2014;103(2):176–185. - PubMed
    1. Ferrara A. Increasing prevalence of gestational diabetes mellitus: a public health perspective. Diabetes Care. 2007;30(Suppl 2):S141–S146. - PubMed
    1. Anna V., van der Ploeg H.P., Cheung N.W., Huxley R.R., Bauman A.E. Sociodemographic correlates of the increasing trend in prevalence of gestational diabetes mellitus in a large population of women between 1995 and 2005. Diabetes Care. 2008;31(12):2288–2293. - PMC - PubMed
    1. Gregory E.C., Ely D.M. Trends and characteristics in gestational diabetes: United States, 2016-2020. Natl. Vital. Stat. Rep. 2022;71(3):1–15. - PubMed
    1. Vounzoulaki E., Khunti K., Abner S.C., Tan B.K., Davies M.J., Gillies C.L. Progression to type 2 diabetes in women with a known history of gestational diabetes: systematic review and meta-analysis. BMJ. 2020;369:m1361. - PMC - PubMed

Publication types