. 2024 Dec;300(12):107950.
doi: 10.1016/j.jbc.2024.107950. Epub 2024 Oct 30.

Alpha-1 antitrypsin inhibits pertussis toxin

Affiliations

Alpha-1 antitrypsin inhibits pertussis toxin

Stefanie Lietz et al. J Biol Chem. 2024 Dec.

Abstract

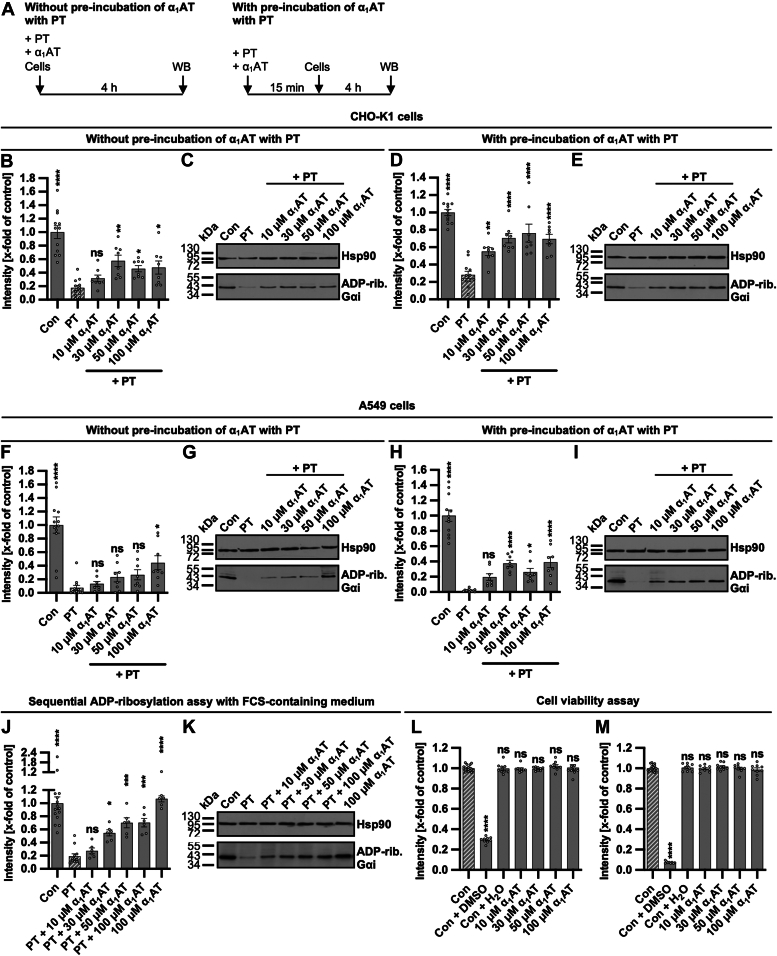
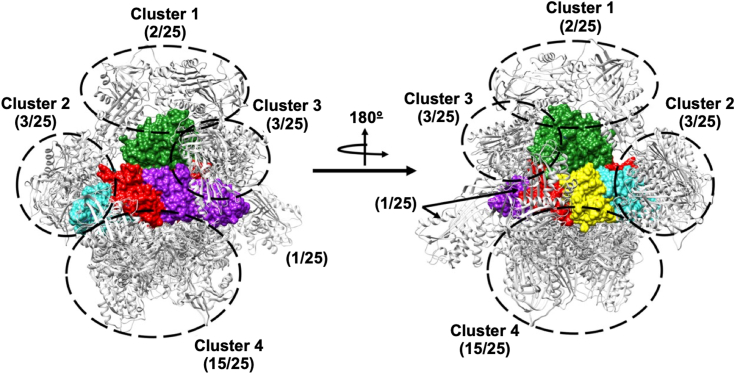
Pertussis (whooping cough) is a vaccine-preventable but re-emerging, highly infectious respiratory disease caused by Bordetella pertussis. There are currently no effective treatments for pertussis, complicating care for nonvaccinated individuals, especially newborns. Disease manifestations are predominantly caused by pertussis toxin (PT), a pivotal virulence factor classified as an ADP-ribosylating AB-type protein toxin. In this work, an unbiased approach using peptide libraries, bioassay-guided fractionation and mass spectrometry revealed α1-antitrypsin (α1AT) as a potent PT inhibitor. Biochemistry-, cell culture-, and molecular modeling-based in vitro experimentation demonstrated that the α1AT mode of action is based on blocking PT-binding to the host target cell surface. In the infant mouse model of severe pertussis, α1AT expression was reduced upon infection. Further, systemic administration of α1AT significantly reduced B. pertussis-induced leukocytosis, which is a hallmark of infant infection and major risk factor for fatal pertussis. Taken together our data demonstrates that α1AT is a novel PT inhibitor and that further evaluation and development of α1AT as a therapeutic agent for pertussis is warranted. Importantly, purified α1AT is already in use clinically as an intravenous augmentation therapy for those with genetic α1AT deficiency and could be repurposed to clinical management of pertussis.

Keywords: Bordetella pertussis; G-protein; bacterial toxin; host defense; infectious disease; inhibitor; pertussis; pertussis toxin; toxin inhibitor; whooping cough; α(1)-antitrypsin.


Conflict of interest statement

Conflicts of interest The authors declare that they have no conflicts of interest with the contents of this article.

Figures

Figure 1
Figure 1
Alpha-1-antitrypsin (α1AT) was identified from hemofiltrate library as PT inhibitor.AC, PT (10 ng/ml = 0.0000962 μM) and 20 μl of a fraction of the hemofiltrate library or the respective amount of solvent (H2O) were added directly to CHO-K1 cells in FCS-free medium and incubated for 4 h at 37 °C. Cells were left untreated as further control. Then, the cells were lysed and Gαi which has not been ADP-ribosylated during the intoxication with PT was ADP-ribosylated and biotin-labeled via the incubation with PTS1 and biotin-labeled NAD+. Subsequently, the biotin-labeled Gαi was detected via Western Blot, while Hsp90 served as control for equal protein loading. The bar graph (A) shows the quantifications of Western Blot signals from one experiment testing the samples as single values or duplicates depending on sample availability, while (B, C) show the corresponding Western blot images. The intensity values of the bar graph are given as x-fold of the untreated control (Con), normalized to Hsp90, mean ± SD (n ≥ 1). D, PT (10 ng/ml) and 20 μl of the respective chromatographic subfractions or the respective amount of solvent (H2O) were added directly to CHO-K1 cells in FCS-free medium and incubated for 4 h at 37 °C. Cells were left untreated as further control. Subsequently, the experiment was performed as described in (A). The intensity values of the bar graph are given as x-fold of the untreated control (Con), normalized to Hsp90 staining, mean ± SD (at least n = 1 at most n = 2 from two independent experiments). (Blue line: chromatogram from the chromatographic fractionation process, gray bars = screening result, green bars: screening results that were considered as hits and or subjected to further chromatographic fractionation). E, sample carbamidomethylation, followed by proteolytic digestion, and mass spectrometry analysis revealed the presence of α1AT. The sequence coverage compared to the mature polypeptide was 93.5% with a α1AT precursor amino acid sequence range of 25 to 418. F, α1AT (Uniprot: P01009-A1AT_HUMAN) was the main component of the active chromatographic subfractions 34_55_56 to 58. Abbreviations are used to identify all chromatographic fractions. From left to right, the number of the active chromatographic fraction used for each next fractionation step is given in chronological order. Therefore, 34_55_56 to 58 is referred to as the chromatographic fractions 56 to 58 derived from fraction 34_55, obtained from fraction 34. Subfractions 34_55_56 to 58 are 56, 57, and 58, obtained from 34_55 (Fig. 1C, right side), which showed the highest activity and were subjected together to sequencing. We used this nomenclature to abbreviate the names. The same applies to the other names, for example, 35_48 to 49 indicates fractions 48 and 49 from the fractionation of 35. FCS, fetal calf serum; Gαi, α-subunit of inhibitory G protein.
Figure 2
Figure 2
Effect of α1AT on ADP-ribosylation status of Gαi in PT-treated CHO-K1 and A549 cells.A, schematic representation of experimental setup for the sequential ADP-ribosylation assay. PT and α1AT were either directly added to cells for 4 h or preincubated for 15 min before addition to cells. BC, PT (10 ng/ml) and different concentrations of α1AT or the respective amount of solvent (H2O) were added directly to CHO-K1 cells in FCS-free medium and incubated for 4 h at 37 °C. Cells were left untreated as further control. After the incubation, the cells were lysed and Gαi, which had not been ADP-ribosylated during the intoxication with PT, was ADP-ribosylated and biotin-labeled via the incubation with PTS1 and biotin-labeled NAD+. Subsequently, the biotin-labeled Gαi was detected via Western blot, while Hsp90 served as a control for equal protein loading. The bar graph (B) shows the quantification of Western blot signals from four independent experiments, while (C) shows results of a representative experiment. The intensity values of the bar graph are given as x-fold of the untreated control (Con), normalized to Hsp90, mean ± SEM (n = 8 values from four independent experiments). D and E, PT (10 ng/ml) and different concentrations of α1AT or the respective amount of solvent (H2O) were preincubated for 15 min at room temperature and added to CHO-K1 cells in FCS-free medium for 4 h at 37 °C. Cells were left untreated as further control. Subsequently, the experiment was performed as described in (B and C). Values are given as mean ± SEM (n = 8 values from four independent experiments). F and G, PT (50 ng/ml = 0.000476 μM) and different concentrations of α1AT or the respective amount of solvent (H2O) were added directly to A549 cells in FCS-free medium and incubated for 4 h at 37 °C. Cells were left untreated as further control. Subsequently, the experiment was performed as described in (B and C). Values are given as mean ± SEM (n = 8 values from four independent experiments). H and I, PT (50 ng/ml) and different concentrations of α1AT or the respective amount of solvent (H2O) were preincubated for 15 min at room temperature and added to A549 cells in FCS-free medium for 4 h at 37 °C. Cells were left untreated as further control. Subsequently, the experiment was performed as described in (B and C). Values are given as mean ± SEM (n = 8 values from four independent experiments). J and K, PT (10 ng/ml) and different concentrations of α1AT or the respective amount of solvent (H2O) were added directly to CHO-K1 cells in FCS-containing medium and incubated for 4 h at 37 °C. Cells were left untreated as further control. Subsequently, the experiment was performed as described in (B and C). Values are given as mean ± SEM (n = 6 values from three independent experiments). L and M, different concentrations of α1AT or the respective amount of solvent (H2O) were added directly to CHO-K1 cells in FCS-free medium and incubated for 4 h (L) or 24 h (M) at 37 °C. As a positive control for cell death, 20% DMSO was added. After the incubation, the MTS reagent was added to the cells and incubated for 45 min at 37 °C. The absorbance was measured using a plate reader at 490 nm. The intensity values of the bar graph are given as x-fold of the untreated control (Con), mean ± SEM (n = 9 values from three independent experiments). (B, D, F, H, J, L, and M) significance was tested using one-way ANOVA followed by Dunnett’s multiple comparison test and refers to samples treated with PT only (B, D, F, H, and J) or untreated control (Con) (L and M) (∗p < 0.1, ∗∗p < 0.01, ∗∗∗p < 0.001, ∗∗∗∗p < 0.0001, ns not significant). α1AT, α1-antitrypsin; DMSO, dimethylsulfoxide; FCS, fetal calf serum; Gαi, α-subunit of inhibitory G protein; MTS, 3-(4,5-dimethylthiazol-2-yl)-5-(3-carboxymethoxyphenyl)-2-(4-sulfophenyl)-2H-tetrazolium; PT, pertussis toxin; WB, Western blot.
Figure 3
Figure 3
Effect of the serpin proteins α1AT and antithrombin on intoxication of CHO-K1 cells with PT.AC, PT (10 ng/ml) and α1AT (100 μM), antithrombin (AT) (100 μM), and fondaparinux (Fon) (1 g/l) or the respective amount of solvent (H2O) were added directly to CHO-K1 cells in FCS-free medium and incubated for 4 h at 37 °C. Cells were left untreated as further control (Con) or incubated with AT and Fon only. After the incubation, the cells were lysed and Gαi which has not been ADP-ribosylated during the intoxication with PT was ADP-ribosylated and biotin-labeled via the incubation with PTS1 and biotin-labeled NAD+. Subsequently, the biotin-labeled Gαi was detected via Western Blot, while Hsp90 or Ponceau-S staining served as control for equal protein loading. The bar graphs (A and B) show the quantifications of Western blot signals from six independent experiments, while (C) shows blots of a representative experiment. The intensity values of the bar graph are given as x-fold of the untreated control (Con), normalized to Hsp90 or Ponceau-S staining, mean ± SEM (at least n = 7 values from six independent experiments). A and B, significance was tested using one-way ANOVA followed by Dunnett’s multiple comparison test and refers to controls treated with PT only (A) or untreated controls (Con) (B) (∗p < 0.1, ∗∗p < 0.01, ∗∗∗p < 0.001, ∗∗∗∗p < 0.0001, ns not significant). α1AT, α1-antitrypsin; Gαi, α-subunit of inhibitory G protein; PT, pertussis toxin.
Figure 4
Figure 4
Effect of α1AT on enzyme activity of PTS1 in vitro.A, schematic representation of experimental setup for the enzyme activity assay. PTS1 and α1AT were either directly added to CHO-K1 cell lysate with biotin-NAD+ and incubated for 40 min or preincubated for 15 min before addition to cell lysate and biotin-NAD+. BD, PTS1 (84 nM) and different concentrations of α1AT or the respective amount of solvent (H2O) (Con) were added directly to CHO-K1 cell lysate and biotin-NAD+ and incubated for 40 min at room temperature. Cell lysate was left untreated with biotin-NAD+ as further control (lysate). Gαi, which was ADP-ribosylated and biotin-labeled via the incubation with PTS1 and biotin-labeled NAD+, was detected via Western blot, while Hsp90 or Ponceau-S staining served as control for equal protein loading. The bar graph (B) shows the quantifications of Western blot signals from six independent experiments, while (C and D) show blots of representative experiments. The intensity values of the bar graph are given as x-fold of the control (Con), normalized to Hsp90 or Ponceau-S staining, mean ± SEM (at least n = 6 values from six independent experiments). EG, PTS1 (84 nM) and different concentrations of α1AT or the respective amount of solvent (H2O) (Con) were preincubated for 15 min at room temperature before addition to CHO-K1 cell lysate and biotin-NAD+. Cell lysate was left untreated with biotin-NAD+ as further control (lysate). Subsequently, the experiment was performed as described in (BD). The bar graph (E) shows the quantifications of Western blot signals from seven independent experiments, while (F and G) show blots of representative experiments. The intensity values of the bar graph are given as x-fold of the control (Con), normalized to Hsp90 or Ponceau-S staining, mean ± SEM (at least n = 6 values from seven independent experiments). B and E, significance was tested using one-way ANOVA followed by Dunnett’s multiple comparison test and refers to controls treated with PT only (∗p < 0.1, ∗∗p < 0.01, ∗∗∗p < 0.001, ∗∗∗∗p < 0.0001, ns not significant). α1AT, α1-antitrypsin; Gαi, α-subunit of inhibitory G protein; PT, pertussis toxin; WB, Western Blot.
Figure 5
Figure 5
Effect of α1AT on binding of labeled PT to CHO-K1 and A549 cells.A, schematic representation of experimental setup for the flow cytometry (FC) based binding assay. The 488-labeled PT and α1AT were either directly added to cells for 15 min or preincubated for 15 min before addition to cells. BD, 488-labeled PT (500 ng/ml = 0.00476 μM) and different concentrations of α1AT or the respective amount of solvent (H2O) were added directly to CHO-K1 cells and incubated for 15 min at 4 °C to enable binding of PT to cells but prevent internalization. Cells were left untreated as control (Con). After that, cells were washed by centrifugation and 488-labeled PT bound to cell surfaces was measured using flow cytometry. Values of median are given as x-fold of the untreated control (Con), mean ± SEM (n = 9 values from three independent experiments). Histograms show fluorescence intensity of cells for one representative experiment for higher (C) and lower (D) concentrations (n = 3). EG, The 488-labeled PT (500 ng/ml) and different concentrations of α1AT or the respective amount of solvent (H2O) were preincubated for 15 min at room temperature before addition to CHO-K1 cells. Cells were left untreated as control, and the experiment was performed as described in (BD). Values of median are given as x-fold of the untreated control (con), mean ± SEM (n = 9 values from three independent experiments). Histograms show fluorescence intensity of cells for one representative experiment for higher (F) and lower (G) concentrations (n = 3). HI, binding IC50 values were calculated from median fluorescence intensities for experiments without (I, H) and with (E, I) the preincubation of 488-labeled PT and different concentrations α1AT. A nonlinear regression model with variable slope (GraphPad Prism, log(inhibitor) versus response (variable slope, four parameters)) was fitted to values, and binding IC50 values were given based on the fit. j, 488-labeled PT (1000 ng/ml = 0.00962 μM) and different concentrations of α1AT or the respective amount of solvent (H2O) were added directly to A549 cells. Cells were left untreated as control (Con) and the experiment was performed as described in (b-d). Values of median are given as x-fold of the untreated control (Con), mean ± SEM (n = 9 values from three independent experiments). B, E, and J, significance was tested using one-way ANOVA followed by Dunnett’s multiple comparison test and refers to samples treated with PT only (B, E, and J) (∗p < 0.1, ∗∗p < 0.01, ∗∗∗p < 0.001, ∗∗∗∗p < 0.0001, ns not significant). α1AT, α1-antitrypsin; PT, pertussis toxin.
Figure 6
Figure 6
Effect of α1AT on binding of PT in CHO-K1 cells.A, PT (1 μg/ml = 0.00952 μM) and different concentrations of α1AT or the respective amount of solvent (H2O) were added directly to CHO-K1 cells and incubated for 40 min at 4 °C to enable PT binding but not internalization. Cells were left untreated as control. Subsequently, the cells were washed, fixed, permeabilized, and quenching was performed. Blocking was performed and the cells were incubated with primary antibodies for PTS1 (green) and α1AT (red). Primary antibodies were detected via fluorescently labeled secondary antibodies and nuclei were stained using Hoechst (blue). Representative images are shown from three independent experiments (n = 3), (B) whereas the PTS1 signal is given in the bar graph as x-fold of the PT-treated control (PT), normalized to the Hoechst signal, mean ± SEM (n = 44–45 values from three independent experiments). Significance was tested using one-way ANOVA followed by Dunnett’s multiple comparison test and refers to samples treated with PT only (∗p < 0.1, ∗∗p < 0.01, ∗∗∗p < 0.001, ∗∗∗∗p < 0.0001, ns not significant). α1AT, α1-antitrypsin; PT, pertussis toxin.
Figure 7
Figure 7
Effect of α1AT on detectable PTS1 signal in CHO-K1 and A549 cells.AB, PT (100 ng/ml = 0.000952 μM) and different concentrations of α1AT or the respective amount of solvent (H2O) were added directly to CHO-K1 cells and incubated for 4 h at 37 °C. Cells were left untreated as control (Con). Subsequently, the cells were washed, fixed, permeabilized, and quenching was performed. After blocking, cells were incubated with primary antibodies against PTS1 (green) and α1AT (red). Primary antibodies were detected via fluorescently labeled secondary antibodies, and nuclei were stained using Hoechst (blue). Representative images are shown from three independent experiments (n = 3), B, PTS1 signal is given in the bar graph as x-fold of the PT-treated control (PT), normalized to the Hoechst signal, mean ± SEM (n = 45 values from three independent experiments). C, PT (100 ng/ml) and α1AT or the respective amount of solvent (H2O) were added directly to A549 cells and incubated for 4 h at 37 °C. Subsequently, the experiment was performed as described in (A). Representative images are shown from three independent experiments (n = 3), D, PTS1 signal is given in the bar graph as x-fold of the PT-treated control (PT), normalized to the Hoechst signal, mean ± SEM (n = 43–45 values from three independent experiments). B and D, significance was tested using one-way ANOVA followed by Dunnett’s multiple comparison test and refers to samples treated with PT only (∗p < 0.1, ∗∗p < 0.01, ∗∗∗p < 0.001, ∗∗∗∗p < 0.0001, ns not significant). α1AT, α1-antitrypsin; PT, pertussis toxin.
Figure 8
Figure 8
Effect of different preincubation schemes of α1AT on PT-intoxication and binding of PT to cells.AB, for the competition study based on the sequential ADP-ribosylation of Gαi six different treatment options using PT (10 ng/ml) and α1AT (100 μM) or the respective amount of solvent (H2O) were performed in parallel. First and second, α1AT or solvent control were preincubated on CHO-K1 cells for 15 min at 37 °C and were either present in the medium during intoxication with PT or washed away prior to PT-intoxication. Third and fourth, PT was preincubated on cells for 15 min at 37 °C and was either present in the medium while α1AT or solvent control were added or washed away before adding α1AT or water. Fifth, α1AT, water (solvent control), and PT were preincubated for 15 min at room temperature before addition to CHO-K1 cells. Sixth, α1AT, solvent control, and PT were added directly to CHO-K1 cells. Cells were left untreated as further control (Con). The wash steps were performed using FCS-free medium. After the CHO-K1 cells were treated, the cells were incubated for further 4 h at 37 °C. Then, the cells were lysed and Gαi which has not been ADP-ribosylated during the intoxication with PT was ADP-ribosylated and biotin-labeled via the incubation with PTS1 and biotin-labeled NAD+. Subsequently, the biotin labeled Gαi was detected via Western Blot, while Hsp90 served as control for equal protein loading. The bar graph (A) shows the quantification of Western blot signals from three independent experiments, while (B) shows blots of a representative experiment. The intensity values of the bar graph are given as x-fold of the untreated control (Con), normalized to Hsp90, mean ± SEM (n = 3 values from three independent experiments). C, The 488-labeled PT (500 ng/ml) was preincubated for 15 min at 4 °C on CHO-K1 cells to enable binding of PT to cells but no internalization. Subsequently, cells were washed by centrifugation, and different concentrations of α1AT or the respective amount of solvent (H2O) were added to the cells and incubated for further 15 min at 4 °C. Cells were left untreated as control (Con). After that, cells were washed by centrifugation and 488-labeled PT bound to cell surfaces was measured using flow cytometry. Values of median are given as x-fold of the untreated control (Con), mean ± SEM (n = 9 values from three independent experiments). A and C, significance was tested using one-way ANOVA followed by Šídák’s multiple comparison test (A) or Dunnett’s multiple comparison test (C) and refers to samples treated with PT only (A, C) (∗p < 0.1, ∗∗p < 0.01, ∗∗∗p < 0.001, ∗∗∗∗p < 0.0001, ns not significant). α1AT, α1-antitrypsin; FCS, fetal calf serum; Gαi, α-subunit of inhibitory G protein; PT, pertussis toxin.
Figure 9
Figure 9
Docking analysis. Clusters obtained from the docking procedure with the servers GRAMM-X, HawDock, and AlphaFold3. α1AT is represented in gray carton and pertussis toxin in colored surfaces, S1, green; S2, turquoise; S3, purple; S4, red; S5, yellow. α1AT, α1-antitrypsin.
Figure 10
Figure 10
Molecular dynamics simulations for most stable α1AT-PT complexes obtained from docking.A, root mean square deviation analysis in the function of time. B, buried surface area of α1AT with PT in the function of time. C, Gibbs energy calculations. α1AT, α1-antitrypsin; PT, pertussis toxin.
Figure 11
Figure 11
Energy decomposition of the interaction per residue in the last 10 ns of simulations. van der Waals contacts, hydrophobic interactions, hydrogen bonds, and salt bridges are in yellow, red, blue, and green colors, respectively. Colored squares represent contact points between α1AT and PT. The stronger the color, the longer the residues interacted. Enclosed in squares are those residues interacting at least 50% (5 ns) of the time of the simulations. α1AT, α1-antitrypsin; PT, pertussis toxin.
Figure 12
Figure 12
Interaction of α1AT with PT and PTS1 in vitro.A, decreasing concentrations of PTS1 (antibody control), Gαi, and α1AT were vacuum aspirated onto a nitrocellulose membrane using the Dot blot system. PBS was aspirated as a control. Subsequently, the membrane was stained with Ponceau-S (right), blocked, and cut for incubation with the overlay samples, PT (200 ng/ml = 0.001904 μM), PTS1 (200 ng/ml = 0.0007616 μM), and PBS-T as control. The amount of spotted PTS1 is below the detection limit of Ponceau-S staining. Bound PTS1 was detected using an antibody against PTS1 (left). A representative blot is shown of at least three independent experiments (n = 3). α1AT, α1-antitrypsin; Gαi, α-subunit of inhibitory G protein; PT, pertussis toxin.
Figure 13
Figure 13
α1AT levels correlate with B. pertussis infection and leukocytosis.A, SerpinA1a-e, the murine α1AT genes, were quantified in RNA isolated from the lungs of infant mice at 8 days post inoculation by qRT-PCR. Data represent fold changes in serpinA1a-e expression relative to control PBS-inoculated mice and normalized to a housekeeping gene. Bars graphs depict a representative group of n ≥ 4 mice for experiments performed two times. Values are given as mean ± SD. B and C, mice were aerosolized with a bacterial inoculum at absorbance 1.0 (6 × 10ˆ9 CFU/ml confirmed) and treated with 50 mg/kg α1AT from human plasma at a concentration of 10 mg/ml via intraperitoneal injection every second day from day 0 (immediately after infection). Harvest was done at 8 days post infection. B, white blood cell count was determined in peripheral blood. Values are given as mean ± SEM. c, colony forming units (CFU) in the lung and spleen were determined. Values are given as mean ± SEM. d, lung histopathology was evaluated from hematoxylin and eosin stained sections. A, B, and C, significance was tested using (A, C) unpaired t test or (B) one-way ANOVA followed by Dunnett’s multiple comparison test and refers to B. pertussis infected mice treated with vehicle (∗p < 0.1, ∗∗p < 0.01, ∗∗∗p < 0.001, ∗∗∗∗p < 0.0001, ns not significant). The p-value for unpaired t test is reported as indicated, when lower than 0.05. α1AT, α1-antitrypsin; qRT-PCR, quantitative reverse transcription PCR.

References

    1. Yeung K.H.T., Duclos P., Nelson E.A.S., Hutubessy R.C.W. An update of the global burden of pertussis in children younger than 5 years: a modelling study. Lancet Infect. Dis. 2017;17:974–980. - PubMed
    1. Locht C., Antoine R. The history of pertussis toxin. Toxins (Basel) 2021;13:623. - PMC - PubMed
    1. Bagcchi S. Pertussis cases rise in Denmark. Lancet Infect. Dis. 2023;23:e469. - PubMed
    1. Dalby T. Clarifying pertussis in Denmark. Lancet Infect. Dis. 2024;24:e77. - PubMed
    1. Mattoo S., Cherry J.D. Molecular pathogenesis, epidemiology, and clinical manifestations of respiratory infections due to Bordetella pertussis and other Bordetella subspecies. Clin. Microbiol. Rev. 2005;18:326–382. - PMC - PubMed

Publication types

LinkOut - more resources