. 2024 Dec:90:102053.
doi: 10.1016/j.molmet.2024.102053. Epub 2024 Oct 29.

RNA-binding protein YBX3 promotes PPARγ-SLC3A2 mediated BCAA metabolism fueling brown adipogenesis and thermogenesis

Affiliations

RNA-binding protein YBX3 promotes PPARγ-SLC3A2 mediated BCAA metabolism fueling brown adipogenesis and thermogenesis

Lin-Yun Chen et al. Mol Metab. 2024 Dec.

Abstract

Objective: Activating brown adipose tissue (BAT) thermogenesis is a promising approach to combat obesity and metabolic disorders. The post-transcriptional regulation of BAT thermogenesis mediated by RNA-binding proteins (RBPs) is still not fully understood. This study explores the physiological role of novel RBPs in BAT differentiation and thermogenesis.

Methods: We used multiple public datasets to screen out novel RBPs responsible for BAT differentiation and thermogenesis. In vitro loss- and gain-of-function experiments were performed in both C3H10T1/2 preadipocytes and mature brown adipocytes to determine the role of Y-box binding protein 3 (YBX3) in brown adipocyte differentiation and thermogenesis. Adeno-associated virus (AAV)-mediated BAT-specific knockdown or overexpression of Ybx3 was applied to investigate the function of YBX3 in vivo.

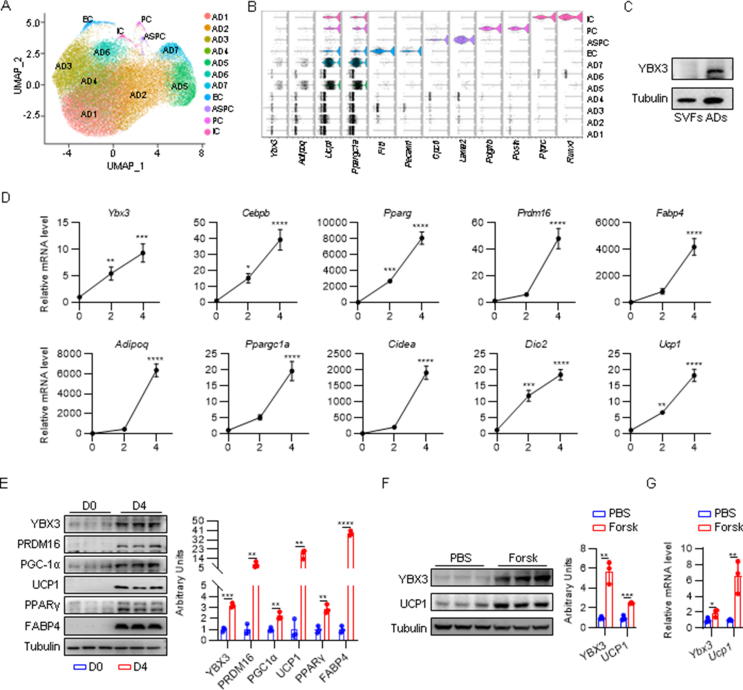
Results: YBX3 is a brown adipocyte-enriched RBP induced by cold stimulation and β-adrenergic signaling. Both in vitro loss- and gain-of-function experiments demonstrate that YBX3 is essential for brown adipocyte differentiation and thermogenesis. BAT-specific loss of Ybx3 dampens thermogenesis and exacerbates diet-induced obesity in mice, while overexpression of Ybx3 promotes thermogenesis and confers protection against diet-induced metabolic dysfunction. Transcriptome analysis and mitochondrial stress test indicate that Ybx3 deficiency compromises the mitochondrial oxidative phosphorylation, leading to thermogenic failure. Mechanistically, YBX3 stabilizes the mRNA of Slc3a2 and Pparg, which facilitates branched-chain amino acid (BCAA) influx and catabolism and fuels brown adipocyte differentiation and thermogenesis.

Conclusions: YBX3 facilitates BAT fueling BCAA to boost thermogenesis and energy expenditure, which protects against obesity and metabolic dysfunction. Thus, YBX3 could be a promising therapeutic target for obesity.

Keywords: Branched-chain amino acid; Brown adipose tissue; Obesity; Thermogenesis; YBX3.


Conflict of interest statement

Declaration of competing interest The authors declare that they have no known competing financial interests or personal relationships that could have appeared to influence the work reported in this paper.

Figures

Image 1
Graphical abstract
Figure 1
Figure 1
YBX3 is a brown adipocyte-enriched RBP responding to ambient temperature and adrenergic signaling. (A) Heatmap of differentially expressed RBPs genes in the BAT from mice exposed to cold and thermoneutrality (TN) (n = 3–4, p < 0.05, |log2FC| >1.5). (B) Heatmap of differentially expressed RBPs genes in the SAT from mice exposed to cold and TN (n = 3, p < 0.05, |log2FC| >1.5). (C) Heatmap of differentially expressed RBPs genes in mature adipocytes versus preadipocytes (n = 3, p < 0.05, |log2FC| >1.3). (D) Venn diagram shows 25 shared upregulated RBPs from (A), (B), (C). (E) Heatmap of RBPs genes expression patterns across different tissues. (F) Immunoblot of YBX3 and UCP1 in BAT, VAT, and SAT (left) and quantification (right) (n = 4). (G) mRNA levels of Ybx3 and Ucp1 in BAT, VAT and SAT. (n = 4). (H) Immunoblot of YBX3 and UCP1in BAT of mice exposed to room temperature (RT) or cold (left) and quantification (right) (n = 4). (I) mRNA levels of Ybx3 and Ucp1 in BAT of mice exposed to RT or cold (n = 4). (J) Immunoblot of YBX3 and UCP1 in BAT of mice exposed to RT or TN (left) and quantification (right) (n = 4). (K) mRNA levels of Ybx3 and Ucp1 in the BAT of mice exposed to RT or TN (n = 4). (L) Immunoblot of YBX3 and UCP1 in the BAT of mice treated with CL-316,243 (CL) or PBS (left) and quantification (right) (n = 4). (M) mRNA levels of Ybx3 and Ucp1 in the BAT of mice treated with CL or PBS (n = 4). Data are shown as the mean ± SD. ∗P < 0.05, ∗∗P < 0.01, ∗∗∗P < 0.001, ∗∗∗∗P < 0.0001 by one-way ANOVA with Tukey multiple comparison tests (F–G) or two-tailed Student’s t-test (H–M). (For interpretation of the references to colour in this figure legend, the reader is referred to the Web version of this article.)
Figure 2
Figure 2
YBX3 is essential for brown adipocyte differentiation and thermogenesisin vitro. (A, C) Immunoblots of YBX3, adipogenic, and thermogenic proteins in Ybx3 knockdown (A) or overexpressed (C) adipocytes and control cells (left) and quantification (right) (n = 3). (B, D) mRNA levels of Ybx3, adipogenic, and thermogenic genes in Ybx3 knockdown (B) or overexpressed (D) adipocytes and control cells (n = 4). (E, G) mRNA level of genes related to mitochondrial OXPHOS, biogenesis, and dynamics in mature brown adipocytes with Ybx3 knockdown or overexpression and control cells (n = 3). (F, H) OCR curve of mature brown adipocytes with Ybx3 knockdown (F) or overexpression (H) and control cells (left), and quantification (right) (n = 5). Rot, rotenone; AA, antimycin. (I) Intracellular ATP levels of mature brown adipocytes with Ybx3 knockdown or Ybx3 overexpression and control cells (n = 3). (J) The mtDNA/nDNA ratio of mature brown adipocytes with Ybx3 knockdown or Ybx3 overexpression and control cells (n = 6). Data are shown as the mean ± SD or mean ± SEM (F and H). ∗P < 0.05, ∗∗P < 0.01, ∗∗∗P < 0.001, ∗∗∗∗P < 0.0001 by two-tailed Student’s t-test (A–I). (For interpretation of the references to colour in this figure legend, the reader is referred to the Web version of this article.)
Figure 3
Figure 3
BAT-specific loss of Ybx3 impairs thermogenesis and exacerbates diet-induced obesity. (A) Core temperature under cold exposure (n = 4). (B) Hourly curve of oxygen consumption (left) and quantification (right) under ND feeding (n = 4). (C) Core temperature after CL treatment (n = 5). (D) Hourly curve of oxygen consumption (left) and quantification (right) under CL treatment (n = 4). (E) IHC staining of UCP1 in the BAT after acute cold exposure (n = 4, Bar = 50 μm). (F) Immunoblots of PGC-1α, UCP1, and YBX3 in the BAT after acute cold exposure (left) and quantification (right) (n = 4). (G) mRNA levels of thermogenic genes in the BAT after acute cold exposure (n = 4). (H) Body weight gain curve under HFD feeding (n = 5). (I–J) GTT (I) and ITT (J) under HFD feeding (n = 5). (K) Gross picture of BAT, SAT, VAT, and liver. (L) The ratio of adipose tissue and liver weight to body weight (n = 5). (M) H&E staining of BAT, SAT, VAT, and liver (n = 5, Bar = 50 μm). (N) The adipocyte area quantification of SAT and VAT (n = 5). Data are shown as the mean ± SD or mean ± SEM (B and D). ∗P < 0.05, ∗∗P < 0.01, ∗∗∗P < 0.001, ∗∗∗∗P < 0.0001 by two-way ANOVA with Bonferroni multiple comparison test (A, C, H-J), ANCOVA with body weight as covariant (B, D) or two-tailed Student’s t-test (F-G, I-J, L, N).
Figure 4
Figure 4
YBX3 stabilizes Slc3a2 mRNA to facilitate BCAA influx and fuel brown adipocyte differentiation and thermogenesis. (A) mRNA level of Ybx3, Slc3a2 and Slc7a5 in Ybx3 knockdown brown adipocytes and control cells (n = 5). (B) Immunoblots of YBX3, SLC3A2, and SLC7A5 in Ybx3 knockdown brown adipocytes and control cells (left) and quantification (right) (n = 3). (C) mRNA level of Slc3a2 and Slc7a5 in Ybx3 knockdown brown adipocytes and control cells at indicated time-points after actinomycin D (10 mg/ml) treatment (n = 3). (D) mRNA level of Slc3a2 and Slc7a5 in BAT under ND feeding (n = 4). (E) Heatmap of serum amino acid levels after acute cold exposure under ND feeding (n = 3). (F) Serum BCAA levels under HFD feeding (n = 4). (G) Serum BCAA level curve during BCAA tolerance test (left) and quantification (right) under ND feeding (n = 4). (H) Immunoblots of YBX3, SLC3A2, and UCP1 in brown adipocytes with indicated treatment (left) and quantification (right) (n = 3). (I) mRNA level of Ybx3, Slc3a2, and thermogenic genes in mature brown adipocytes with indicated treatment (n = 4). (J) Immunoblots of YBX3, SLC3A2, and UCP1 in mature brown adipocytes with indicated treatment (left) and quantification (right) (n = 3). (K) mRNA level of Ybx3, Slc3a2, and thermogenic genes in mature brown adipocytes with indicated treatment (n = 4). Data are shown as the mean ± SD. ∗P < 0.05, ∗∗P < 0.01, ∗∗∗P < 0.001, ∗∗∗∗P < 0.0001 by two-tailed Student’s t-test (A-B, D, F-G), two-way ANOVA with Bonferroni multiple comparison test (C, G), one-way ANOVA with Tukey multiple comparison test (H–K). (For interpretation of the references to colour in this figure legend, the reader is referred to the Web version of this article.)
Figure 5
Figure 5
Loss of Ybx3 disturbs PPARγ-dependent brown adipocyte thermogenesis and BCAA catabolism. (A) mRNA level of Pparg and thermogenic genes in Ybx3 knockdown brown adipocytes and control cells at indicated time-points after actinomycin D treatment (n = 3). (B) Immunoblots of YBX3, PPARγ, and UCP1 in brown adipocytes with indicated treatment (left) and quantification (right) (n = 3). (C) mRNA level of Ybx3, Pparg, and thermogenic genes in brown adipocytes with indicated treatment (n = 4). (D) Immunoblots of YBX3, PPARγ, and UCP1 in mature brown adipocytes with indicated treatment (left) and quantification (right) (n = 3). (E) mRNA level of Ybx3, Pparg, and thermogenic genes in mature brown adipocytes with indicated treatment (n = 4). (F) mRNA level of BCAA catabolic genes in brown adipocytes with indicated treatment (n = 5–6). (G) mRNA level of BCAA catabolic genes in mature brown adipocytes with indicated treatment (n = 3). Data are shown as the mean ± SD. ∗P < 0.05, ∗∗P < 0.01, ∗∗∗P < 0.001, ∗∗∗∗P < 0.0001 by two-way ANOVA (A), one-way ANOVA with Tukey multiple comparison test (B–G). (For interpretation of the references to colour in this figure legend, the reader is referred to the Web version of this article.)
Figure 6
Figure 6
BAT-specific gain of Ybx3 prompts thermogenesis to protect against diet-induced metabolic dysregulation. (A) Thermal imagery under acute cold exposure (n = 4–5). (B) Core temperature under cold exposure (n = 4–5). (C) Hourly oxygen consumption curve (left) and quantification (right) (n = 4–5). (D) Hourly energy expenditure curve (left) and quantification (right) (n = 4–5). (E) IHC staining of UCP1 in BAT after acute cold exposure (n = 4–5, Bar = 50 μm). (F) Immunoblots of PGC-1α, UCP1, SLC3A2, and YBX3 in the BAT after acute cold exposure (left) and quantification (right) (n = 4–5). (G) mRNA level of Slc3a2 and thermogenic genes in the BAT after acute cold exposure (n = 4–5). (H) Body weight gain curve under HFD feeding (n = 5). (I–J) GTT (I) and ITT (J) under HFD feeding (n = 5). (K) Gross picture of BAT, SAT, VAT, and liver under HFD feeding. (L) The ratio of adipose tissue and liver weight to body weight under HFD feeding (n = 5). (M) H&E staining of BAT, SAT, VAT, and liver under HFD feeding (n = 5, Bar = 50 μm). (N) The adipocyte area quantification of SAT and VAT under HFD feeding (n = 5). Data are shown as mean ± SD. Hourly oxygen consumption and energy expenditure in Figures 7C and D are shown as the mean ± SEM. ∗P < 0.05, ∗∗P < 0.01, ∗∗∗P < 0.001, ∗∗∗∗P < 0.0001 by two-way ANOVA with Bonferroni multiple comparison test (B, H-J), ANCOVA with body weight as covariant (C, D) or two-tailed Student’s t-test (F-G, I-J, L, M).
figs1
figs1
figs2
figs2
figs3
figs3
figs4
figs4
figs5
figs5
figs6
figs6

References

    1. Bluher M. Obesity: global epidemiology and pathogenesis. Nat Rev Endocrinol. 2019;15(5):288–298. - PubMed
    1. Cohen P., Kajimura S. The cellular and functional complexity of thermogenic fat. Nat Rev Mol Cell Biol. 2021;22(6):393–409. - PMC - PubMed
    1. Li Y., Wang D., Ping X., Zhang Y., Zhang T., Wang L., et al. Local hyperthermia therapy induces browning of white fat and treats obesity. Cell. 2022;185(6):949–966. e919. - PubMed
    1. Zhou R., Huang Y., Feng X., Zhou R., Wang L., Xie G., et al. Decreased YB-1 expression denervates brown adipose tissue and contributes to age-related metabolic dysfunction. Cell Prolif. 2024;57(1) - PMC - PubMed
    1. Feng X., Wang L., Zhou R., Zhou R., Chen L., Peng H., et al. Senescent immune cells accumulation promotes brown adipose tissue dysfunction during aging. Nat Commun. 2023;14(1):3208. - PMC - PubMed

LinkOut - more resources