. 2024 Oct 31;15(1):9415.
doi: 10.1038/s41467-024-53805-1.

The dual life of disordered lysine-rich domains of snoRNPs in rRNA modification and nucleolar compaction

Affiliations

The dual life of disordered lysine-rich domains of snoRNPs in rRNA modification and nucleolar compaction

Carine Dominique et al. Nat Commun. .

Abstract

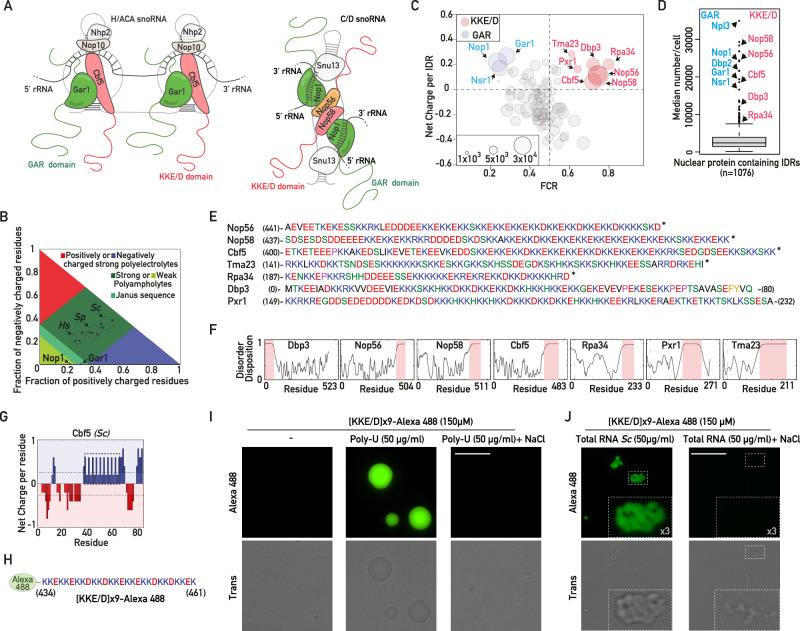
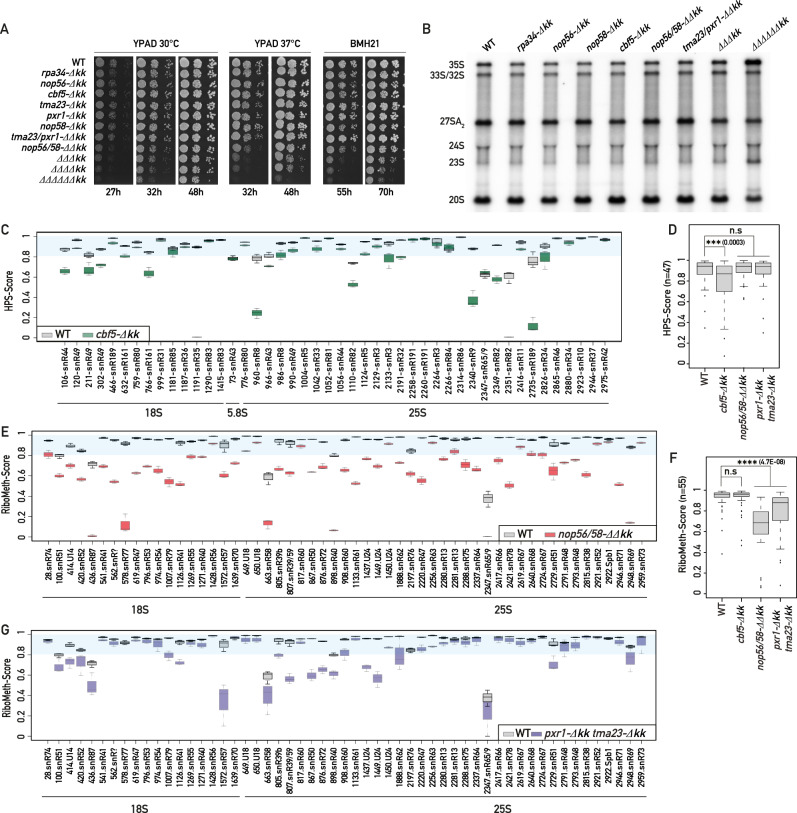
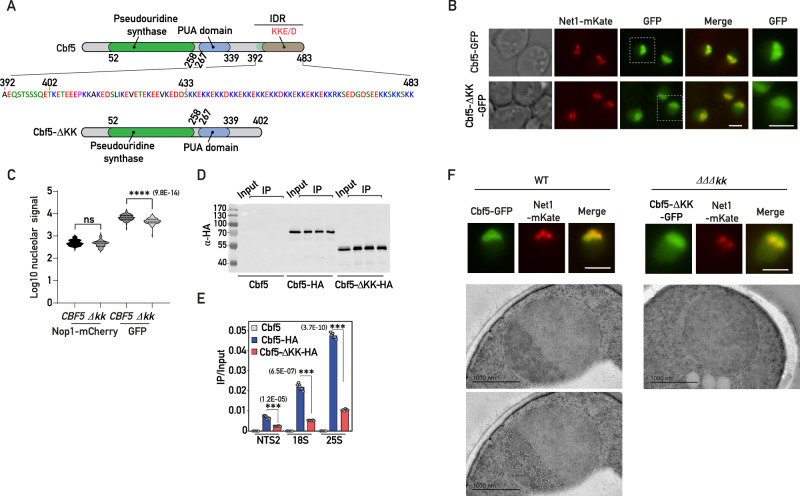
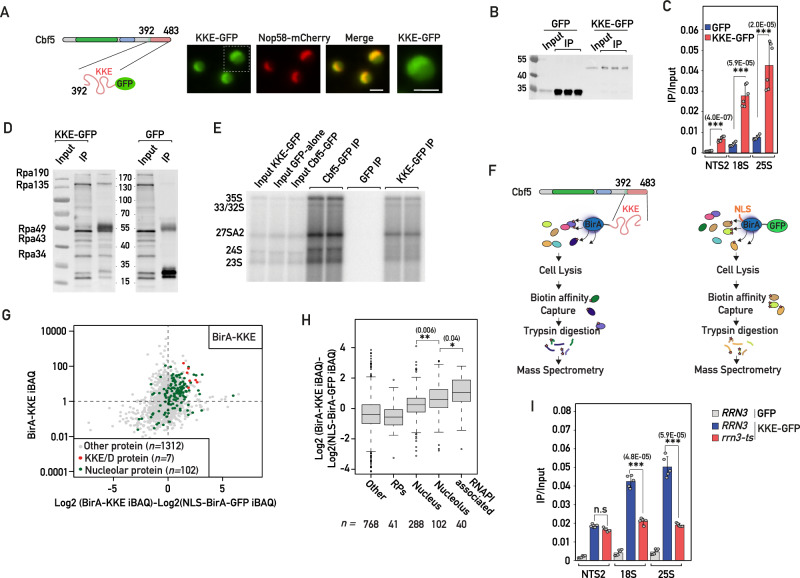
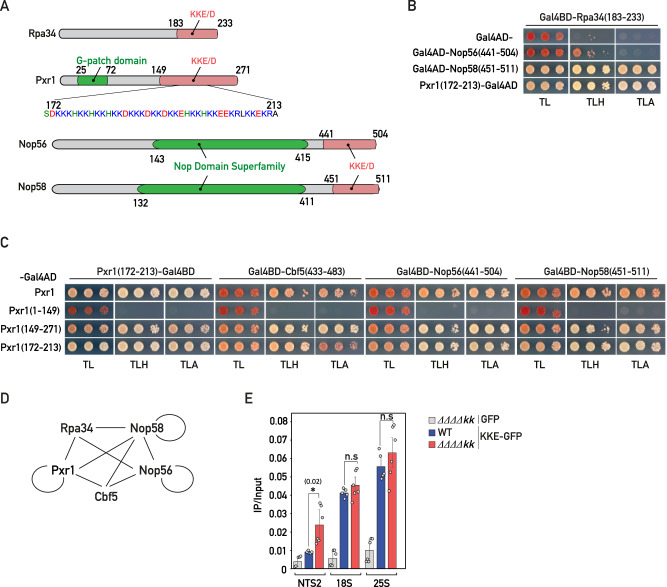
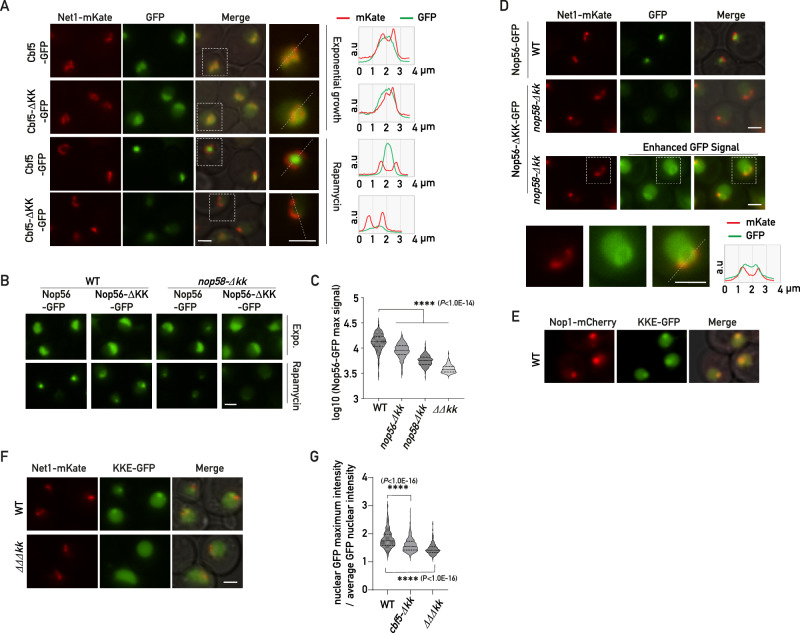
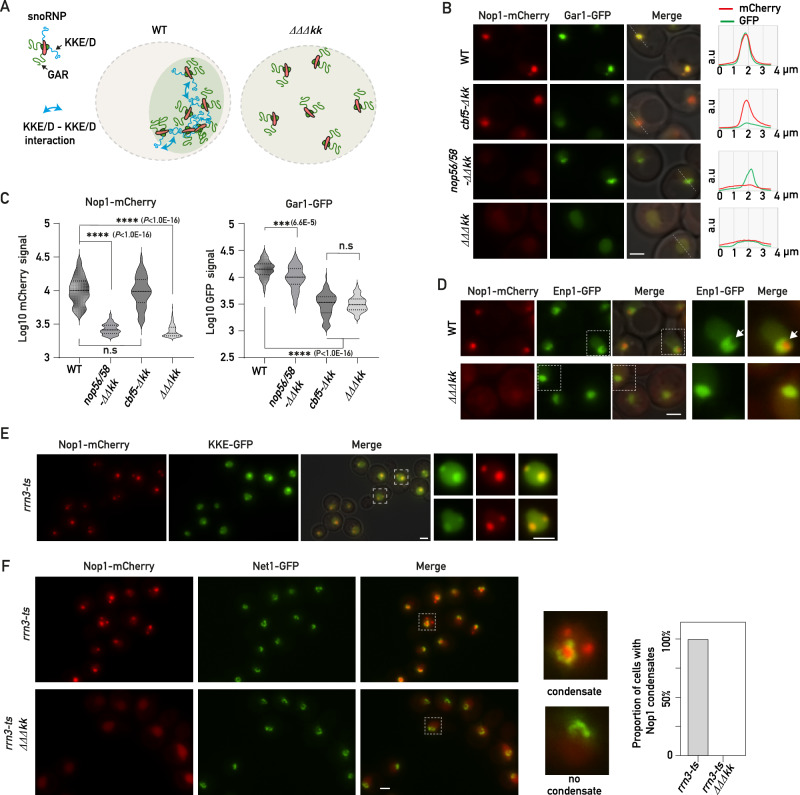
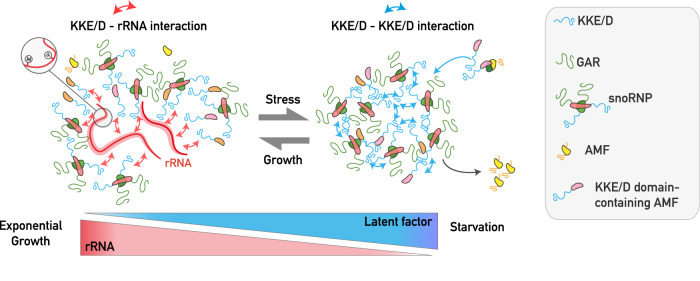
Intrinsically disordered regions (IDRs) are highly enriched in the nucleolar proteome but their physiological role in ribosome assembly remains poorly understood. Our study reveals the functional plasticity of the extremely abundant lysine-rich IDRs of small nucleolar ribonucleoprotein particles (snoRNPs) from protists to mammalian cells. We show in Saccharomyces cerevisiae that the electrostatic properties of this lysine-rich IDR, the KKE/D domain, promote snoRNP accumulation in the vicinity of nascent rRNAs, facilitating their modification. Under stress conditions reducing the rate of ribosome assembly, they are essential for nucleolar compaction and sequestration of key early-acting ribosome biogenesis factors, including RNA polymerase I, owing to their self-interaction capacity in a latent, non-rRNA-associated state. We propose that such functional plasticity of these lysine-rich IDRs may represent an ancestral eukaryotic regulatory mechanism, explaining how nucleolar morphology is continuously adapted to rRNA production levels.


Conflict of interest statement

The authors declare no competing interests.

Figures

Fig. 1
Fig. 1. A lysine-rich IDR is present in a subset of abundant, early-acting ribosome biogenesis factors.
A Schematic representation of H/ACA and C/D snoRNPs. The KKE/D and GAR domains are shown in pink and green, respectively. B Diagram of states for the KKE/D domains of S. cerevisiae (Sc) Nop56, Nop58, Cbf5 and their H. sapiens (Hs) or S. pombe (Sp) homologs. The position of the GAR domains of Nop1 and Gar1 is also indicated. The red and blue areas correspond to strong polyelectrolyte features with FCR > 0.35 and net charge per residue >0.3 exhibiting coil-like conformations. C Classification of S. cerevisiae IDRs longer than 30 amino acids (n = 110) according to their Frequency of Charged Residues (FCR) and Net Charge as defined in Holehouse et al.. The size of each circle is proportional to protein abundance (Ho et al.). Blue and red circles correspond to GAR domain- and KKE/D domain-containing proteins, respectively. D Box plot showing the abundance of all nuclear proteins (n = 1076) containing IDRs longer than 30 amino acids. Specific outliers containing KKE/D and GAR domains are indicated. E KKE/D domain amino acid composition. The numbers correspond to the amino acid positions in the full-length sequence. *: C-terminus of the proteins. F Prediction of disorder tendency with PONDR. G Net charge per residue distribution obtained using CIDER (http://pappulab.wustl.edu/CIDER/analysis/) in the KKE/D domain of S. cerevisiae Cbf5. The region highlighted by the dotted rectangle corresponds to the large block of lysine doublets. H Amino acid sequence of the peptide corresponding to the block of lysine doublets of Cbf5 highlighted in (E), which was coupled to Alexa488 ([KKE/D]x9-Alexa488). I Bright-field transmission (trans) and fluorescence (Alexa488) images of coacervate droplets formed in vitro by the [KKE/D]x9-Alexa488 peptide in the absence (-) or in the presence of poly-U RNAs and in the absence or presence of 300 mM NaCl. Scale bar = 15 μm. J As in (I) but coacervates were formed by mixing the [KKE/D]x9-Alexa488 peptide with total RNA from S. cerevisiae in the absence or presence of 300 mM NaCl. Scale bar = 15 μm. Zooms within the indicated dotted squares are shown. Source data are provided as a Source data file.
Fig. 2
Fig. 2. snoRNP KKE/D domains are collectively required for optimal growth, pre-rRNA processing and rRNA modification.
A Tenfold serial dilutions of wild-type or mutant strains bearing individual or multiple deletions of KKE/D domains (-Δkk) were grown in YPAD medium for 27, 32 or 48 h at 30 °C or 37 °C or in the presence of a sub-lethal dose (15 μM) of BMH-21 for 55 or 70 h. rpa34-Δkk (Rpa34-(1-186)), nop56-Δkk (Nop56-(1-441)), cbf5-Δkk (Cbf5-(1-402)), tma23-Δkk (Tma23-(1-141)), pxr1-Δkk (Pxr1-(1-149)), nop58-Δkk (Nop58-(1-438)), ΔΔΔkk (nop56-Δkk, nop58-Δkk, cbf5-Δkk), ΔΔΔΔkk (nop56-Δkk, nop58-Δkk, cbf5-Δkk, rpa34-Δkk), ΔΔΔΔΔΔkk (nop56-Δkk, nop58-Δkk, cbf5-Δkk, rpa34-Δkk, pxr1-Δkk, tma23-Δkk). n = 3 biologically independent experiments (Supplementary Fig. 2A). B Steady-state levels of rRNA precursors in the wild-type (WT) strain and the indicated KKE/D domain mutant strains. Total RNAs extracted from these strains were analyzed by Northern blotting using radiolabeled probes (23S.1 + 20S.3, Supplementary Data 8) detecting the indicated precursors. n = 4 biologically independent experiments (Supplementary Fig. 2C). C, E, G Comparison of the HydraPsi-Scores (HPS-Score) for each rRNA pseudouridine in WT (gray) and cbf5-Δkk (green) strains (C). Comparison of the RiboMeth-Scores for each rRNA 2’-O-ribose methylation in WT (gray) and nop56/58-ΔΔkk (red) strains (E) or in WT (gray) and pxr1-Δkk tma23-Δkk (purple) strains (G). HydraPsi-Score and RiboMeth-Score indicate the fraction of uridine isomerisation and 2′-O-methylation at each site, respectively. The blue shaded area allows visualization of all sites that are highly modified (HPS or RMS scores >0.8). n = 3 biologically independent experiments. Box limits = 25th to 75th percentiles; line = median; Whiskers extend to 1.5 times the interquartile range on both ends. Source data are provided as a Source Data file. Box plots showing the HydraPsi-Scores (D) or RiboMeth-Scores (F) in wild-type (WT) and the indicated KKE/D mutant strains for all rRNA modification sites (n = 47 for HydraPsi-Scores and n = 55 for RiboMeth-Score). p values were calculated with unpaired two-samples Wilcoxon test. Significant differences are indicated by stars and with the exact p value on the graph. Source data are provided as a Source data file.
Fig. 3
Fig. 3. The KKE/D domain is essential for recruitment to the vicinity of rDNA genes.
A Schematic representation of Cbf5 and Cbf5-ΔKK. The pseudouridine synthase, PUA and KKE/D domains are indicated in green, blue and red, respectively. The full IDR sequence (392-483) of Cbf5 is shown. The lysine-enriched region starts after amino acid 402 and the specific region containing several lysine doublets starts after amino acid 433. B CBF5-GFP and cbf5-Δkk-GFP strains expressing Net1-mKate, revealing the intranucleolar position of the rDNA, were grown exponentially and cells were analyzed by fluorescence microscopy. Merge: overlay of both fluorescent signals. Zooms of the GFP signals within the indicated dotted squares are shown on the right. Scale bars = 2 μm. C Quantification of the nucleolar Nop1-mCherry and GFP signals (Log10) in CBF5-GFP (CBF5; n = 89) and cbf5-Δkk-GFP (∆kk; n = 89) strains inspected in (A). p values were calculated with unpaired two-tailed Welch’s t test. n = number of cells pooled from 3 biologically independent replicates. D Western blot analysis using anti-HA antibodies showing the IP efficiencies of Cbf5 (no tag control), Cbf5-HA or Cbf5-ΔKK-HA in the ChIP-qPCR experiments shown in (E). Three technical IP replicates are shown for each condition as well as the corresponding input sample. E Cbf5 occupancy on rDNA genes at 18S, 25S or intergenic (NTS2) regions in strains expressing Cbf5 (no tag control), Cbf5-HA and Cbf5-ΔKK-HA evaluated by ChIP-qPCR. Immunoprecipitations were performed using anti-HA antibodies. Unpaired two-tailed t-test analysis was used for statistics. Data are presented as mean values ± SD. Significant differences are indicated by stars and with the p value on the graph. n = 6 biologically independent experiments. F Representative cells of CBF5-GFP or cbf5-Δkk-GFP, nop56-Δkk, nop58-Δkk (ΔΔΔkk) strains expressing Net1-mKate grown exponentially and analyzed as in (B) by fluorescence microscopy (top panels; scale bars = 2 μm) or for ultrastructural studies by transmission electron microscopy (bottom panels; scale bars = 1 μm). Position of the DFC in the wild-type nucleolus (WT) was determined by visual inspection of highly contrasted regions using ImageJ software before manual segmentation. A similar contrasted region is not observable in the ΔΔΔkk strain. Source data are provided as a Source data file.
Fig. 4
Fig. 4. The KKE/D domain is sufficient to promote efficient targeting close to transcribed rDNA genes.
A Strains expressing Nop58-mCherry and the KKE/D-GFP (KKE-GFP) construct were grown exponentially, and cells were analyzed by fluorescence microscopy. Zooms of the GFP signals are shown. Scale bars = 2 μm. B Western blot analysis using anti-GFP antibodies showing the IP efficiencies of GFP or KKE/D-GFP (KKE-GFP) in the ChIP-qPCR experiments shown in (C). C GFP and KKE/D-GFP (KKE-GFP) occupancy on rDNA genes at 18S, 25S or intergenic (NTS2) regions in wild-type cells evaluated by ChIP-qPCR. Unpaired two-tailed t-test analysis was used for statistics. Data are presented as mean values ± SD. Significant differences are indicated by stars and with the p value. n = 5 biologically independent experiment. D KKE/D-GFP (KKE-GFP) or GFP were immunoprecipitated using anti-GFP antibodies from formaldehyde-treated cells. Anti-RNAPI antibodies detecting all subunits were used to assess the co-immunoprecipitation of RNAPI. n = 2 biologically independent experiments. E KKE/D-GFP (KKE-GFP), Cbf5-GFP or GFP were immunoprecipitated using anti-GFP antibodies under native conditions. The co-immunoprecipitation of rRNA precursors was assessed by Northern blotting using radiolabeled probe 23S.1 (Supplementary Data 8). n = 2 biologically independent experiments. F Schematic representation of the TurboID-based proximity labeling experiments. G Scatter plot showing the normalized abundance value (iBAQ, intensity-based absolute quantification) of each protein detected in the purification of biotinylated proteins from cells expressing the BirA-KKE bait plotted against the relative abundance of these proteins (log2-transformed enrichment) compared to their normalized iBAQ value in the control purification from cells expressing the NLS-BirA-GFP bait. KKE/D domain-containing proteins and nucleolar proteins are labeled. n is indicated for each category. Source data are provided as a Source Data file. H The proteins detected in the TurboID-based proximity labeling assay were classified into non-overlapping subsets including RPs, proteins associated with RNAPI, proteins reported to localize in the nucleus, in the nucleolus or in other cellular areas. The log2-transformed enrichment is given for each category. p values were calculated with unpaired two-tailed Welch’s t test. Significant differences are indicated by stars and with the p value. n is indicated for each category. I KKE/D-GFP (KKE-GFP) or GFP occupancy on rDNA genes at 18S, 25S or intergenic (NTS2) regions in wild-type (RRN3) or rrn3-8 (rrn3-ts) mutant cells grown at 37 °C. p values were calculated and indicated as in (C). n = 5 biologically independent experiments. Source data are provided as a Source data file.
Fig. 5
Fig. 5. KKE/D domains interact in a homo- and heterotypic manner.
A Schematic representation of the domain organization of Rpa34, Pxr1, Nop56 and Nop58 proteins. B Yeast two-hybrid (Y2H) assays using the indicated combinations of the Gal4 activation domain (Gal4AD) alone or fused to the KKE/D domain of Nop56 (Nop56(441-504)), the KKE/D domain of Nop58 (Nop58(451-511)), or the KKE/D repeats of Pxr1 (Pxr1(172-213)) and the Gal4 DNA-binding domain (Gal4BD) fused to the KKE/D domain of Rpa34 (Rpa34(183-233)). Growth on SDC lacking tryptophan and leucine (TL) allowed to select cells containing both constructs; growth on SDC lacking tryptophan, leucine and histidine (TLH) indicated that the constructs interact; growth on SDC lacking tryptophan, leucine and adenine (TLA) indicated that the constructs interact strongly. n = 3 biologically independent experiments. C Y2H assays using the indicated combinations of the Gal4 activation domain (Gal4AD) fused to full-length Pxr1 (Pxr1), Pxr1 lacking its KKE/D domain (Pxr1(1-149)), Pxr1’s isolated KKE/D domain (Pxr1(149-271)) or Pxr1’s KKE/D repeats (Pxr1(172-213)) and the Gal4 DNA-binding domain (Gal4BD) fused to the KKE/D repeats of Pxr1 (Pxr1(172-213)), the KKE/D repeats of Cbf5 (Cbf5(433-483)), the KKE/D domain of Nop56 (Nop56(441-504)) or the KKE/D domain of Nop58 (Nop58(451-511)). Same legend as in (B). n = 3 biologically independent experiments. D Schematic representation of the interactions detected by Y2H assays between the KKE/D domains of Rpa34, Cbf5, Pxr1, Nop56 and Nop58 proteins. Circles correspond to self-interaction in a KKE/D domain-dependent manner. E KKE/D-GFP (KKE-GFP) or GFP occupancy on rDNA genes at 18S, 25S or intergenic (NTS2) regions in wild-type (WT) or rpa34-Δkk, nop56-Δkk, nop58-Δkk, cbf5-Δkk (ΔΔΔΔkk) quadruple mutant cells. GFP and KKE/D-GFP were immunoprecipitated using anti-GFP antibodies. DNA occupancy was defined as the ratio between the immunoprecipitation (IP) and the input signals. Two-tailed t-test analysis was used for statistics. Data are presented as mean values ± SD. Significant differences are indicated by stars and with the p value. n = 6 biologically independent experiments. Source data are provided as a Source data file.
Fig. 6
Fig. 6. KKE/D domains are essential for nucleolar compaction and sequestration of associated factors in a specific subnucleolar area following TORC1 inactivation.
A Fluorescence microscopy analyses of CBF5-GFP and cbf5-Δkk-GFP cells expressing Net1-mKate grown exponentially (Exponential growth) or treated for 4 h with rapamycin (Rapamycin). Zooms of the indicated dotted square areas are shown on the right and average plots (right panel) show the signal profiles of mKate and GFP in the nucleolus along the indicated dotted lines. Scale bars = 2 μm. B Fluorescence microscopy analyses of wild-type (WT) or nop58-Δkk cells expressing Nop56-GFP or Nop56-ΔKK-GFP grown exponentially (Expo.) or treated for 4 h with rapamycin (Rapamycin). Scale bar = 2 μm. C Quantification of maximum nuclear GFP signals (Log10) of wild-type or nop58-Δkk cells inspected in (B) expressing Nop56-GFP (WT; n = 149 and nop58-Δkk; n = 149) or Nop56-ΔKK-GFP (WT; n = 149 and ΔΔkk; n = 112) treated for 4 h with rapamycin. p values were calculated with unpaired two-tailed Welch’s t test. n = number of cells pooled from 3 biologically independent replicates. D Fluorescence microscopy analyses of wild-type (WT) or nop58-Δkk cells expressing Nop56-GFP or Nop56-ΔKK-GFP or treated for 4 h with rapamycin. Net1-mKate allows localization of rDNA in the vicinity of the Nop56 condensate. Merge: overlay of both fluorescent signals. Bottom panel: 16-bit brightness levels have been increased to specifically visualize the GFP signal in nop56-Δkk-GFP nop58-Δkk cells in the vicinity of the Net1-mKate signal. Zooms of the indicated dotted square areas are shown below. Right panel: GFP and mKate average plot signals. Scale bars = 2 μm. E Wild-type (WT) cells expressing Nop1-mCherry and the KKE/D domain of Cbf5 fused to GFP (KKE-GFP) were analyzed by fluorescence microscopy. F Same legend as in (E) for rapamycin-treated wild-type (WT) or cbf5-Δkk nop56/58-ΔΔkk (ΔΔΔkk) cells expressing Net1-mKate and KKE/D-GFP (KKE-GFP). Scale bar = 2 μm. G Quantification of maximum nuclear GFP signals (maximum intensity divided by average intensity) in rapamycin-treated wild-type (WT; n = 373), cbf5-Δkk (n = 249) or cbf5-Δkk nop56/58-ΔΔkk (ΔΔΔkk; n = 161) cells expressing the KKE/D-GFP construct. p-values were calculated and indicated as in (C). n = number of cells pooled from 3 biologically independent replicates. Source data are provided as a Source data file.
Fig. 7
Fig. 7. KKE/D domains are essential for nucleolar compaction and sequestration of associated factors in a specific subnucleolar area following TORC1 inactivation.
A Schematic representation of the proposed role of KKE/D domains as dimeric ligands between latent snoRNPs contributing to increase the local concentration of GAR domain-containing proteins in wild-type cells but not in the absence of the KKE/D domains of snoRNPs (ΔΔΔkk). B Rapamycin-treated wild-type (WT), cbf5-Δkk, nop56/58-ΔΔkk or cbf5-Δkk nop56/58-ΔΔkk (ΔΔΔkk) cells bearing two plasmids allowing expression of Nop1-mCherry and Gar1-GFP were analyzed by fluorescence microscopy. Average plots (right panel) show the mCherry and GFP signal profiles in the nucleolus along the indicated dotted lines. Scale bar = 2 μm. C Quantification of maximum nuclear Nop1-mCherry (left panel: WT (n = 135), cbf5-Δkk (n = 64), nop56/58-ΔΔkk (n = 142) or cbf5-Δkk nop56/58-ΔΔkk (ΔΔΔkk; n = 211)) or Gar1-GFP (right panel: WT (n = 89), cbf5-Δkk (n = 68), nop56/58-ΔΔkk (n = 100) or cbf5-Δkk nop56/58-ΔΔkk (ΔΔΔkk; n = 144)) signals (Log10) in rapamycin-treated cells inspected in (B). p values were calculated with unpaired two-tailed Welch’s t test. n = number of cells pooled from 3 biologically independent replicates. D Rapamycin-treated wild-type (WT) or ΔΔΔkk cells expressing Nop1-mCherry and Enp1-GFP were analyzed by fluorescence microscopy. Zooms of the indicated dotted square areas are shown on the right. Arrows show the specific region where Nop1 accumulates in wild-type cells in a representative nucleus. Scale bar = 2 μm. E Fluorescence microscopy analyses of rrn3-ts cells expressing Nop1-mCherry and the KKE/D-GFP construct (KKE-GFP) grown exponentially at 25 °C and transferred for 1 h to 37 °C. Zooms of the GFP, mCherry and merged signals in the indicated dotted squares are shown on the right. Scale bars = 2 μm. F Fluorescence microscopy analyses of rrn3-ts or rrn3-ts ΔΔΔkk cells expressing Nop1-mCherry and Net1-GFP grown exponentially at 25 °C and transferred for 1 h to 37 °C. Zooms of the merged GFP and mCherry signals within the indicated dotted squares are shown on the right as examples of cells with or without Nop1-mCherry condensates. Scale bar = 2 μm. The right panel shows a proportional graph based on the number of manually counted cells (n = 109 from 3 biologically independent replicates) with or without Nop1-mCherry condensates. Source data are provided as a Source data file.
Fig. 8
Fig. 8. Schematic representation of the proposed model on the dual role of KKE/D domains depending on growth conditions.
During exponential growth, the KKE/D domain is targeted to the close vicinity of actively transcribed rDNA genes through electrostatic interaction with nascent pre-rRNAs, without engaging in cooperative interactions with the other abundant KKE/D domains that are also associated with nascent pre-rRNAs. This specific targeting property is essential for proper activity of snoRNPs and RNA helicases in rRNA modification. In stress conditions, such as RNAPI inhibition or limited nutrient availability, during which the pre-rRNA synthesis rate declines, the proportion of latent KKE/D domain-containing AMFs increases and self-interactions among their KKE/D domains promote the cooperative concentration of these AMFs and their partners in a specific subnucleolar structure. Other early nucleolar AMFs not equipped with a KKE/D domain are excluded from these condensates. In this process, we propose that the KKE/D domains of latent snoRNPs are particularly important to increase the local concentration of GAR domain-containing proteins, allowing formation of subnucleolar condensates and subsequent sequestration of AMFs involved in the earliest stages of ribosome biogenesis (RNAPI, RNA helicases, snoRNPs).

Similar articles

Cited by

References

    1. Peña, C., Hurt, E. & Panse, V. G. Eukaryotic ribosome assembly, transport and quality control. Nat. Struct. Mol. Biol.24, 689–699 (2017). - PubMed
    1. Klinge, S. & Woolford, J. L. Ribosome assembly coming into focus. Nat. Rev. Mol. Cell Biol.20, 116–131 (2019). - PMC - PubMed
    1. Henras, A. K., Plisson-Chastang, C., O’Donohue, M.-F., Chakraborty, A. & Gleizes, P.-E. An overview of pre-ribosomal RNA processing in eukaryotes. Wiley Interdiscip. Rev. RNA6, 225–242 (2015). - PMC - PubMed
    1. Lafontaine, D. L. J., Riback, J. A., Bascetin, R. & Brangwynne, C. P. The nucleolus as a multiphase liquid condensate. Nat. Rev. Mol. Cell Biol.22, 165–182 (2021). - PubMed
    1. Hernandez-Verdun, D. The nucleolus: a model for the organization of nuclear functions. Histochem. Cell Biol.126, 135–148 (2006). - PubMed

Publication types

MeSH terms

LinkOut - more resources