. 2024 Oct 31;15(1):9418.
doi: 10.1038/s41467-024-53253-x.

Intersecting social and environmental determinants of multidrug-resistant urinary tract infections in East Africa beyond antibiotic use

Collaborators, Affiliations

Intersecting social and environmental determinants of multidrug-resistant urinary tract infections in East Africa beyond antibiotic use

Katherine Keenan et al. Nat Commun. .

Abstract

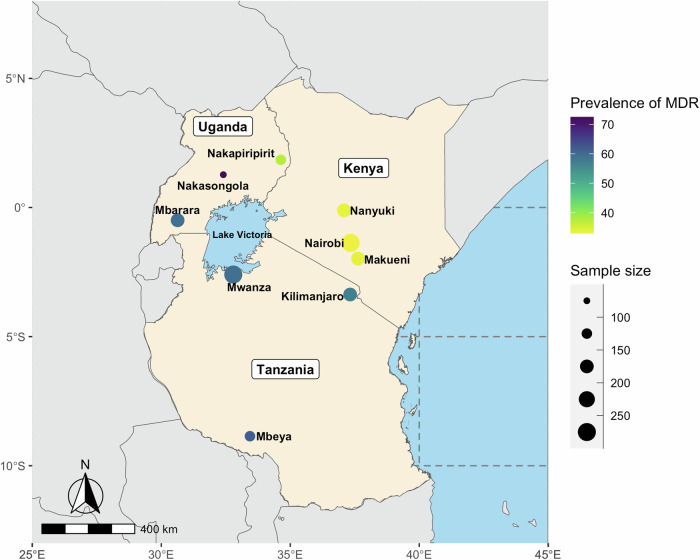
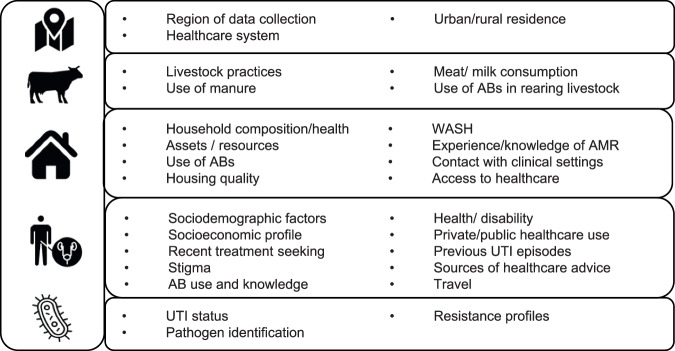
The global health crisis of antibacterial resistance (ABR) poses a particular threat in low-resource settings like East Africa. Interventions for ABR typically target antibiotic use, overlooking the wider set of factors which drive vulnerability and behaviours. In this cross-sectional study, we investigated the joint contribution of behavioural, environmental, socioeconomic, and demographic factors associated with higher risk of multi-drug resistant urinary tract infections (MDR UTIs) in Kenya, Tanzania, and Uganda. We sampled outpatients with UTI symptoms in healthcare facilities and linked their microbiology data with patient, household and community level data. Using bivariate statistics and Bayesian profile regression on a sample of 1610 individuals, we show that individuals with higher risk of MDR UTIs were more likely to have compound and interrelated social and environmental disadvantages: they were on average older, with lower education, had more chronic illness, lived in resource-deprived households, more likely to have contact with animals, and human or animal waste. This suggests that interventions to tackle ABR need to take account of intersectional socio-environmental disadvantage as a priority.


Conflict of interest statement

The authors declare no competing interests.

Figures

Fig. 1
Fig. 1. Map of sites where data was collected in Kenya, Tanzania, and Uganda, their approximate sample sizes, and prevalence of MDR UTI.
The maps shows the 3 African countries where study sampling took place. Large bodies of water are shown in blue. The nine sampling areas are indicated with dots. The size of the dots corresponds to the absolute sample size within each site, that was used in our analysis, such that larger dots indicate a larger sample size. The colour of the dots corresponds to the percentage of MDR UTI found within each of the nine sites, with lighter yellow shades indicating a lower percentage of MDR, and darker blue shades indicating a higher percentage of MDR.
Fig. 2
Fig. 2. Distribution of individual and household-level variables that have a significant association with MDR UTI.
Panel (A) shows individual level variables, panel (B) shows household-level variables. Statistical significance was assessed using two sided chi-square testing with false discovery rate (FDR) control. Variables shown had FDR corrected p-values < 0.05. Exact p values are shown in Supplementary Data 2. Source data are provided as a Source data file.
Fig. 3
Fig. 3. Difference from the median values for 42 variables in the 10 high-risk MDR UTI clusters.
Figure 3 displays how the 42 important variables (y axis) are distributed within each high-risk MDR cluster (x axis). The variables are grouped thematically and within each theme, ranked according to the strength and direction of the associations with MDR. The numbers in the cells indicate the distance between the proportion of this characteristic in the whole sample and the median probability of having this characteristic in the specific cluster. The shading of the blue and red colours indicates the strength of the prevalence of the factor’s category in the high-risk cluster, with deeper colours showing a higher prevalence. For example, a row which contains majority red blocks indicates that subjects that belong to a high-risk MDR UTI cluster are likely to have this factor characteristic, whereas majority blue blocks indicate that subjects that belong to a high-risk MDR cluster are not likely to have this factor characteristic. A mixture of blue or reds, or more neutral shades indicate no clear signal. For more detail, please consult the detailed PReMiuM plots in the supplementary materials. Source data are provided as a Source data file.
Fig. 4
Fig. 4. Factors with clear signals for joint associations with low- or high-risk MDR UTI clusters, based on Bayesian profile analysis for MDR UTI.
The factors are identified from the list of 67 variables considered in the profile regression, which are described in the methods and in Table S3. The factors are ordered hierarchically according to the scale at which they were measured, starting from area-level, to community, to household, to individual-level. The red colour (right hand column of the chart) indicates factors with a clear signal for being associated with membership of high risk MDR UTI clusters. The blue colour (left-hand column) indicates factors with a clear signal for being associated with membership of low risk MDR UTI clusters.
Fig. 5
Fig. 5. Study recruitment and selection of the analysis sample.
The chart shows the recruitment flow and sample selection for the study. We recruited individuals with UTI symptoms attending clinics in our study areas. Following urinanalysis, we selected only those with confirmed UTI. Those patients’ samples then underwent AST analysis to determine resistance within the uropathogen, and we attempted a follow-up visit to the household to collect further social economic and environmental data. The final sample for analysis includes those with valid AST linkage and a completed household visit.
Fig. 6
Fig. 6. Themes covered by the variables included in the analysis.
Summary of themes and the associated variables measured at various scales in this study. The themes are represented on the left-hand side with the associated variable grouped accordingly on the right-hand side. Themes are ordered hierarchically from top to bottom on their scale: Location (site; urban/rural residence), community, One Health and environment dimensions (livestock and farming practices, rubbish disposal), Household characteristics (WASH, household socioeconomic factors, health and AB use patterns), UTI patient individual factors (treatment seeking and AB use, health, socio-demographics, socioeconomic factors, health attitudes and knowledge) and finally microbiological data (bacterial identification and resistance profile).

References

    1. O’Neill, J. Antimicrobial Resistance: Tackling a Crisis for the Health and Wealth of Nations. (Rev. Antimicrob. Resist., 2014).
    1. Murray, C. J. et al. Global burden of bacterial antimicrobial resistance in 2019: a systematic analysis. Lancet399, 629–655 (2022). - PMC - PubMed
    1. van Duin, D. & Paterson, D. L. Multidrug-resistant bacteria in the community: trends and lessons learned. Infect. Dis. Clin.30, 377–390 (2016). - PMC - PubMed
    1. Gandra, S. et al. The mortality burden of multidrug-resistant pathogens in India: a retrospective, observational study. Clin. Infect. Dis.69, 563–570 (2019). - PMC - PubMed
    1. Belete, M. A. & Saravanan, M. A systematic review on drug resistant urinary tract infection among pregnant women in developing Countries in Africa and Asia; 2005–2016. Infect. Drug Resist.13, 1465–1477 (2020). - PMC - PubMed

Publication types

MeSH terms

Substances

LinkOut - more resources