. 2025 Jan;27(1):118-129.
doi: 10.1038/s41556-024-01552-2. Epub 2024 Oct 31.

Cohesin complex oligomerization maintains end-tethering at DNA double-strand breaks

Affiliations

Cohesin complex oligomerization maintains end-tethering at DNA double-strand breaks

Jamie Phipps et al. Nat Cell Biol. 2025 Jan.

Abstract

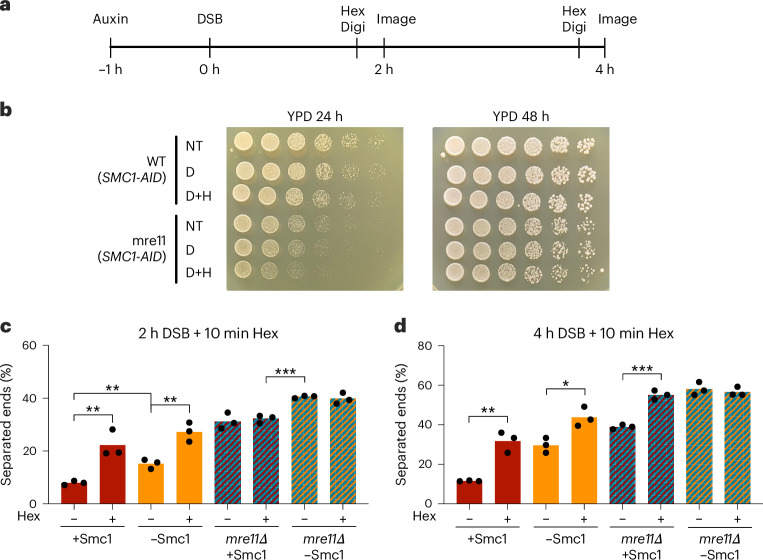
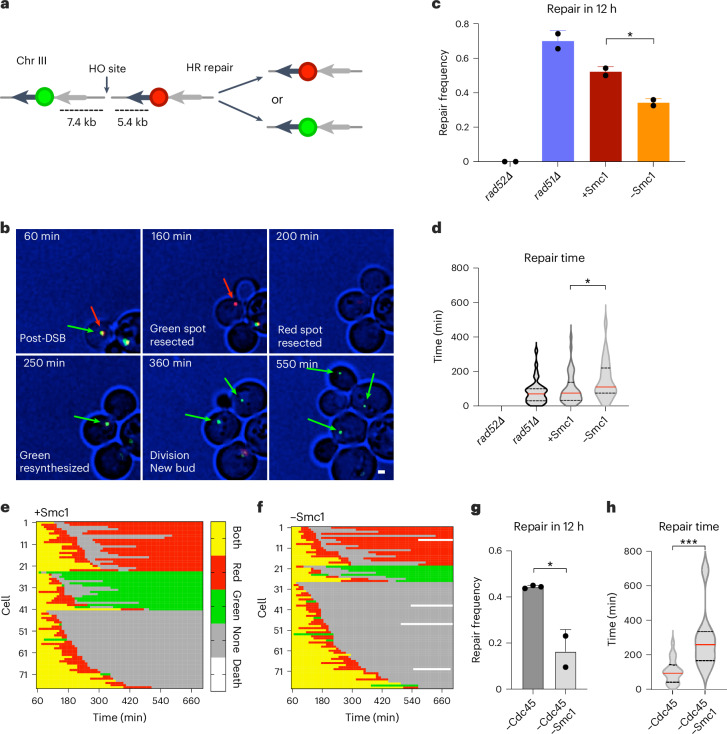
DNA double-strand breaks (DSBs) must be repaired to ensure genome stability. Crucially, DSB-ends must be kept together for timely repair. In Saccharomyces cerevisiae, two pathways mediate DSB end-tethering. One employs the Mre11-Rad50-Xrs2 (MRX) complex to physically bridge DSB-ends. Another requires the conversion of DSB-ends into single-strand DNA (ssDNA) by Exo1, but the bridging proteins are unknown. We uncover that cohesin, its loader and Smc5/6 act with Exo1 to tether DSB-ends. Remarkably, cohesin specifically impaired in oligomerization fails to tether DSB-ends, revealing a function for cohesin oligomerization. In addition to the known importance of sister chromatid cohesion, microscopy-based microfluidic experiments unveil a role for cohesin in repair by ensuring DSB end-tethering. Altogether, our findings demonstrate that oligomerization of cohesin prevents DSB end-separation and promotes DSB repair, revealing a previously undescribed mode of action and role for cohesin in safeguarding genome integrity.


Conflict of interest statement

Competing interests: The authors declare no competing interests.

Figures

Fig. 1
Fig. 1. Cohesin tethers DSB-ends in the Exo1 pathway.
a, A LacO/LacI–mCherry tag and a TetO/TetR–GFP tag were inserted at 5 and 7 kb from the Ho DSB site at the mating-type (MAT) locus, respectively. b, Example of cells with tethered or separated ends. The images are maximum intensity projections and representative of the independent experiments quantified in c and d. Signals are considered as separated when the distance between centres is more than 400 nm. Scale bars, 1 µm. c,d, Percentage of cells with separated ends in the indicated strains after 2 h (c) or 4 h (d) DSB induction. e, Examples of cells showing sister chromatid separation and DSB end-separation upon Smc1-AID auxin-mediated degradation in the absence or presence of DSB induction. The images are maximum intensity projections and are representative of the independent experiments quantified in f. Scale bars, 1 µm. f, Percentage of cells with separated ends in WT and SMC1-AID strains in the absence (−) or presence (+) of auxin after 2 h, 4 h or no DSB induction as indicated. g,i, Percentage of cells with separated ends in the indicated strains after 2 h (g) or 4 h (i) DSB induction. Data are presented as the mean of more than n = 3 independent experiments with N ≥ 150 for each strain and condition (c,d,fi). See source numerical data for detailed numbers. Overlaid black dots show the value of independent biological replicates. P values were calculated using a two-tailed unpaired t-test (*P ≤ 0.05, **P ≤ 0.01, ***P ≤ 0.001, ****P ≤ 0.0001, not significant (NS) P > 0.05). Numerical P values are provided in Supplementary Table 4. In c, WT versus mre11Δ P = 0.0003, WT versus mre11Δ exo1Δ P = 0.0009. In d, WT versus exo1Δ P = 0.0009, WT versus mre11Δ P = 0.0003, exo1Δ versus mre11Δ P = 0.0053, mre11Δ versus mre11Δ exo1Δ P = 0.0126. In f, 2 h SMC1-AID − auxin versus SMC1-AID + auxin P = 0.0292, 4 h SMC1-AID − auxin versus SMC1-AID + auxin P = 0.0033, 4 h SMC1-AID + auxin versus SMC1-AID − auxin no DSB P = 0.0005, 4 h SMC1-AID + auxin versus SMC1-AID + auxin no DSB P = 0.0004. In g, mre11Δ SMC1-AID − auxin versus mre11Δ SMC1-AID + auxin P = 0.0128. In h, mre11Δ versus mre11Δ SMC1-AID + auxin P = 0.0068, mre11Δ SMC1-AID − auxin versus mre11Δ SMC1-AID + auxin P = 0.0095. In i, exo1Δ SMC1-AID – auxin versus exo1Δ SMC1-AID + auxin P = 0.1253. Source data
Fig. 2
Fig. 2. Cohesin DSB end-tethering requires de novo cohesin loading but not sister chromatid cohesion.
a, Schematic representation of an assay to determine DSB end-tethering in the absence of de novo cohesin loading. DSBs were induced after cells were blocked in G2/M with nocodazole for 3 h, and incubated with auxin or ethanol for a further 1 h. b,c, Percentage of G2/M blocked cells with separated ends in the indicated strains after 2 (b) or 4 h (c) DSB induction. d, Schematic representation of the assay used in e to determine DSB end-tethering in the absence of replication. G1 arrested cultures were incubated with auxin or ethanol for 1 h before release in galactose and auxin containing medium. In the absence of Cdc45, cells advance through the cell cycle upon DSB induction, and load cohesin onto chromosomes without undergoing replication. e,f, Percentage of cells with separated ends in the indicated strains after 4 h DSB induction. Data are presented as the mean of more than three independent experiments with N = 150 for each strain and condition (b,c,e,f). See source numerical data for detailed numbers. Overlaid black dots show the values of independent biological replicates. P values were calculated using a two-tailed unpaired t-test (*P ≤ 0.05, **P ≤ 0.01, ***P ≤ 0.001, ****P ≤ 0.0001, NS P > 0.05). Numerical P values are provided in Supplementary Table 4. In b, mre11Δ SMC1-AID − auxin Noc versus mre11Δ SMC1-AID + auxin Noc P = 0.0054, mre11Δ SCC2-AID − auxin versus mre11Δ SCC2-AID + auxin P = 0.0886. In c, SMC1-AID + auxin Noc versus SMC1-AID − auxin Noc P = 0.0068. In e, SMC1-AID + auxin versus CDC45-AID + auxin P = 0.0025, SMC1-AID CDC45-AID − auxin versus SMC1-AID CDC45-AID + auxin P = 0.0092, SCC2-AID + auxin Noc versus SCC2-AID − auxin Noc P = 0.0032. In f, SMC1-AID SMC5-AID + auxin versus SMC1-AID SMC5-AID + auxin P < 0.0001, SMC5-AID + auxin versus SMC5-AID + auxin P = 0.0004. Source data
Fig. 3
Fig. 3. Cohesin compacts DSBs flanking chromatin.
a, LacO/LacI–mCherry tags and a TetO/TetR–GFP tag inserted at 7 and 55 kb from the Ho DSB site at the MAT locus, respectively. b, Representative images illustrating spot separation in the presence and absence of DSBs for the experiments quantified in ce. Scale bars, 1 µm. c, Relative frequency of distances between the two tags in SMC1-AID-tagged budded cells treated with ethanol (+Smc1) or auxin (−Smc1). d, Relative frequency of distances between the two tags in nocodazole-arrested SMC1-AID-tagged cells treated with ethanol (+Smc1) or auxin (−Smc1) after 4 h and no DSB. e, Relative frequency of distances measured between the two tags in nocodazole-arrested PDS5-AID-tagged cells treated with ethanol (+Pds5) or auxin (−Pds5) after 4 h or no DSB induction. Shaded areas in ce represent Gaussian fitting (solid line) of n = 3 biological replicates with N ≥ 300 for each strain and condition, and a confidence interval of 95%. P values were calculated on the distance distribution using a two-tailed unpaired Mann–Whitney test. f, Percentage of cells with separated ends in the indicated strains after 4 h DSB induction. Overlaid black dots show the values of independent biological replicates. P values were calculated using a two-tailed unpaired t-test. Data are presented as the mean of more than three independent experiments with N ≥ 150 for each strain and condition (cf). See source numerical data for detailed numbers (*P ≤ 0.05, **P ≤ 0.01, ***P ≤ 0.001, ****P ≤ 0.0001, NS P > 0.05). Numerical P values are presented in Supplementary Table 4. In c, −SMC1 versus +SMC1 P < 0.0001. In d, no DSB + Smc1 versus DSB + Smc1 P < 0.0001, DSB − Smc1 versus DSB + Smc1 P < 0.0001. In e, no DSB + Pds5 versus DSB + Pds5 P < 0.0001, DSB − Pds5 versus DSB + Pds5 P < 0.0001. In f, 4 h SMC1-AID − auxin versus SMC1-AID + auxin P = 0.0033, 4 h PDS5-AID − auxin versus PDS5-AID + auxin P = 0.0022. Source data
Fig. 4
Fig. 4. DSB-ends tethering by MRX or cohesin is sensitive to hexanediol treatment.
a, Schematic representation of the assay to test DSB end-tethering sensitivity to hexanediol (Hex). b, Drop assay of strains plated on YPD after no treatment (NT), 10 min digitonin (D) or 10 min digitonin + hexanediol (D + H) treatment, incubated for 24 and 48 h at 30 °C. c,d, Percentage of cells with separated ends in the indicated strains treated with auxin or ethanol, and for 10 min with digitonin (−) or digitonin and 1,6-hexanediol (+), after 2 h (c) or 4 h (d) DSB induction. Data are presented as the mean of more than three independent experiments with N ≥ 150 for each strain and condition (c,d). See source numerical data for detailed numbers. Overlaid black dots show the values of independent biological replicates. P values were calculated using a two-tailed unpaired t-test (*P ≤ 0.05, **P ≤ 0.01, ***P ≤ 0.001, ****P ≤ 0.0001, NS P > 0.05). Numerical P values are presented in Supplementary Table 4. In c, −Hex + Smc1 versus −Hex + Smc1 P = 0.0027, −Hex − Smc1 versus +Hex − Smc1 P = 0.0170, +Hex mre11Δ + Smc1 versus −Hex mre11Δ − Smc1 P = 0.0004. In d, −Hex + Smc1 versus −Hex + Smc1 P = 0.0027, −Hex − Smc1 versus +Hex − Smc1 P = 0.0170, +Hex mre11Δ + Smc1 versus −Hex mre11Δ − Smc1 P = 0.0004. Source data
Fig. 5
Fig. 5. DSB-ends are tethered by MRX or cohesin oligomerization.
a, Percentage of cells with separated ends in WT, rad50Δ and rad50Δ cells complemented with RAD50 or rad50-lo, after 2 h of DSB induction. b, Model for 2-h cohesin-mediated end-tethering. DSB-ends are primarily tethered by MRX assisted by cohesin-mediated loops. Cohesin tethering is independent of oligomerization and de novo loading. c, Percentage of cells with separated ends in MCD1-AID, and MCD1-AID strains complemented with MCD1 or mcd1Q266, in the absence (−) or presence (+) of auxin, after 2 h of DSB induction. Data are presented as the mean of more than three independent experiments with N ≥ 50 for each strain and condition. See source numerical data for detailed numbers. Overlaid black dots show the value of independent biological replicates. P values were calculated using a two-tailed unpaired t-test. d,e, Relative frequency of distances measured between two tags separated by 45 kb in MCD11-AID-tagged strains complemented with MCD1 (d) or mcd1Q266 (e), treated with ethanol or auxin and nocodazole after 4 h DSB induction. Shaded areas in d and e indicate the 95% confidence intervals of the Gaussian fitting (solid line) of three independent experiments, with N ≥ 300 for each strain and condition. P values were calculated on the distance distribution using a two-tailed unpaired Mann–Whitney test (d,e). f, Percentage of cells with separated ends in MCD1-AID, and MCD1-AID strains complemented with MCD1 or mcd1-Q266, in the absence (−) or presence (+) of auxin, after 4 h of DSB induction. Data are presented as the mean of more than three independent experiments with N ≥ 50 for each strain and condition. See source numerical data for detailed numbers. Overlaid black dots show the value of independent biological replicates. P values were calculated using a two-tailed unpaired t-test. g, Model for 4-h cohesin-mediated end-tethering. Cohesin mediates DSB end-tethering by oligomerization in a MRX-independent but Exo1-, Scc2-, Smc5/6- and Pds5-dependent manner (*P ≤ 0.05, **P ≤ 0.01, ***P ≤ 0.001, ****P ≤ 0.0001, NS P > 0.05). Numerical P values are provided in Supplementary Table 4. In a, WT versus rad50Δ P < 0.0001, rad50Δ versus RAD50 P < 0.0001, rad50Δ versus rad50lo P = 0.0001, RAD50 versus rad50lo P = 0.4411. In c, MCD1-AID − auxin versus MCD1-AID + auxin P = 0.0100. In d, no DSB MCD1 + Mcd1 versus DSB MCD1 + Mcd1 P < 0.0001, no DSB MCD1 + Mcd1 versus DSB MCD1 − Mcd1 P < 0.0001. In e, no DSB mcd1Q + Mcd1 versus DSB mcd1Q + Mcd1 P < 0.0001, no DSB mcd1Q + Mcd1 versus DSB mcd1Q − Mcd1 P < 0.0001. In f, MCD1-AID − auxin versus MCD1-AID + auxin P = 0.0050, MCD1-AID MCD1 + auxin versus MCD1-AID mcd1Q266 + auxin P = 0.0127. Source data
Fig. 6
Fig. 6. Cohesin is required for efficient DNA DSB repair.
a, Schematic representation of repair events after resection and disappearance of the spots followed by resynthesis of one spot. Black and grey arrows show direct repeats used for homologous recombination. b, Sequence of images showing the disappearance of both spots upon resection, and the reappearance of a green spot that is propagated to daughter cells at each division. The time post DSB induction is indicated on each frame. This sequence is representative of the repair events quantified in ch. Scale bar, 1 µm. c, Relative frequency of repair events corresponding to the resynthesis of a spot in rad52Δ, rad51Δ and SMC1-AID strains treated with ethanol (+Smc1) or auxin (−Smc1). Data are presented as means ± s.d. P values were calculated using a two-tailed unpaired t-test. d, Time taken for a spot to reappear, in rad52Δ, rad51Δ and SMC1-AID strains treated with ethanol (+Smc1) or auxin (−Smc1). The red line represents the median, and quartiles are represented by dashed lines. P values were calculated using a two-tailed unpaired Mann–Whitney test. Data are representative of N = 61 (rad52Δ), N = 54 (rad51), N = 77 (+Smc1) and N = 79 (−Smc1) cells from n = 2 independent experiments (c,d). e,f, Spot characteristics of +Smc1 (e) and −Smc1 (f), individual cells imaged every 10 min over 12 h after DNA DSB induction. Lines represent individual cell lineages, and each segment a time point. Colours indicate the presence of both spots (yellow), a red spot only (red), a green spot only (green) or no spots (grey). Data are representative of N = 77 (+Smc1) and N = 79 (−Smc1) cells from n = 2 independent experiments (e,f). g, Relative frequency of repair events corresponding to the resynthesis of a spot in the indicated strains treated with auxin. Cells in G1 phase upon induction were imaged. Data are presented as means ± s.d. P values were calculated using a two-tailed unpaired t-test. h, Time for a spot to reappear in the indicated strains treated with auxin. Cells in G1 phase upon induction were imaged. The red line represents the median, and quartiles are represented by dashed lines. P values were calculated using a two-tailed unpaired Mann–Whitney test. Data are representative of N = 45 (−Cdc45) and N = 47 (−Cdc45 − Smc1) cells from n = 3 (−Cdc45) and n = 2 (−Cdc45 − Smc1) independent experiments (g,h) (*P ≤ 0.05, **P ≤ 0.01, ***P ≤ 0.001, ****P ≤ 0.0001, NS P > 0.05). Numerical P values are provided in Supplementary Table 4. In c, +Smc1 versus −Smc1 P = 0.0224. In d, +Smc1 versus −Smc1 P = 0.0307. In g, −Cdc45 versus −Cdc45 − Smc1 P = 0.0116. In h, −Cdc45 versus −Cdc45 − Smc1 P = 0.0004. Source data
Fig. 7
Fig. 7. Cohesin oligomerization is required for efficient DNA DSB repair.
ae, Spot characteristics in MCD1-AID, and MCD1-AID strains complemented with nothing (c), MCD1 (a,b) or mcd1-Q266 (d,e), in the absence (+Mcd1) or presence (−Mcd1) of auxin for individual cells imaged every 10 min during a period of 12 h after DNA DSB induction. f, Relative frequency of repair events corresponding to the resynthesis of a spot in the indicated strains treated with auxin (+) or ethanol (−). Error bars represent s.d. P values were calculated using a two-tailed unpaired t-test. Data are representative of N = 101 (−Mcd1 + Mcd1WT), N = 76 (+Mcd1 + Mcd1WT), N = 77 (−Mcd1), N = 86 (+Mcd1 + Mcd1Q266) and N = 71 (−Mcd1 + Mcd1Q266) cells from n = 2 independent experiments (af) (*P ≤ 0.05, **P ≤ 0.01, ***P ≤ 0.001, ****P ≤ 0.0001, NS P > 0.05). Numerical P values are provided in Supplementary Table 4. In f, MCD1-AID − auxin versus MCD1-AID + auxin P = 0.0149, MCD1 MCD1-AID − auxin versus MCD1 MCD1-AID + auxin P = 0.6439, mcd1Q266 MCD1-AID − auxin versus mcd1Q266 MCD1-AID + auxin P = 0.0406. Source data
Extended Data Fig. 1
Extended Data Fig. 1. End separation threshold definition and control of DSB efficiency.
a, Measure of DSB efficiency by qPCR detection of the Ho cleavage site in WT cells at 0, 1, 2, 4 and 6 hours after DSB induction. Data are mean ± s.d. of 3 biological replicates. b, Cumulative distance between LacI–mCherry and TetR–GFP signals in exponential WT cells without DNA DSB induction. Red line indicates 400 nm threshold, which 97% of distances are under. Data are mean ± s.d. of 3 biological replicates. c, d, Scatter dot plots of end separation at 2 h and 4 h DSB corresponding to the pool of measurements of biological replicates presented in Fig. 1. Red line at median. Source numerical data are available in Source data. Source data
Extended Data Fig. 2
Extended Data Fig. 2. Auxin induced degradation of target proteins leads to efficient depletion.
ad, anti-myc Western blots showing protein levels of 9myc-AID tagged proteins treated with auxin or ethanol used throughout microscopy DSB end-tethering assays. t-1h (before IAA/EtOH addition), t0h (1 hour IAA/EtOH), t1h (2 hours IAA/EtOH including 1 hour with galactose), t2h (3 hours IAA/EtOH including 2 hours with galactose) and t4h (5 hours IAA/EtOH including 4 hours with galactose). n = 3 biological replicates e, Drop assay of tethering strains on YPD and YPD + auxin, incubated for 48 hours at 30 °C. n = 2 biological replicates. Unprocessed blots are available in source data. Source data
Extended Data Fig. 3
Extended Data Fig. 3. Tethering data dot plots of Fig. 2.
ad, Scatter dot plots of end separation corresponding to the pool of measurements of biological replicates presented in Fig. 2. Red line at median. Source numerical data are available in Source data. Source data
Extended Data Fig. 4
Extended Data Fig. 4. Cdc45 degradation prevents genome duplication whilst allowing cells to proceed to G2/M.
Gating strategy and fluorescent intensity profiles, determined by flow cytometry, showing cell cycle profiles of CDC45-AID and CDC45-AID SMC1-AID strains treated with IAA or EtOH after 4 h DSB induction. For each analysis the FSC/SCC (left panel) was gated to remove cellular debris and the uncolored cells were also removed by gating the FITC/SSC dot plot (middle panel). The FITC-A histogram was then plotted to get the cell cycle profile (right panel). The percentage of cells with 1n (G1) and 2n (S G2) DNA content is indicated for each strain. Percentage of cells with large buds is indicated above intensity profiles as bud index. n = 3 biological replicates. Source data
Extended Data Fig. 5
Extended Data Fig. 5. Smc1 depletion reveals cohesin-dependent Pds5-independent genome compaction in S-M phase cells.
a, Distances between 45 kb separated tags from the three biological replicas for SMC1-AID tagged strain treated with ethanol (+Smc1) or auxin (-Smc1) in Fig. 3c, represented as a violin plot. Red line at median, quartiles represented by dashed line. b, c, Distances between 45 kb separated tags from three biological replicas for SMC1-AID and PDS5-AID tagged strains arrested with nocodazole, treated with ethanol or auxin and following 4 hours DSB in Fig. 3d,e, represented as a violin plot. Red line at median, quartiles represented by dashed line. d, Drop assay of compaction strains plated on YPD and YPD + auxin, incubated for 48 hours at 30 °C. n = 2 biological replicates. e, anti-myc Western blot demonstrating protein levels of PDS5-AID strains treated with auxin or ethanol used throughout microscopy DSB end-tethering assay time course. t-1h (before IAA/EtOH addition), t0h (1 hour IAA/EtOH), t1h (2 hours IAA/EtOH including 1 hour with galactose), t2h (3 hours IAA/EtOH including 2 hours with galactose) and t4h (5 hours IAA/EtOH including 4 hours with galactose). n = 2 biological replicates f, Scatter dot plots of end separation corresponding to the pool of measurements of biological replicates presented in Fig. 3f. Red line at median. P values were calculated using a two-tailed unpaired Mann Whitney test. (*P ≤ 0.05, **P ≤ 0.01, ***P ≤ 0.001, ****P ≤ 0.0001, not significant (ns) P > 0.05). Numerical P values are indicated in Supplementary Information Table 4. (a) no DSB +Smc1 vs no DSB -Smc1 P < 0.0001. (b) no DSB +Smc1 vs 4 h DSB +Smc1 P < 0.0001, 4 h DSB +Smc1 vs 4 h DSB -Smc1 P < 0.0001, no DSB +Smc1 vs 4 h DSB -Smc1 P = 0.0032. (c) no DSB +Pds5 vs no DSB -Pds5 P = 0.0169, no DSB +Pds5 vs 4 h DSB +Pds5 P < 0.0001, no DSB +Pds5 vs 4 h DSB -Pds5 P < 0.0001, 4 h DSB +Pds5 vs 4 h DSB -Pds5 P = 0.0101. Source numerical data and unprocessed blots are available in Source data. Source data
Extended Data Fig. 6
Extended Data Fig. 6. Hexanediol abolishes Rad52 and Mre11-GFP foci and cohesin-dependent tethering in absence of MRX.
ac, Representative images of Rad52-YFP (a) and Mre11-GFP (c) foci at 2 h DSB with no treatment (DSB), or 30 minutes digitonin + hexanediol (DSB Hex) treatment. The images are maximum intensity projections and are representative of cells quantified in bd. Scale bars, 1 µm. bd, Quantification of cells with Rad52-YFP (b) and Mre11-GFP (d) foci at 2 h DSB with no treatment (DSB), or 30 minutes digitonin + hexanediol (DSB Hex) treatment. Data represent the analysis of N = 188 (b, DSB), N = 146 (b, DSB Hex), N = 97 (d, DSB) and 126 (d, DSB Hex) cells. e, f, Scatter dot plots of end separation corresponding to the pool of measurements of biological replicates presented in Fig. 4c,d. Red line at median. Source numerical data are available in Source data. Source data
Extended Data Fig. 7
Extended Data Fig. 7. The rad50lo mutant protein is expressed and proficient for NHEJ.
a, anti-Rad50 western blot showing protein levels in the indicated strains with tubulin as a loading control. n = 2 biological replicate. b, Percentage of cell survival on galactose plate demonstrating NHEJ efficiency in the indicated strains. n = 4 biological replicates c, Scatter dot plots of end separation corresponding to the pool of measurements of biological replicates presented in Fig. 5a. Red line at median. Source numerical data and unprocessed blots are available in Source data. Source data
Extended Data Fig. 8
Extended Data Fig. 8. mcd1Q266 rescues DSB dependent genome compaction in the absence of Mcd1.
a, anti-myc/anti-flag Western blots demonstrating protein levels of AID-myc and mcd1Q266-FLAG tagged proteins treated with auxin or ethanol throughout microscopy DSB end-tethering assays. t-1h (before IAA/EtOH addition), t0h (1 hour IAA/EtOH), t1h (2 hours IAA/EtOH including 1 hour with galactose), t2h (3 hours IAA/EtOH including 2 hours with galactose) and t4h (5 hours IAA/EtOH including 4 hours with galactose). n = 3 biological replicates. b, Drop assay of MCD1 strains on YPD and YPD + auxin, incubated for 72 hours at 23 °C. n = 2 biological replicates. c, Scatter dot plots of end separation corresponding to the pool of measurements of biological replicates presented in Fig. 5c. Red line at median. df, Distances between 45 kb separated tags from three individual replicas for MCD1-AID tagged strains complemented with nothing, MCD1, or mcd1Q266, treated with ethanol or auxin and nocodazole after 4 h DSB, represented as a violin plot. Red line at median, quartiles represented by dashed line. g, Scatter dot plots of end separation corresponding to the pool of measurements of biological replicates presented in Fig. 5f. Red line at median. P values were calculated using a two-tailed unpaired Mann Whitney test. (*P ≤ 0.05, **P ≤ 0.01, ***P ≤ 0.001, ****P ≤ 0.0001, not significant (ns) P > 0.05). Numerical P values are indicated in Supplementary Information Table 4. (d) no DSB +Mcd1 vs 4 h DSB +Mcd1 P < 0.0001, no DSB +Mcd1 vs 4 h DSB -Mcd1 P = 0.0004, 4 h DSB +Mcd1 vs 4 h DSB -Mcd1 P = 0.0012. (e) no DSB MCD1 +Mcd1 vs 4 h DSB MCD1 +Mcd1 P < 0.0001, no DSB MCD1 +Mcd1 vs 4 h DSB MCD1 -Mcd1 P < 0.0001. (f) no DSB mcd1Q266 +Mcd1 vs 4 h DSB mcd1Q266 +Mcd1 P < 0.0001, no DSB MCD1 +Mcd1 vs 4 h DSB MCD1 -Mcd1 P < 0.0001. Source numerical data and unprocessed blots are available in Source data. Source data
Extended Data Fig. 9
Extended Data Fig. 9. Cohesin depletion does not alter rate of resection following DSB.
a, b, Spot characteristics of individual cells inrad52 and rad51 cells during a 12 hour period after DNA DSB induction. Yellow represents presence of red and green spots, red represents presence of red spot only, green represents presence of green spot only, grey represents the presence of no spots, and white represents cell death. Images were acquired every ten minutes at each position on a microfluidic plate. Data represent N = 61 (rad52∆), N = 54 (rad51) cells from n = 2 independent experiments c, Time taken for loss of both red and green spots after DSB induction in microfluidic experiments for SMC1-AID strains shown in Fig. 6e,f. Red line at median, quartiles represented by dashed line. Data represent N = 77 (+Smc1) and N = 79 (-Smc1) cells from n = 2 independent experiments. d, e, Spot characteristics of individual cells in CDC45-AID, CDC45-AID SMC1-AID cells during a 15.5 hour period after DNA DSB induction. DSB was induced in the microfluidic plate, and images were acquired every ten minutes at each position on a microfluidic plate. Data represent N = 45 (-Cdc45) and N = 47 (-Cdc45 -Smc1) cells from n = 3 (-Cdc45) and n = 2 (-Cdc45 -Smc1) independent experiments. f, Time taken for loss of both red and green spots after DSB induction in microfluidic experiments for auxin exposed CDC45-AID and CDC45-AID SMC1-AID strains shown in panels d-e. Red line at median, quartiles represented by dashed line. P values were calculated using a two-tailed unpaired Mann Whitney test. (*P ≤ 0.05, **P ≤ 0.01, ***P ≤ 0.001, ****P ≤ 0.0001, not significant (ns) P > 0.05). Numerical P values are indicated in Supplementary Information Table 4. (c) + Smc1 vs -Smc1 P = 0.5292. (d) -Cdc45 vs -Cdc45 -Smc1 P = 0.0731. Source numerical data are available in Source data. Source data

References

    1. Bordelet, H. & Dubrana, K. Keep moving and stay in a good shape to find your homologous recombination partner. Curr. Genet.65, 29–39 (2019). - PMC - PubMed
    1. Yang, J. H., Brandão, H. B. & Hansen, A. S. DNA double-strand break end synapsis by DNA loop extrusion. Nat. Commun.14, 1913 (2023). - PMC - PubMed
    1. Lobachev, K., Vitriol, E., Stemple, J., Resnick, M. A. & Bloom, K. Chromosome fragmentation after induction of a double-strand break is an active process prevented by the RMX repair complex. Curr. Biol.14, 2107–2112 (2004). - PubMed
    1. Nakai, W., Westmoreland, J., Yeh, E., Bloom, K. & Resnick, M. A. Chromosome integrity at a double-strand break requires exonuclease 1 and MRX. DNA Repair10, 102–110 (2011). - PMC - PubMed
    1. Lee, K., Zhang, Y. & Lee, S. E. Saccharomyces cerevisiae ATM orthologue suppresses break-induced chromosome translocations. Nature454, 543–546 (2008). - PubMed

MeSH terms

LinkOut - more resources