. 2024 Nov 1;14(1):26248.
doi: 10.1038/s41598-024-77665-3.

High-throughput Bronchus-on-a-Chip system for modeling the human bronchus

Affiliations

High-throughput Bronchus-on-a-Chip system for modeling the human bronchus

Akina Mori et al. Sci Rep. .

Abstract

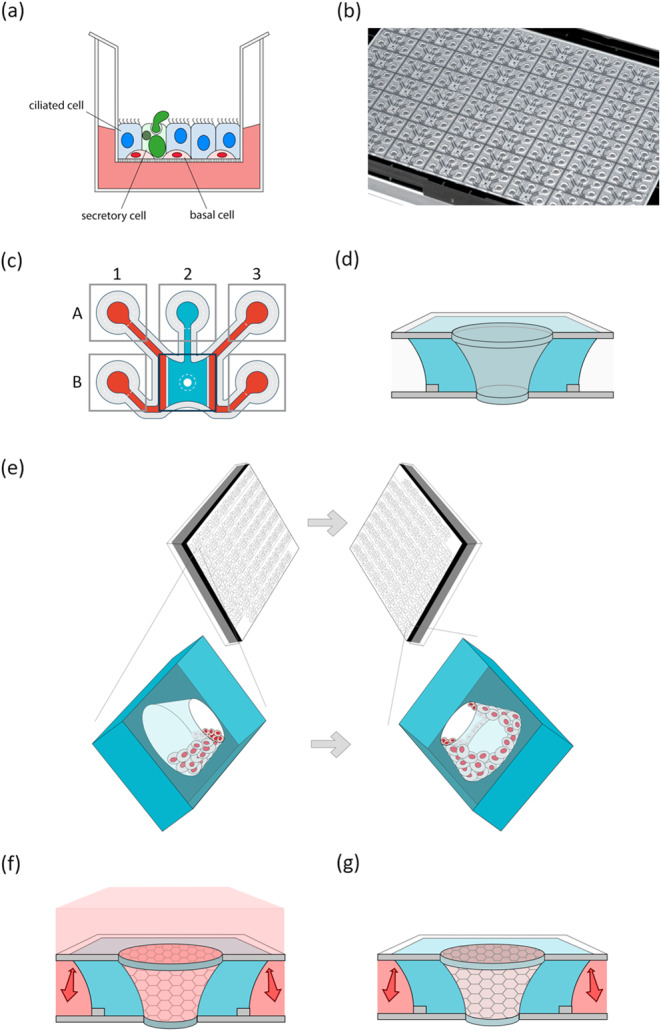
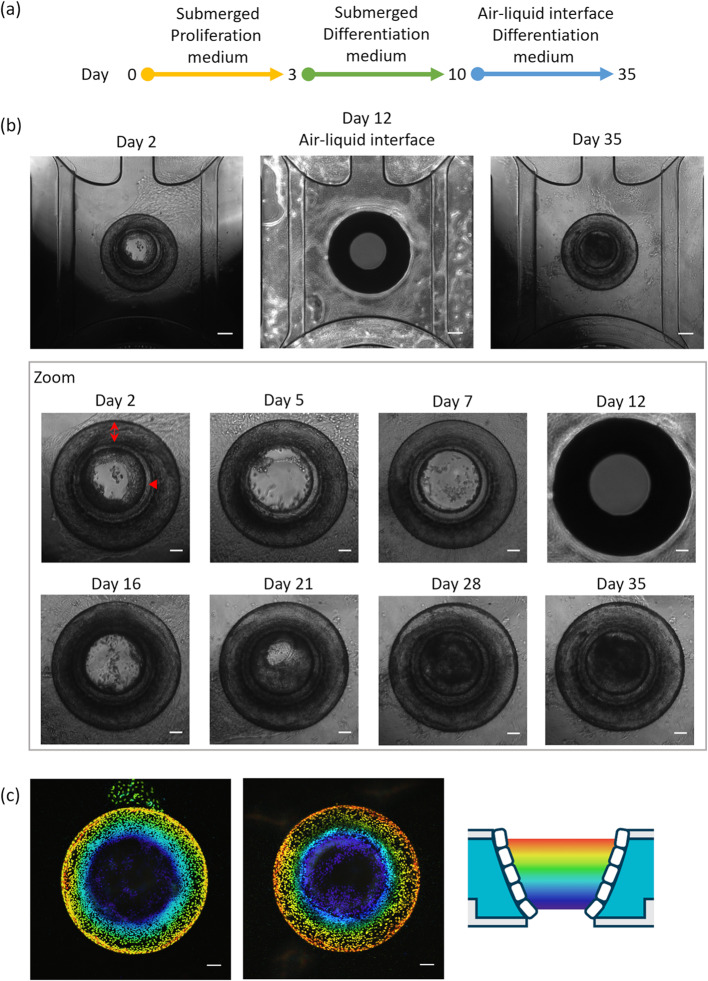
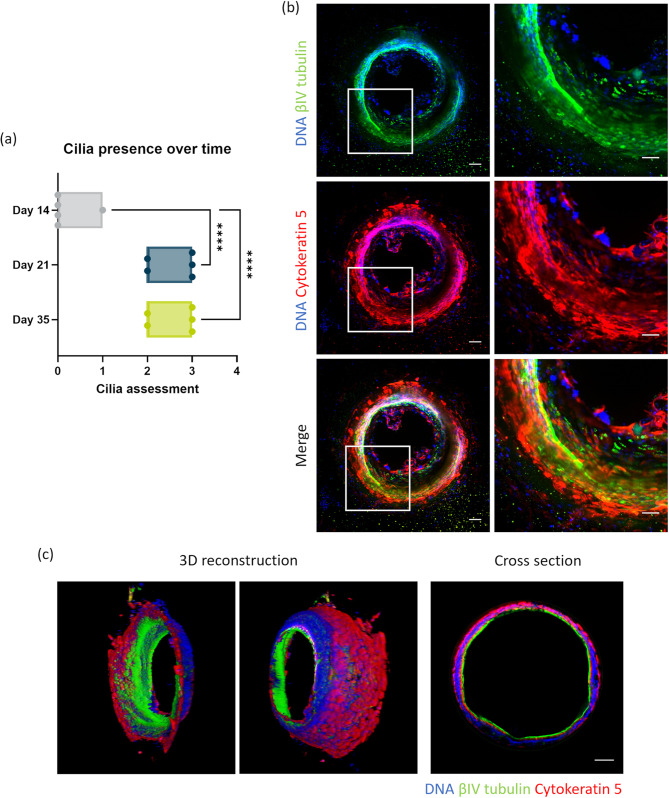
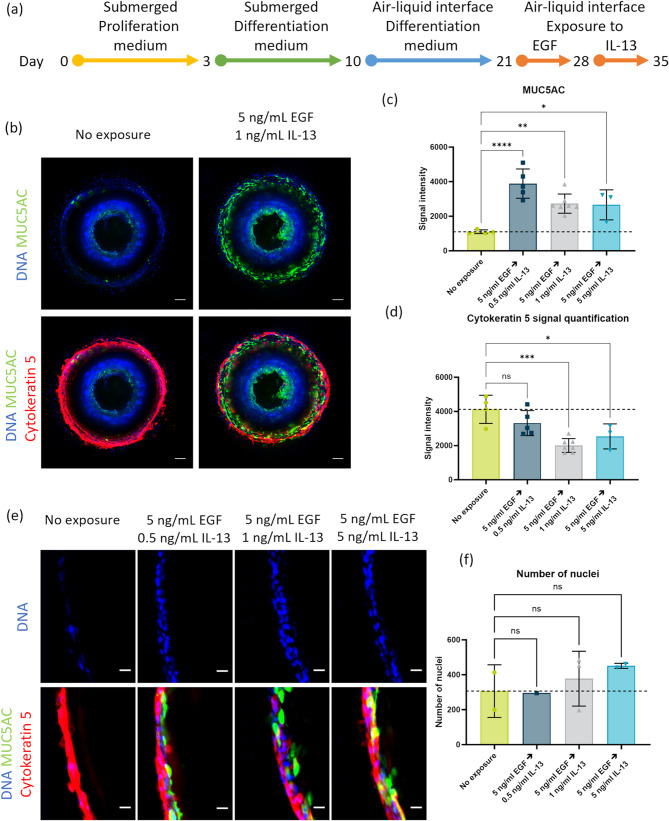
Airway inflammation, a protective response in the human body, can disrupt normal organ function when chronic, as seen in chronic obstructive pulmonary disease (COPD) and asthma. Chronic bronchitis induces goblet cell hyperplasia and metaplasia, obstructing airflow. Traditional animal testing is often replaced by in vitro three-dimensional cultures of human epithelial cells to assess chronic cell responses. However, these cells are cultured horizontally, differing from the tubular structure of the human airway and failing to accurately reproduce airway stenosis. To address this, we developed the Bronchus-on-a-Chip (BoC) system. The BoC uses a novel microfluidic design in a standard laboratory plate, embedding 62 chips in one plate. Human bronchial epithelial cells were cultured against a collagen extracellular matrix for up to 35 days. Characterization included barrier integrity assays, microscopy, and histological examination. Cells successfully cultured in a tubular structure, with the apical side air-lifted. Epithelial cells differentiated into basal, ciliated, and secretory cells, mimicking human bronchial epithelium. Upon exposure to inducers of goblet cell hyperplasia and metaplasia, the BoC system showed mucus hyperproduction, replicating chronic epithelial responses. This BoC system enhances in vitro testing for bronchial inflammation, providing a more human-relevant and high-throughput method.

Keywords: 3D-reconstructed airway epithelial cells; Airway-on-a-chip; Organotypic culture.


Conflict of interest statement

Mimetas B.V. markets the OrganoPlate®. Execution of this work was supported by funding of Japan Tobacco Inc. AM, KM, KO, and SI are employees of Japan Tobacco Inc., and MV, LB, JH, AN, JB, TB, and BK are employees of Mimetas B.V.

Figures

Figure 1
Figure 1
The microfluidic air exposure system OrganoPlate Air. (a) A schematic image of a three-dimensional culture system. The cell layers consist of basal, ciliated, and goblet cells on the membrane in the insert. The apical side is exposed to air. (b) A photograph of the bottom of the OrganoPlate Air, showing microfluidic chips based on a standard 384-well titer plate format. (c) A schematic overview of the chip layout in the OrganoPlate Air, comprising six wells connected by microfluidic channels. Perfusion channel inlets are in A1 and A3, perfusion channel outlets are in B1 and B3, the Gel Inlet is in A2, and the central chamber is in B2. Extracellular matrix (ECM; blue) is loaded into the chip through the gel inlet, and the surface tension of the loaded ECM at the edges (arrowheads) prevents flowing of the ECM into the center hole, leaving the central cylinder in the central chamber empty. The cells can be seeded in this cylindrical lumen, forming a tubular structure. During culture, medium (red) can be added to the perfusion channels and to the central chamber for submerged culture (pink). The air-liquid interface can be initiated by removing medium from the central chamber. The perfusion channels supply the culture with medium, via nutrient diffusion through the ECM in the central chamber.
Figure 2
Figure 2
Bronchus-on-a-Chip culture in the OrganoPlate Air. (a) The experimental timeline of bronchial epithelial cell cultures in the OrganoPlate Air. Cells are seeded in the OrganoPlate Air on day 0, switched to differentiation medium on day 3, and air-liquid interface culture is initiated on day 10. Cultures are maintained up to day 35. (b) Phase-contrast images of cultures over time. For regular imaging, Hanks’ Balanced Salt Solution (HBSS) was added to the central chamber prior to imaging to improve visibility of the culture. Double arrow and arrow head show gel surface and bottom glass respectively. The image on day 12 was taken without HBSS in the central chamber. Scalebars = 200 µm and 100 µm for magnified images. (c) Nuclear staining after fixation on day 35 with color coding for the z location within the chip, as indicated by the schematic. Scalebar = 100 µm.
Figure 3
Figure 3
Differentiated and polarized tubular structure of Bronchus-on-a-Chip. (a) Visual cilia assessment on days 14, 21, and 35 of culture: 0 (no cilia), 1 (small patches), 2 (large patches), and 3 (large areas) categorized by microscopic observation; five replicates for all days. Mean with error bars± SD, statistical test – ordinary one-way ANOVA (**** p < 0.0001). (b) Immunofluorescence images of cells in Bronchus-on-a-Chip on day 35 of culture: 10× maximum projection images of βIV tubulin (green), cytokeratin 5 (red), and DNA (blue) in the left images and a magnification of the framed area in the right images. Scalebars = 100 µm (left images) and 50 µm (right images). (c) Three-dimensional reconstruction images and a cross-section of Bronchus-on-a-Chip showing a polarized tubular structure: βIV tubulin (green), cytokeratin 5 (red), and DNA (blue). Scalebar = 100 µm.
Figure 4
Figure 4
Assessment of barrier function in Bronchus-on-a-Chip. (a) A schematic overview of the barrier integrity assay. Any liquid present in the central chamber is removed (1), fluorescent solution is added to the central chamber (2) and incubated for 15 min prior to a wash (3), and removal of liquid in the central chamber before imaging (4). The extracellular matrix (ECM) area is depicted for signal quantification, excluding the gray area from analysis. (b) Barrier integrity assay images of chips with and without cells on day 21 after applying 150 kDa FITC-Dextran. Scalebar = 100 μm. (c) Quantification of barrier integrity assay by measuring fluorescent intensity of the ECM area of the Bronchus-on-a-Chip, indicated in (a) and (b) as the area between the gray frames. Mean with error bars ± SD, chips with cells (n  = 5); cell-free chips (n  = 2). Statistical test – unpaired two-tailed T-test (** p  < 0.01). (d) Fluorescence images Bronchus-on-a-chip, 10x maximum projection images of ZO-1 (green) and DNA (blue) in the left image and a magnification of the framed area in the right image. Scalebars = 100 μm (left image) and 50 μm (right image).
Figure 5
Figure 5
Increased goblet cell formation after epidermal growth factor (EGF) and interleukin (IL)-13 exposure of Bronchus-on-a-Chip . (a) Timeline of epithelial cell culture and exposure. Culture differentiation up to day 21, followed by 1-week exposure to EGF and 1-week exposure to IL-13. (b) Fluorescence images of Bronchus-on-a-Chip on day 35, after exposure to 5 ng/mL EGF followed by 1 ng/mL IL-13. 10× maximum projection images of MUC5AC (green), cytokeratin 5 (red), and DNA (blue). Scalebar = 100 μm. (c) Quantification of MUC5AC signal intensity after exposure to 5 ng/mL EGF and 0.5–5 ng/mL EGF (3–7 replicates). Mean with error bars ± SD. (d) Quantification of cytokeratin 5 signal intensity after exposure to 5 ng/mL EGF and 0.5–5 ng/mL EGF (3–7 replicates). Mean with error bars ± SD. (e) Magnified fluorescence images of Bronchus-on-a-Chip on day 35 after exposure to 5 ng/mL EGF and 0.5–5 ng/mL IL-13. Cross-section of area against gel, displaying MUC5AC (green), cytokeratin 5 (red), and DNA (blue). Scalebar = 20 μm. (f) Quantification of the number of nuclei in the complete cross-sections of which a magnified image is depicted in (e) (1–3 replicates). Mean with error bars ± SD. Statistical test – ordinary one-way ANOVA (ns = not significant, * p  < 0.05, ** p  < 0.01, *** p < 0.001 , **** p < 0.0001).

References

    1. ICRP, Annals of the ICRP. Human Respiratory Tract Model for Radiological Protection, ed. I.P. 66. Vol. 24. (1994). - PubMed
    1. Livraghi, A. & Randell, S. H. Cystic fibrosis and other respiratory diseases of impaired mucus clearance. Toxicol. Pathol.35 (1), 116–129 (2007). - PubMed
    1. Crystal, R. G. et al. Airway epithelial cells: current concepts and challenges. Proc. Am. Thorac. Soc.5 (7), 772–777 (2008). - PMC - PubMed
    1. Aghasafari, P., George, U. & Pidaparti, R. A review of inflammatory mechanism in airway diseases. Inflamm. Res.68 (1), 59–74 (2019). - PubMed
    1. LARSEN, G. L. & HOLT, P. G. The Concept of Airway inflammation. Am. J. Respir. Crit Care Med.162 (supplement_1), S2–S6 (2000). - PubMed

LinkOut - more resources