. 2024 Oct 31;14(1):26239.
doi: 10.1038/s41598-024-77032-2.

Flavopiridol induces cell cycle arrest and apoptosis by interfering with CDK1 signaling pathway in human ovarian granulosa cells

Affiliations

Flavopiridol induces cell cycle arrest and apoptosis by interfering with CDK1 signaling pathway in human ovarian granulosa cells

Xiao-Zhen Li et al. Sci Rep. .

Abstract

Several clinical trials have been conducted to evaluate the use of flavopiridol (FP) to treat a variety of cancers, and almost all cancer drugs were found to be associated with toxicity and side effects. It is not clear whether the use of FP will affect the female reproductive system. Granulosa cells, as the important cells that constitute the follicle, play a crucial role in determining the reproductive ability of females. In this study, we investigated whether different concentrations of FP have a toxic effect on the growth of immortalized human ovarian granulosa cells. The results showed that FP had an inhibitory effect on cell proliferation at a level of nanomole concentration. FP reduced cell proliferation and induced apoptosis by inducing mitochondrial dysfunction and oxidative stress, as well as increasing BAX/BCL2 and pCDK1 levels. These results suggest that toxicity to the reproductive system should be considered when FP is used in clinical applications.

Keywords: Apoptosis; Cell cycle arrest; Flavopiridol; Human ovarian granulosa cells; Oxidative stress.


Conflict of interest statement

The authors declare no competing interests.

Figures

Fig. 1
Fig. 1
FP inhibits SVOG cell growth and viability. (A) The typical images of SVOG cells exposed to various concentrations of FP for 24 h. Scale: 100 μm. (B) The relative viability of SVOG cells after FP treatment was revealed by CCK8 assay measuring the OD 450 nM. ns P > 0.05, *P < 0.05, ****P < 0.0001.
Fig. 2
Fig. 2
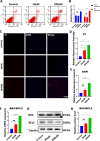
FP exposure triggers apoptosis of SVOG cells. (A) The typical images of flow cytometry detection of cell apoptosis by Annexin V/PI staining after SVOG cells were treated with different concentrations of FP for 24 h. (B) The proportion of cells in early apoptosis and late apoptosis. ns P > 0.05, *P < 0.05, **P < 0.01. (C) SVOG cells incubated with 0 nM, 50 nM or 200 nM FP for 24 h and stained with DAPI (blue)/PI (red) double-staining assay. Scale: 100 μm. (D) Fluorescence intensity analysis of PI staining levels of SVOG cells. ns P > 0.05, *P < 0.05, **P < 0.01. (E) Fluorescence intensity analysis of DAPI staining levels of SVOG cells. ns P > 0.05, **P < 0.01. (F) The relative mRNA expression levels of apoptosis-associated genes (BAX/BCL2), normalized by that of the housekeeping gene as the internal control. ns P > 0.05, ****P < 0.0001. (G) Western blot of apoptosis-associated proteins (BAX and BCL2) after treatment with different concentrations of FP for 24 h. (H) The expression level of proteins related to apoptosis in each group. ns P > 0.05, *P < 0.05.
Fig. 3
Fig. 3
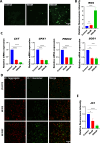
FP exposure increases ROS level and mitochondrial damage of SVOG cells. (A) Effects of different concentrations of FP exposure on intracellular ROS levels in SVOG cells, assayed with a DCFH-DA probe. Scale: 100 μm. (B) Fluorescence intensity analysis of DCFH-DA probe staining levels of SVOG cells. The control group was designated as 1, to evaluate the relative fluorescence intensity in other groups. **P < 0.01, ***P < 0.001. (C) The relative mRNA expression levels of antioxidative genes (GPX1, PRDX2, CAT, and SOD2), normalized by that of the housekeeping gene as the internal control. **P < 0.01, ***P < 0.001, ****P < 0.0001. (D) Representative images of MMP after treatment with different concentrations of FP for 24 h, as revealed by JC-1 staining (red: JC-1 aggregate signal, green: JC-1 monomer signal). Scale: 100 μm. (E) The ratios of red fluorescence intensities to green fluorescence intensities after exposure to different concentrations of FP for 24 h. *P < 0.05, ****P < 0.0001.
Fig. 4
Fig. 4
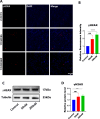
FP exposure increases DNA damage of SVOG cells. (A) The typical images with γH2AX (red) and DAPI (blue) staining levels of SVOG cells. Scale: 100 μm. (B) Fluorescence intensity analysis of γH2AX staining levels of SVOG cells. ns P > 0.05, ****P < 0.0001. (C) Western blot of γH2AX protein in cells exposed to different concentrations of FP for 24 h. (D) The expression level of γH2AX protein in each group. ns P > 0.05, **P < 0.01.
Fig. 5
Fig. 5
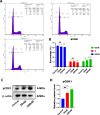
FP arrests the cell cycle at the G2/M phases. (A) Representative flow cytometry diagram for cell cycle detection after treatment with FP. (B) Analysis of cell cycle ratio after FP treatment by flow cytometry. ns P>0.05, *P < 0.05, **P < 0.01, ****P < 0.0001 (C) Western blot of pCDK1 protein in cell exposed to different concentrations of FP for 24 h. (D) The expression level of pCDK1 protein in each group. ns P > 0.05, **P < 0.01.

Similar articles

Cited by

References

    1. Da Broi, M. G. et al. Influence of follicular fluid and cumulus cells on oocyte quality: Clinical implications. J. Assist. Reprod. Genet.35, 735–751. 10.1007/s10815-018-1143-3 (2018). - PMC - PubMed
    1. Albertini, D. F. A cell for every season: The ovarian granulosa cell. J. Assist. Reprod. Genet.28, 877–878. 10.1007/s10815-011-9648-z (2011). - PMC - PubMed
    1. Albertini, D. F., Combelles, C. M., Benecchi, E. & Carabatsos, M. J. Cellular basis for paracrine regulation of ovarian follicle development. Reproduction121, 647–653. 10.1530/rep.0.1210647 (2001). - PubMed
    1. Da Silva-Buttkus, P. et al. Effect of cell shape and packing density on granulosa cell proliferation and formation of multiple layers during early follicle development in the ovary. J. Cell Sci.121, 3890–3900. 10.1242/jcs.036400 (2008). - PubMed
    1. Turathum, B., Gao, E. M. & Chian, R. C. The function of cumulus cells in oocyte growth and maturation and in subsequent ovulation and fertilization. Cells10. 10.3390/cells10092292 (2021). - PMC - PubMed

MeSH terms

LinkOut - more resources