. 2024 Dec;21(12):2327-2335.
doi: 10.1038/s41592-024-02478-1. Epub 2024 Oct 31.

Proteome-scale recombinant standards and a robust high-speed search engine to advance cross-linking MS-based interactomics

Affiliations

Proteome-scale recombinant standards and a robust high-speed search engine to advance cross-linking MS-based interactomics

Milan Avila Clasen et al. Nat Methods. 2024 Dec.

Abstract

Advancing data analysis tools for proteome-wide cross-linking mass spectrometry (XL-MS) requires ground-truth standards that mimic biological complexity. Here we develop well-controlled XL-MS standards comprising hundreds of recombinant proteins that are systematically mixed for cross-linking. We use one standard dataset to guide the development of Scout, a search engine for XL-MS with MS-cleavable cross-linkers. Using other, independent standard datasets and published datasets, we benchmark the performance of Scout and existing XL-MS software. We find that Scout offers an excellent combination of speed, sensitivity and false discovery rate control. The results illustrate how our large recombinant standard can support the development of XL-MS analysis tools and evaluation of XL-MS results.


Conflict of interest statement

Competing interests: F.L. is a shareholder and advisory board member of Absea Biotechnology Ltd and VantAI. T.C. is the co-founder of Absea Biotechnology Ltd. S.W. is an employee of Absea Biotechnology Ltd. The remaining authors declare no competing interests.

Figures

Fig. 1
Fig. 1. Schematic workflow of the construction of the XL-MS standard.
Proteins were allocated into 32 interaction groups with 8 proteins each. Within the interaction groups, proteins were cross-linked pairwise in all possible combinations, resulting in 28 PPIs per interaction group and 896 PPIs in total. All cross-linked samples were merged before digestion. Created with BioRender.com.
Fig. 2
Fig. 2. Schematic representation of the cross-link identification workflow employed by Scout.
Scout requires mass spectrometry raw data (MS2 spectra) and a protein sequence database as input. Cross-links are identified in two search steps—ion pair doublet searching and fast CSM searching—which are both described in Supplementary Note 1. The shortlisted peptide pair candidates for each MS2 spectrum are then subjected to refined spectrum scoring based on a set of sensitive quality metrics described in Supplementary Note 2. Finally, the results are filtered according to a user-defined FDR using a machine learning-based discriminant function at each tier of identification: CSMs, ResPairs and PPIs (Supplementary Note 3). The final output is presented through a graphical user interface (GUI), providing a user-friendly display of the identified cross-linked peptides and their associated metrics.
Fig. 3
Fig. 3. Benchmarking Scout against other XL-MS search engines for interlink identifications.
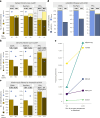
Number of identified interprotein CSMs, ResPairs and PPIs and the empirically determined FDR at a software-defined 1% FDR cutoff using a 540-protein or 4,000-protein database and identical search parameters, including K as the only cross-linking site. Framed bars mark post hoc aggregated results, that is, cases when CSMs were aggregated to unique ResPairs or unique ResPairs to unique PPIs because search engines do not control FDR at these levels (MeroX and MaxLynx do not report FDR-controlled ResPairs; MeroX, MaxLynx, MSAnnika do not report FDR-controlled PPIs). Blue bars show true-positive identifications, yellow bars show false-positive identifications, violating the mixing scheme of our XL-MS standard. Source data
Fig. 4
Fig. 4. Benchmarking of XlinkX PD, xiSEARCH/xiFDR and software processing times.
ac, Interprotein CSMs, ResPairs and PPI identifications when comparing Scout and XlinkX PD. True-positive identifications by XlinkX PD are shown in light brown (540-protein database) and dark brown (4,000-protein database). The Scout numbers (blue diamonds) are the same as in Fig. 3. In addition to using our standard search parameters, XlinkX PD identification were postprocessed using a static score cutoff (‘default’) (a), score cutoffs derived from the highest scoring CSM-level decoy in every analysis (‘dynamic’) (b) and score cutoffs set to filter XlinkX PD results to 1% empirical FDR (c). The XlinkX score cutoffs are displayed below the bars. Both Scout and XlinkX PD considered K as the only cross-linking site. d, Interprotein CSMs, ResPairs and PPI identifications when comparing Scout and xiSEARCH. For Scout, results were filtered at 1% software-defined FDR on all levels. For xiSEARCH/xiFDR, following the developer’s recommendation, a 1% software-defined FDR was applied only on the PPI level using boost between proteins (xiFDR) and reported are the resulting PPIs together with their corresponding CSMs and ResPairs. Scout and xiSEARCH were run using their default parameters, respectively, with KSTY as the possible reaction sites for the cross-linking reagent. In ad, the framed percentage numbers indicate the final empirical FDR and yellow bars show false-positive identifications, violating the mixing scheme of our XL-MS standard. e, Processing time in minutes (min) using different search engines on the benchmarking dataset with a 1% software-defined FDR cutoff on a computer with 512 GB RAM and powered by dual Intel(R) Xeon(R) Gold 6136 CPUs operating at 3.00 GHz. xiSEARCH/xiFDR did not run to completion on this hardware setup when using the full benchmarking dataset. Therefore, a separate Scout versus xi speed comparison using only four RAW files was performed and is shown in Extended Data Fig. 3b. Source data
Fig. 5
Fig. 5. Performance of Scout on published XL-MS benchmarking datasets from Matzinger et al. using synthetic peptides and Lenz et al. using fractionated E. coli lysate.
a, Overlap of ResPairs identified by Scout and MSAnnika and the true FDR of Scout-specific (left), shared (middle) and MSAnnika-specific (right) identifications using the DSSO main library from Matzinger et al. and our standard search parameters, which are similar to the ones reported in the original publication. b, Scout’s true-positive (blue) and false-positive (yellow) ResPair-level identifications from the DSSO main library spiked 1:5 into tryptic HEK peptides when searched on increasingly large databases. The software-defined FDR cutoff was set to 1%; empirical FDR and operating times are indicated above the bars. c, Overlap of PPI-level identifications from Scout (left) and xiSEARCH (right) using the PPI benchmarking dataset by Lenz et al. and a 1% separate software-defined FDR cutoff on the PPI level. Scout was operated with standard parameters and xiSEARCH identifications were retrieved from the original publication. Empirical FDR was determined using the procedure suggested in the original publication. d, Performance of Scout and xiSEARCH in identifying intra- and interprotein CSMs, interprotein CSMs only, interprotein PepPairs (peptide pairs) and PPIs when setting an all-level software-defined FDR cutoff of 1%. Scout was operated with standard parameters and xiSEARCH identifications were retrieved from the original publication. The empirical FDR was calculated as described by Lenz et al. and is indicated above the bars. Source data
Fig. 6
Fig. 6. Application of Scout and MSAnnika to biological proteome-wide XL-MS datasets.
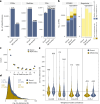
a, Entrapment database search on a published dataset of Azide-A-DSBSO cross-linked human mitochondria. The data were searched against 2,000 random human mitochondria proteins sampled from a linear peptide search on the XL-MS data, supplemented with 2,000 random E. coli BL21 protein sequences. Interspecies cross-links and E. coli cross-links were considered false. Percentages indicate the resulting empirical FDR. b, Evaluation of PPIs identified from a HEK cell Azide-A-DSBSO XL-MS dataset. Brown, light blue and dark blue correspond to different STRING confidence score ranges. Yellow represents identifications that could not be found in STRING or that are considered impossible because they match to the Negatome database. In a and b, PPI-level results for Scout were either determined using the PPI-FDR filter (Scout) or by aggregation of ResPairs to unique protein pairs (Scout*). The second approach was also used for MSAnnika. c, ResPair interlinks per PPIs identified with MSAnnika and PPI-FDR-controlled Scout on the Azide-A-DSBSO HEK dataset. d,e, Cα–Cα distances of ResPair interlinks identified by Scout (blue) and MSAnnika (brown) when mapped on AlphaFold-Multimer models of their identified PPIs. For each PPI, the model with the highest cross-link satisfaction was used for analysis. Shown are all interlink Cα–Cα distances that can be mapped on AlphaFold-Multimer models with a model confidence of at least 0.5 (d), as well as the spread of interlink Cα–Cα distances for different ranges of AlphaFold-Multimer model confidence (e). In both cases, only interlinks between residues with a pLDDT score above 50 (indicating an ordered protein region) are considered. Boxes in e range from first to third quartile with the median indicated as a horizontal line. Whiskers represent 1.5 times the interquartile range. The violin plot shows that full data distribution, including minima and maxima. Source data
Extended Data Fig. 1
Extended Data Fig. 1. Expected fraction of false in-group ResPair cross-links in the XL-MS datasets derived from our recombinant analytical standard.
The results are based on a mathematical simulation approach we recently developed. We considered the 2 database sizes used for our comparison of XL-MS search engines and 3 FDR cut-offs (determined by target-decoy competition in Scout). The bars show the percentage of false ResPair intra-links and inter-links that are expected within the same interaction group, that is cross-links that would be wrongly annotated when defining true-positive hits based on our mixing scheme. Shown are the average +/− SD from 10 simulations with identical input parameters. Source data
Extended Data Fig. 2
Extended Data Fig. 2. Benchmarking Scout against other XL-MS search engines for intra-link identifications.
Number of identified intra-linked CSMs, ResPairs and intra-linked proteins and the empirical FDR using a small (540 proteins, upper panel) or large database (4,000 proteins, lower panel). Framed bars mark post-hoc aggregated results, that is when CSMs were aggregated to unique ResPairs or unique ResPairs to unique intra-linked proteins, in case these levels were not directly reported by the software. XlinkX results were obtained with default settings (see Methods) and no further post-processing. The blue bar shows true positive, the yellow bar false positive identifications from which the empirical FDR (shown above the bars) was calculated. Source data
Extended Data Fig. 3
Extended Data Fig. 3. Benchmarking of Scout against xiSEARCH/xiFDR.
(a) Inter-protein CSM, ResPairs and PPI identifications at 5% naïve PPI-FDR and empirically determined FDR using Scout and xiSEARCH (both with default parameters, xiFDR with boost between proteins) on a subset of the benchmarking dataset using a 540-protein database and KSTY as possible reaction sites for the cross-linking reagent. (b) Processing time of Scout and xiSEARCH on four selected RAW files of the benchmarking dataset on the same computational setup using a 540-protein database. Source data
Extended Data Fig. 4
Extended Data Fig. 4. Search space-dependent performance of Scout.
(a) Number of inter-protein CSMs, ResPairs and PPIs identified by Scout using standard parameters and all-level 1% naïve FDR cutoff on the benchmarking dataset with increasing database size. True positives shown in blue, false positives in yellow. Empirical FDR is indicated above the bars. (b) Processing time of Scout when searching the benchmarking data against increasingly large databases. Source data

References

    1. Graziadei, A. & Rappsilber, J. Leveraging crosslinking mass spectrometry in structural and cell biology. Structure30, 37–54 (2022). - PubMed
    1. Liu, F., Rijkers, D. T., Post, H. & Heck, A. J. Proteome-wide profiling of protein assemblies by cross-linking mass spectrometry. Nat. Methods12, 1179–1184 (2015). - PubMed
    1. Lima, D. B. et al. SIM-XL: a powerful and user-friendly tool for peptide cross-linking analysis. J. Proteom.129, 51–55 (2015). - PubMed
    1. Pirklbauer, G. J. et al. MS Annika: a new cross-linking search engine. J. Proteome Res.20, 2560–2569 (2021). - PMC - PubMed
    1. Matzinger, M. & Mechtler, K. Cleavable cross-linkers and mass spectrometry for the ultimate task of profiling protein–protein interaction networks in vivo. J. Proteome Res.20, 78–93 (2021). - PMC - PubMed

LinkOut - more resources