. 2024 Dec;25(12):5810-5837.
doi: 10.1038/s44319-024-00299-z. Epub 2024 Oct 31.

The 24-hour molecular landscape after exercise in humans reveals MYC is sufficient for muscle growth

Affiliations

The 24-hour molecular landscape after exercise in humans reveals MYC is sufficient for muscle growth

Sebastian Edman et al. EMBO Rep. 2024 Dec.

Abstract

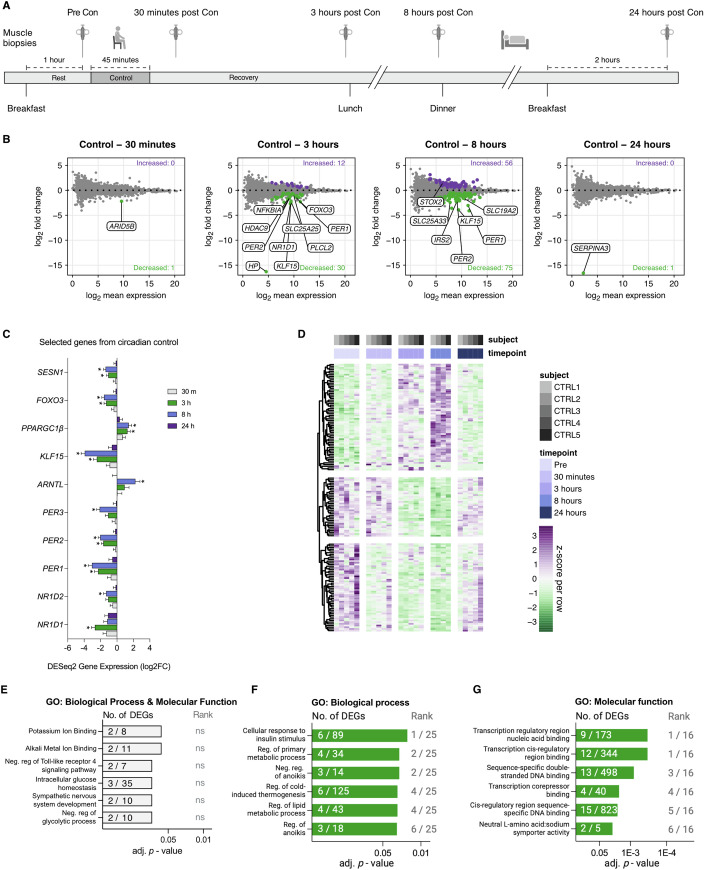
A detailed understanding of molecular responses to a hypertrophic stimulus in skeletal muscle leads to therapeutic advances aimed at promoting muscle mass. To decode the molecular factors regulating skeletal muscle mass, we utilized a 24-h time course of human muscle biopsies after a bout of resistance exercise. Our findings indicate: (1) the DNA methylome response at 30 min corresponds to upregulated genes at 3 h, (2) a burst of translation- and transcription-initiation factor-coding transcripts occurs between 3 and 8 h, (3) changes to global protein-coding gene expression peaks at 8 h, (4) ribosome-related genes dominate the mRNA landscape between 8 and 24 h, (5) methylation-regulated MYC is a highly influential transcription factor throughout recovery. To test whether MYC is sufficient for hypertrophy, we periodically pulse MYC in skeletal muscle over 4 weeks. Transient MYC increases muscle mass and fiber size in the soleus of adult mice. We present a temporally resolved resource for understanding molecular adaptations to resistance exercise in muscle ( http://data.myoanalytics.com ) and suggest that controlled MYC doses influence the exercise-related hypertrophic transcriptional landscape.

Keywords: Biopsy; Methylome; Time Course; Transcription Factors; Transcriptome.


Conflict of interest statement

Disclosure and competing interests statement. YW is the founder of MyoAnalytics LLC. The authors have no other conflicts to declare.

Figures

Figure 1
Figure 1. Gene expression patterns for biopsy-only control time course.
(A) Schematic overview for the control arm of the human intervention, n = 5. (B) MA plots showing differentially expressed genes (DEG) vs pre-values, time matched to 30 min, 3, 8, & 24 h of recovery in the resistance exercise trial (see Fig. 2A). Purple and green dots indicate up- or downregulated regulated genes (adj. p < 0.05), respectively. Top genes for adj. p-value are highlighted in plots. (C) Fold-change for targeted DEGs in the control group, n = 5. *adj. p < 0.05. Values represent log2 fold-change ± SEM. SESN1 p = 0.0034 at 3 h, p = 8.7E−6 at 8 h, FOXO3 adj. p = 0.0004 at 3 h, adj. p = 7.7E−6 at 8 h, PPARGC1B adj. p = 0.0486 at 3 h, adj. p = 0.0110 at 8 h, KLF5 adj. p = 1.0E−5 at 3 h, adj. p = 3.5E−14 at 8 h, ARNTL adj. p = 0.0120 at 8 h, PER3 adj. p = 7.8E−6 at 8 h, PER2 adj. p = 6.8E−9 at 3 h, adj. p = 7.3E−13 at 8 h, PER1 adj. p = 8.3E−5 at 3 h, adj. p = 3.0E−8 at 8 h, NR1D2 adj. p = 0.0058 at 8 h, NR1D1 p = 1.1E−7 at 3 h. (D) Heatmap showing z-scores for 60 up-, and 90 downregulated DEGs across all time points and volunteers in the control trial. (E, F) Gene ontology (GO) gene set enrichment analysis on DEGs across the entire 24-h control period. Numbers within the bars indicate the proportion of DEGs in our dataset corresponding to the specific gene set. Rank values indicate the specific gene sets adj. p-value rank. (E) Upregulated Biological Processes and Molecular Functions, (F) Downregulated Biological Functions, (G) Downregulated Molecular Functions. (B, C) DESeq2 was calculated using a Wald test with a Benjamini–Hochberg p-value correction. (EG) Gene ontology (GO) gene set enrichment analysis is analyzed using a Fisher exact test with Benjamini–Hochberg p-value correction. Con control situation, ns not significant, Neg. negative, Reg. regulation. Source data are available online for this figure.
Figure 2
Figure 2. Gene expression patterns during 24 h of recovery from resistance exercise.
(A) Schematic overview of resistance exercise (RE) intervention, n = 8. (B) MA plots showing differentially expressed genes (DEG) vs resting pre-values, following 30 min, 3, 8, & 24 h of recovery from RE (adj. p < 0.05). DESeq2 was calculated using a Wald test with a Benjamini–Hochberg p-value correction. Red and blue dots indicate up- or downregulated regulated genes (adj. p < 0.05), respectively. Top 10 genes for adj. p-value are highlighted in plots. (C) Normalized counts for targeted genes across the 24-h intervention, n = 8. Values represent normalized counts ± SEM. Red dots = RE trial, gray dots = Control trial. (D) Heatmap showing z-scores for 2399 up-, and 2126 downregulated DEGs across all recovery time points and volunteers in the RE trial. Genes are clustered according to their expression pattern across time points within the 24-h recovery period. (BD) DESeq2 was calculated using a Wald test with a Benjamini–Hochberg p-value correction.
Figure 3
Figure 3. Gene set enrichment time course across 24 h of recovery from resistance exercise.
(AC) Gene ontology (GO) gene set enrichment analysis on DEGs across the entire 24-h recovery period. Numbers within the bars indicate the proportion of DEGs in our dataset corresponding to the specific gene set. Rank values indicate the specific gene sets adj. p-value rank. The corresponding timeline shows the proportion of DEGs with the specific gene sets across the 24-h recovery period. (A) Upregulated Biological Processes, (B) Upregulated Molecular function, and (C) Downregulated Biological Processes and Molecular function. (DF) Timelines of the top (GO) gene sets from (AC) expressed as a percentage of the number of DEGs within that gene set. (D) Upregulated Biological Processes, (E) Upregulated Molecular function, and (F) Downregulated Biological Processes and Molecular function. (GI) Average fold-change (vs Pre) for highlighted gene sets (thick red lines) along individual DEGs within the specific gene set (lighter red lines). The average fold-change for the same genes in the control situation is presented in gray. (G) Upregulated Biological Processes, (H) Upregulated Molecular function, (I) Downregulated Biological Processes and Molecular Function. (AC) Gene ontology (GO) gene set enrichment analysis is analyzed using a Fisher exact test with Benjamini–Hochberg p-value correction. Source data are available online for this figure.
Figure 4
Figure 4. Immediate (30 min post-RE) DNA methylome changes after RE predict transcriptional regulation at 3 h.
(A) Binding and expression target analysis (BETA) combining the DNA methylome at 30 min to differentially expressed genes (DEGs) at 3 h post resistance exercise (RE). BETA integration analysis of up- and downregulated genes to RRBS methylation performed relative to background with predictive interaction significance represented by p-values in parenthesis. (B) Selection of upregulated differentially expressed genes (DEGs) at 3 h post-RE significantly predicted by the methylome at 30 min. (C) Chord plot illustrating the top five biological processes (gene ontology) regulated at 3 h post exercise by genes predicted by the methylome at 30 min post exercise. Gene set-associated genes are ordered according to their p-values. (D) Selection of downregulated DEGs at 3 h post RE suggested being affected by methylation changes at 30 min post RE. (AD) was calculated using a one-tailed Kolmogorov–Smirnov test, while Gene ontology (GO) gene set enrichment analysis for (C) was analyzed using a Fisher exact test with Benjamini–Hochberg p-value correction. Source data are available online for this figure.
Figure 5
Figure 5. The transcription factor MYC dominates late-stage acute recovery from RE by regulating ribosome biogenesis.
(A) Transcription factors predicted to be active during the 24-h recovery period from resistance exercise (RE) sorted by p-value. (B) Transcription factors predicted to regulate the genes expressed exclusively at the later stages of acute recovery. (C) Comparison of upregulated DEGs across 24 h of RE recovery in humans (n = 8) vs soleus muscle from MYC-overexpressing mice from Jones et al (2022). (DF) The top five gene sets (GO: Biological Processes) based on DEGs in (D) the human exclusive gene list, (E) MYC mouse exclusive gene list, and (F) overlapping gene list, respectively. Gene sets are ranked according to their adj. p-values. (G) Heatmap showing DEG pattern for ribosome-related genes overlapping human RE response to a MYC response in mouse soleus muscle. Genes retrieved from all five gene sets presented in 3F. (H) Time courses for MYC’s transcriptional influence (Red solid line), as well as three MYC-regulated gene sets (dashed lines). (A, B) Is analyzed with epigenetic Landscape In Silico deletion Analysis (Lisa) using a one-sided Wilcoxon rank-sum test. (DF) Gene ontology (GO) gene set enrichment analysis is analyzed using a Fisher exact test with Benjamini–Hochberg p-value correction. Source data are available online for this figure.
Figure 6
Figure 6. Four weeks of pulsed MYC induction is sufficient to elicit muscle fiber type specific hypertrophy.
(A) Graphical representation of the experimental design. (B) Soleus (p = 7.1E−6 vs Con), Gastrocnemius (Gastroc; p = 0.0136 vs Con, p = 0.0254 vs Soleus), Tibialis anterior (TA; p = 0.0422 vs Con, p = 0.0048 vs Soleus), and Plantaris (Plant; p = 1.0E−5 vs Con) muscle probed for MYC after 48 h of doxycycline administration. + = HSA-MYC (n = 6), − = HSA Control (n = 3). (C) Soleus muscle weight of HSA Control and HSA MYC mice after 5 bolus exposures over 4 weeks (p = 0.0200 vs Con). (D) Soleus muscle wet weight normalized to body weight (p = 0.0014 vs Con). (E) Hindlimb muscle weight of plantaris, Gastroc, extensor digitorum longus (EDL), TA, and quadriceps (Quad.) normalized to body weight. (F) Body weight of mice. (CF) n = 7 HSA Control, n = 9 HSA-MYC. (G) Representative images of MyHC I (purple) and MyHC II (black) muscle fiber size in HSA Control (left) and HSA-MYC (right) mice. Dystrophin is outlining fiber borders (red). Scale bar is 100 μm. (H) Total number of fibers per soleus muscle. (I) Distribution of MyHC I and MyHC II fibers expressed as a percentage. (J) Cross sectional area of MyHC I (p = 0.0433 vs Con) and MyHC II fibers, and their combined average. (KM) Frequency distribution plot for average CSA (K; p = 0.0486 at 1001–1500 μm range vs Con) and fiber type size of MyHC I (L; p = 0.0171 at 1001–1500 μm range vs Con) and MyHC II (M) fibers. (GM) n = 4 HSA Control, n = 6 HSA-MYC. Dots are biological replicates. (BF, HJ) Values represent mean ± SEM. (KM) The box represents the 25th–75th percentile, the line represents the median, and the whiskers represent Min to Max. *p < 0.05 vs control, #p < 0.05 vs soleus. Analyzed using Two-way ANOVA with Bonferroni posthoc (B) or Fisher’s LSD (KM), Welch’s T-test (CJ). MyHC myosin heavy chain, CSA cross sectional area. Source data are available online for this figure.
Figure EV1
Figure EV1. Cell composition of muscle biopsies through data deconvolution.
Cell composition of all skeletal muscle biopsy time points excluding “myocytes” (CTRL n = 5, RE n = 8). The box represents the 25th–75th percentile, the line represents the median, and the whiskers represent Min to Max, excluding outliers. SC satellite cell, CTRL control group, RE resistance exercise group.
Figure EV2
Figure EV2. Targeted gene set enrichment analysis.
Pooled gene ontology (GO) biological processes and molecular function gene sets. (A) Targeted analysis of gene sets peaking at 30 min post resistance exercise (RE). (B) Targeted analysis of gene sets significantly enriched in genes downregulated 3–8 h post RE. (C) Targeted analysis of biphasic DEGs composing cluster 4, as presented in Fig. 2D. NR4A1 adj. p = 0.0049 at 30 min, adj. p = 6.5E−8 at 8 h, adj. p = 1.0E−6 at 24 h, NR4A2 adj. p = 0.0135 at 30 min, adj. p = 0.0081 at 3 h, adj. p = 4.7E−6 at 8 h, adj. p = 2.4E−6 at 24 h, NR4A3 adj. p = 1.8E−8 at 8 h. (AC) Gene ontology (GO) gene set enrichment analysis is analyzed using a Fisher exact test with Benjamini–Hochberg p-value correction. (D) Gene expression of selected genes with a biphasic gene expression pattern, up early/down late, n = 8. DESeq2 was calculated using a Wald test with a Benjamini–Hochberg p-value correction. *p < 0.05 vs Pre values. Neg. negative, Reg. regulation.
Figure EV3
Figure EV3. Venn diagram illustrating overlap in gene expression between the biopsy-only control group and the post-RE response at 3 and 8 h.
(A) Venn-diagram of up and downregulated differentially expressed gene lists from the resistance exercise and control group. RE resistance exercise. (B) Genes corresponding to the overlap presented in (A).
Figure EV4
Figure EV4. Interpolated fiber type area distribution of muscle samples.
(A) Correlation of gene expression data with type I fiber area asses by muscle histology (p = 3.0E−5), data from Reitzner et al (2024). Blue dots = Data points from Reitzner et al (2024), Red dots = interpolated values based on gene data. (B) Data table of type I fiber area % in each participant.
Figure EV5
Figure EV5. Transcriptional similarities between human RE recovery and MYC overexpression in mouse plantaris muscle.
(A) Comparison of upregulated DEGs across 24 h of RE recovery in humans (n = 8) vs plantaris muscle from MYC-overexpressing mice from Murach et al (2022). (BD) Top gene sets (GO: Biological processes) based on DEGs in (B) the human exclusive gene list, (C) MYC mouse exclusive gene list, and (D) overlapping gene list, respectively. (BD) Gene ontology (GO) gene set enrichment analysis is analyzed using a Fisher exact test with Benjamini–Hochberg p-value correction. Gene sets are ranked according to their adj. p-values. (G) Heatmap showing DEG pattern for ribosome-related genes overlapping human RE response to a MYC response in mouse plantaris muscle. Source data are available online for this figure.

References

    1. Akalin A, Kormaksson M, Li S, Garrett-Bakelman FE, Figueroa ME, Melnick A, Mason CE (2012) methylKit: a comprehensive R package for the analysis of genome-wide DNA methylation profiles. Genome Biol 13:R87 - PMC - PubMed
    1. Aleksander SA, Balhoff J, Carbon S, Cherry JM, Drabkin HJ, Ebert D, Feuermann M, Gaudet P, Harris NL (2023) The Gene Ontology knowledgebase in 2023. Genetics 224:iyad031 - PMC - PubMed
    1. Alvares LE, Schubert FR, Thorpe C, Mootoosamy RC, Cheng L, Parkyn G, Lumsden A, Dietrich S (2003) Intrinsic, Hox-dependent cues determine the fate of skeletal muscle precursors. Dev Cell 5:379–390 - PubMed
    1. Alway SE (1997) Overload-induced C-Myc oncoprotein is reduced in aged skeletal muscle. J Gerontol Ser A 52:B203–B211 - PubMed
    1. Amar D, Lindholm ME, Norrbom J, Wheeler MT, Rivas MA, Ashley EA (2021) Time trajectories in the transcriptomic response to exercise-a meta-analysis. Nat Commun 12:1–12 - PMC - PubMed

Substances