. 2024 Nov;56(11):2382-2394.
doi: 10.1038/s12276-024-01332-w. Epub 2024 Nov 1.

Proteogenomic analysis dissects early-onset breast cancer patients with prognostic relevance

Affiliations

Proteogenomic analysis dissects early-onset breast cancer patients with prognostic relevance

Kyong-Ah Yoon et al. Exp Mol Med. 2024 Nov.

Abstract

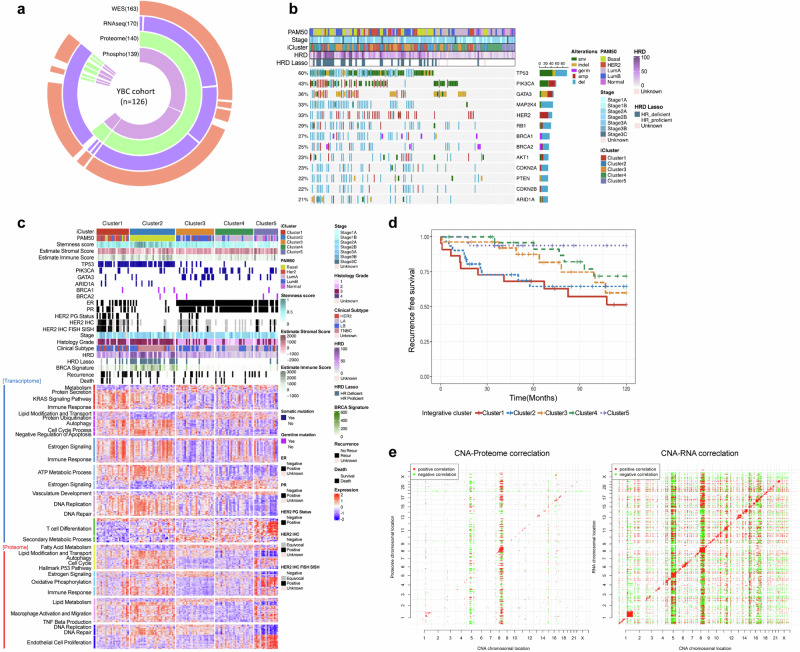
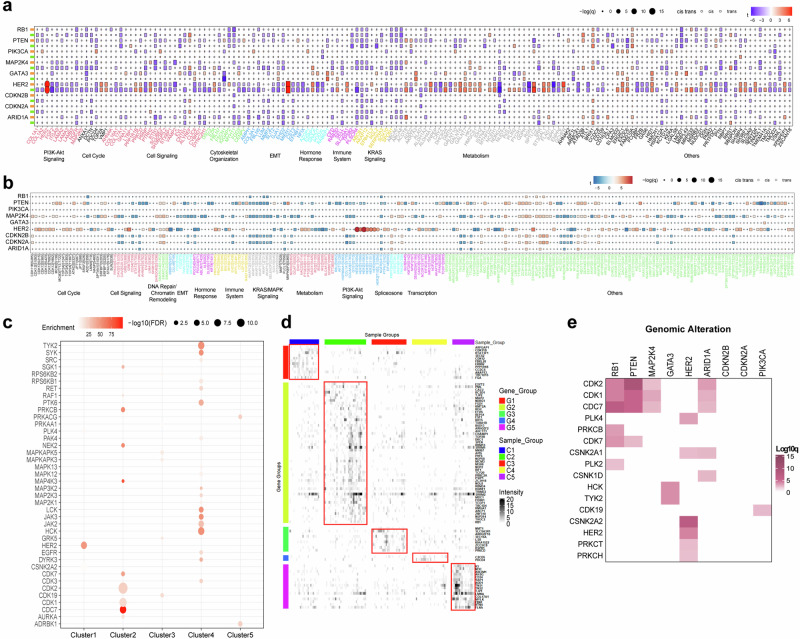
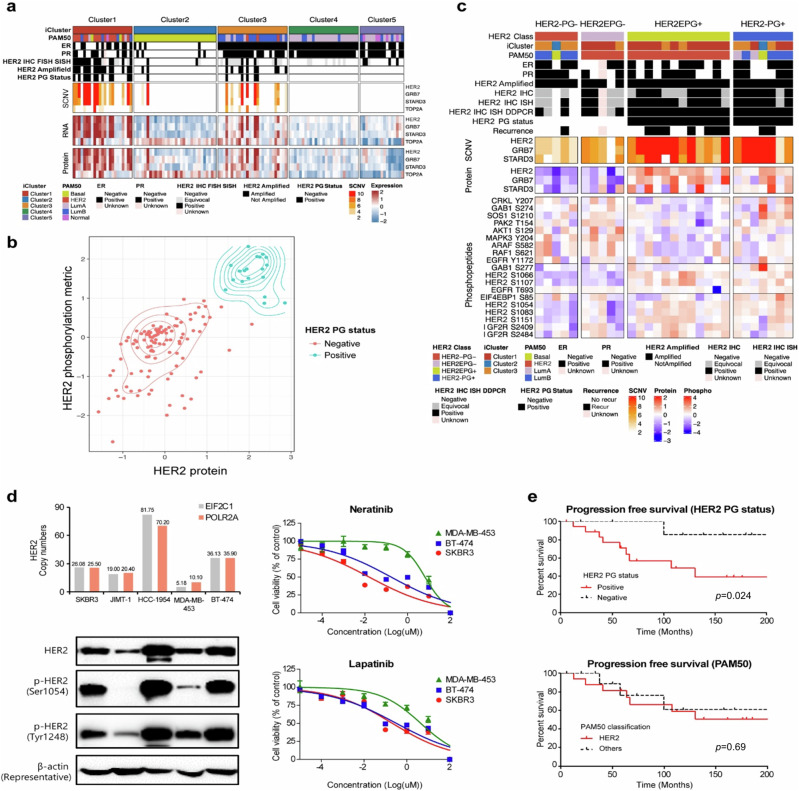
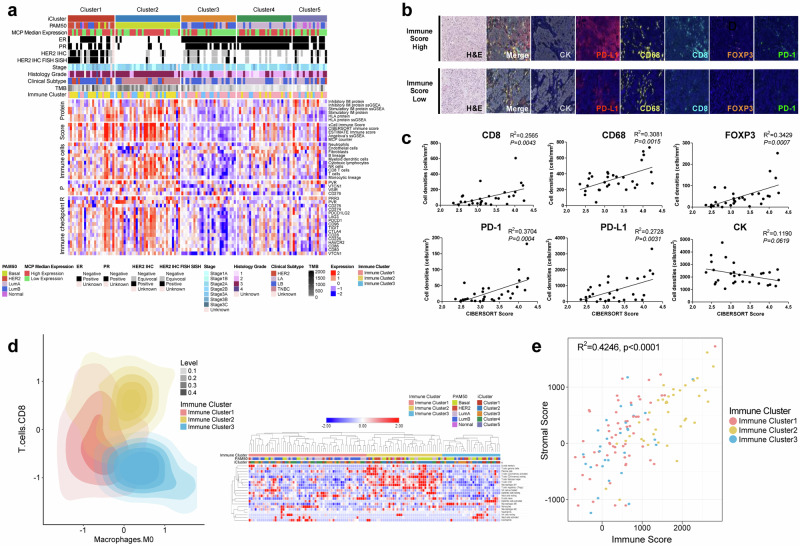
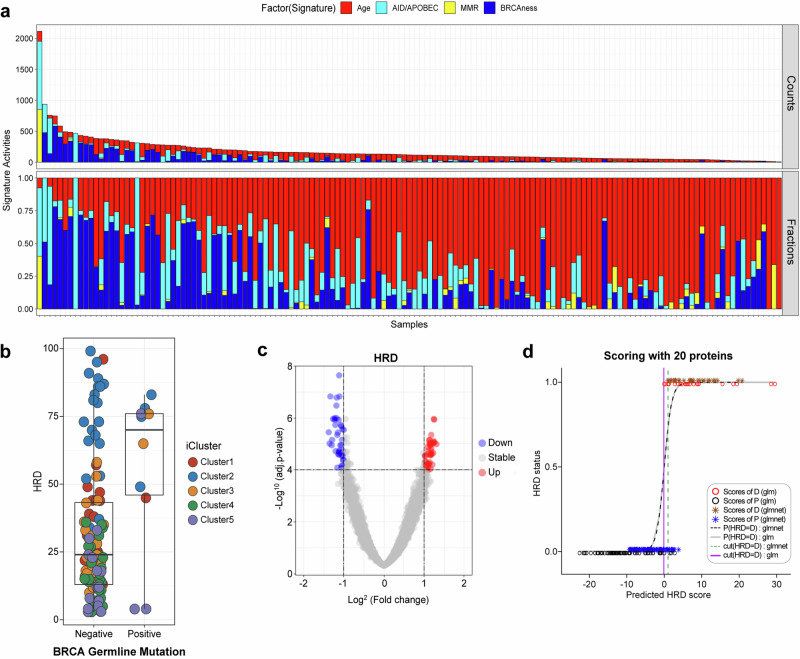
Early-onset breast cancer is known for its aggressive clinical characteristics and high prevalence in East Asian countries, but a comprehensive understanding of its molecular features is still lacking. In this study, we conducted a proteogenomic analysis of 126 treatment-naïve primary tumor tissues obtained from Korean patients with young breast cancer (YBC) aged ≤40 years. By integrating genomic, transcriptomic, and proteomic data, we identified five distinct functional subgroups that accurately represented the clinical characteristics and biological behaviors of patients with YBC. Our integrated approach could be used to determine the proteogenomic status of HER2, enhancing its clinical significance and prognostic value. Furthermore, we present a proteome-based homologous recombination deficiency (HRD) analysis that has the potential to overcome the limitations of conventional genomic HRD tests, facilitating the identification of new patient groups requiring targeted HR deficiency treatments. Additionally, we demonstrated that protein-RNA correlations can be used to predict the late recurrence of hormone receptor-positive breast cancer. Within each molecular subtype of breast cancer, we identified functionally significant protein groups whose differential abundance was closely correlated with the clinical progression of breast cancer. Furthermore, we derived a recurrence predictive index capable of predicting late recurrence, specifically in luminal subtypes, which plays a crucial role in guiding decisions on treatment durations for YBC patients. These findings improve the stratification and clinical implications for patients with YBC by contributing to the optimal adjuvant treatment and duration for favorable clinical outcomes.


Conflict of interest statement

Competing interests: J.K. is an employee of GSK, USA, and the other authors declare no competing interests.

Figures

Fig. 1
Fig. 1. Molecular portraits of early-onset breast cancer.
a Data structure outlining the molecular profiles of 126 patients with early-onset breast cancer, categorized according to each type of molecular data generated in the current study. WES (n = 163), RNA-seq (n = 170), proteome (n = 140), and phosphoproteome (n = 139) data were generated for 178 young- breast cancer patients. Among these patients, multiomic data were generated for 126 individuals. b Genomic landscape of major breast cancer driver genes on the basis of mutational and somatic copy number status. Genomic alterations are color-coded in accordance with the type of mutation. The bar graph on the right denotes the total count of each specific genomic alteration observed. PAM50: PAM50 breast cancer subtypes; Stage: Pathological stage of breast cancer; iCluster: 5 integrative clusters based on proteogenomic analysis of the current study cohort; HRD: the level of homologous recombination deficiency on the basis of next-generation sequencing data; HRD LASSO: classification of HRD status from next-generation sequencing data; c Heatmap illustrating supervised clustering of differentially expressed genes (upper panel) and proteins (lower panel) across integrative molecular clusters (Kruskal‒Wallis test, FDR p < 5 × 10−5). The pathways enriched by the differentially expressed genes and proteins are annotated on the left. d Kaplan‒Meier curves showing the progression-free survival outcomes of patients in the integrative clusters in the dataset. Stratification of patients on the basis of comprehensive multiomics data yielded five distinct molecular clusters, each associated with a different clinical outcome. Clusters 1 (red), 2 (blue), 3 (yellow), 4 (green), and 5 (violet) are shown. e Correlations of somatic copy number alterations (SCNAs, x-axis) with mRNA (left) and protein (right) abundances (y-axis).
Fig. 2
Fig. 2. Targetable elements associated with clusters and genomic alterations from proteogenomic analysis of early-onset East Asian breast cancer.
Cis- and trans-effects of major genomic alterations, including mutations and copy number variations, on protein (a) and phosphoprotein (b) levels. The cis and trans effects of each genomic alteration can be categorized into major cancer hallmark pathways. c Plot depicting kinases that exhibited preferential substrate phosphorylation within each integrated molecular cluster. d Heatmap showing the fraction of outlier values in each sample per protein. The proteins shown are kinases highly phosphorylated in each cluster, with an FDR of less than 0.01 according to BlackSheep. The top panel shows the classifier based on the five major integrative clusters (iClusters). The right panels depict the abundance of the kinase activation loop and kinase substrate enrichment. e Heatmap showing q values from kinase substrate enrichment analysis for enrichment of phosphorylation outliers (y-axis) in samples with the indicated mutated gene (x-axis). Kinases with an FDR of less than 0.01 are shown.
Fig. 3
Fig. 3. Proteogenomic classification of HER2 status in YBC.
a Proteogenomic analysis of the HER2 locus in the current cohort. The heatmap displays the clinical and molecular data (top panel), SCNA data (center upper panel), RNA expression data (center lower panel), and protein expression data (bottom panel) of genes located near HER2 on chromosome 17q in the corresponding samples. HER2 IHC FISH SISH: pathological index of HER2 status from immunohistochemistry, fluorescence in situ hybridization or silver-enhanced in situ hybridization, HER2 PG Status: Her2 proteogenomic status. b Proteogenomic classification of the HER2 breast cancer subtype. Proteogenomic status of HER2 combined with HER2 protein levels (x-axis) and HER2 phosphorylation status (y-axis). HER2 proteogenomic status was stratified and depicted as either blue (positive) or red (negative). c Phosphopeptide levels of components of the HER2 signaling pathway according to the refined classification of HER2. The top panel of the heatmap outlines the subtype classifications and clinical marker status for each sample, whereas the center panels denote SCNAs and protein levels for genes in the amplicon closely associated with HER2, followed by the corresponding protein levels. The bottom panel illustrates the abundances of phosphopeptides, such as serine residues 1066, 1107, 1054, 1083, and 1151 from the HER2 pathway. d HER2 protein levels and drug response to HER2 inhibitors in breast cancer cell lines. (Left upper) Distribution of HER2 copy number in HER2-positive cell lines. The HER2 copy number was measured in HER2-positive breast cancer cell lines via droplet-digital PCR (ddPCR). EIF2C1 and POLR2A were used as reference genes to determine the ratios of HER2 to EIF2C1 or POLR2A. (Left lower) Western blot analysis was conducted to assess the expression and phosphorylation status of HER2 in HER2-positive breast cancer cell lines. The HER2-positive breast cancer cell lines SKBR3, JIMT-1, HCC-1954, MDA-MB-453, and BT-474 were separated via SDS‒PAGE and immunoblotted. Western blotting was performed for total HER2, p-HER2 (Ser1054, Tyr1248), and β-actin. (Right) Drug sensitivity test of HER2 inhibitors (neratinib, lapatinib) in breast cancer cells phosphorylated at serine 1054. MDA-MB-453, BT-474, and SKBR3 cells were treated with neratinib or lapatinib for 48 h. Data are presented as the mean ± SEM. Drug sensitivity assays were performed independently in triplicate. e Kaplan‒Meier curves showing progression-free survival outcomes according to HER2 PG status or PAM50 class.
Fig. 4
Fig. 4. Immunological landscape of early-onset Korean breast cancer.
a Heatmap showing the wide range of expression levels for immune-related features in each integrative molecular cluster. Protein-derived signatures for immune modulator gene sets are depicted in the top panel. Z scores of RNA-based immune signatures from xCell, CIBERSORT, ESTIMATE, gene sets from Angelova, and the MCP counter are shown in the second data panel. The third to fifth data panels show log2 ratios for normalized RNA-seq and proteomics data (the phosphoprotein is the median for all sites on a given protein) for immune cells and immune checkpoint targets, such as CD276, TIGIT, LAG3, and CTLA4. MCP median expression: ER: pathological staining of estrogen receptor, PR: pathological staining of progesterone receptor. b Multiplex imaging portrays the immune microenvironment of the tumor. The upper and lower panels represent samples that correspond to high and low computational immune scores, respectively. The samples were probed for CK (cytokeratin), PD-L1, CD68, CD8, FOXP-3, and PD-1. The morphological features are indicated by H&E staining. c Graphs depict the linear regression for correlations between cell counts per total area (cells/mm2) of each patient from all available ROIs for multiplex imaging probes and the CIBERSORT absolute immune score. *P < 0.05 d YBC samples are classified into immune-hot (yellow), immune-intermediate (pink), and immune-cold (blue) groups. The heatmap on the right illustrates various immune components (y-axis) as per the immune clusters. e Collinearity between immune and stromal scores in early-onset breast cancer. The scatter plot shows the relationship between the computational immune score (x-axis) and the stromal score (y-axis), with colors corresponding to the three different immune clusters. Spearman rank correlation coefficient analysis of the immune score (x-axis) and stromal score (y-axis) for immune clusters 1 ~ 3 (R2 = 0.4246, p < 0.0001).
Fig. 5
Fig. 5. Proteogenomic analysis of homologous recombination-deficient YBC.
a Mutational signature in early-onset breast cancer displaying the quantity (upper) and proportion (lower) of somatic mutations per sample belonging to each mutational signature. These include aging (red), APOBEC (cyan blue), mismatch repair defects (MMR, yellow), and BRCAness (blue) signatures. b Relationship between the homologous recombination defect (HRD) index and BRCA germline mutations. Germline BRCA mutations have a limited correlation with the degree of HRD. c Identification of protein elements that are highly correlated with the degree of HRD in breast cancer samples. d Predictive accuracy of different scoring methods in forecasting HRD status on the basis of scores derived from 20 proteins associated with HRDness. The data are presented using two different modeling techniques: a generalized linear model and elastic net regularization. The x-axis represents the predicted HRD score values for each sample. The y-axis indicates HRD status, with 0 representing non-HRD (HRP) and 1 representing HRD. Scores of D, P (glm): scores derived from the generalized linear model for Dataset D or P, represented by red and black circles. Scores of D, P (glmnet): scores derived from the elastic net model for Dataset D or P, represented by brown and blue asterisks. P (HRD = D): glm/glmnet: predicted logistic probability of HRD using the glm or glmnet model, depicted by a gray solid line or black dashed line. Threshold (HRD = D): glm/glmnet: The threshold value for HRD is D using the glm or glmnet model, shown as a solid or dotted line estimated from the maximum ROC. The thresholds help distinguish between HRD and non-HRD samples, providing a visual comparison of the predictive power and accuracy of the glm and glmnet models.

References

    1. Hong, S. et al. Cancer Statistics in Korea: Incidence, mortality, survival, and prevalence in 2017. Cancer Res Treat.52, 335–350 (2020). - DOI - PMC - PubMed
    1. Sung, H. et al. Global Cancer Statistics 2020: GLOBOCAN estimates of incidence and mortality worldwide for 36 cancers in 185 countries. CA Cancer J. Clin.71, 209–249 (2021). - DOI - PubMed
    1. Kang, S. Y. et al. Breast Cancer Statistics in Korea, 2018. J. Breast Cancer24, 123–137 (2021). - DOI - PMC - PubMed
    1. DeSantis, C. E. et al. Breast cancer statistics, 2019. CA Cancer J. Clin.69, 438–451 (2019). - DOI - PubMed
    1. Ahn, S. H. et al. Poor outcome of hormone receptor-positive breast cancer at very young age is due to tamoxifen resistance: nationwide survival data in Korea-a report from the Korean Breast Cancer Society. J. Clin. Oncol.25, 2360–2368 (2007). - DOI - PubMed