. 2024 Nov;56(11):2436-2448.
doi: 10.1038/s12276-024-01341-9. Epub 2024 Nov 1.

The transcription factor BBX regulates phosphate homeostasis through the modulation of FGF23

Affiliations

The transcription factor BBX regulates phosphate homeostasis through the modulation of FGF23

Su Jeong Lee et al. Exp Mol Med. 2024 Nov.

Abstract

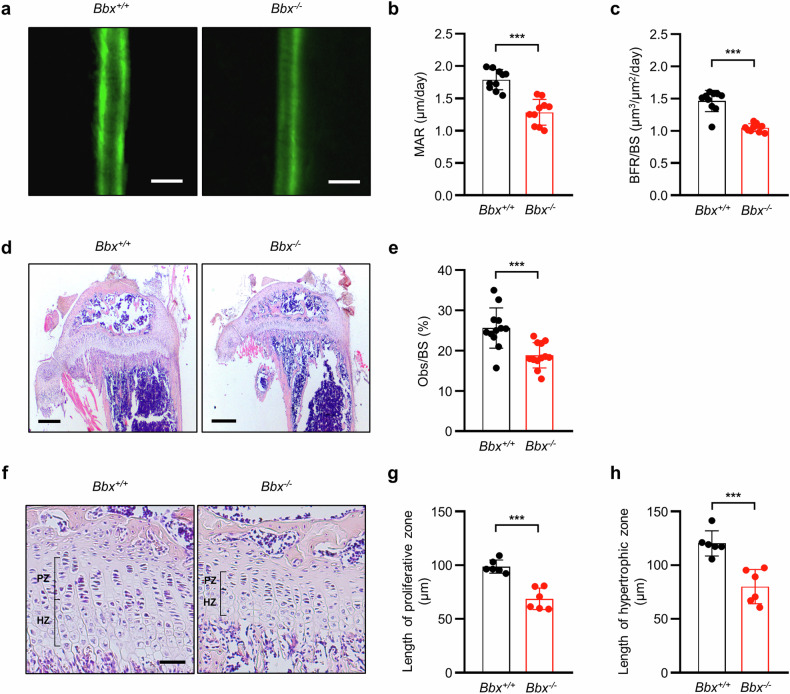
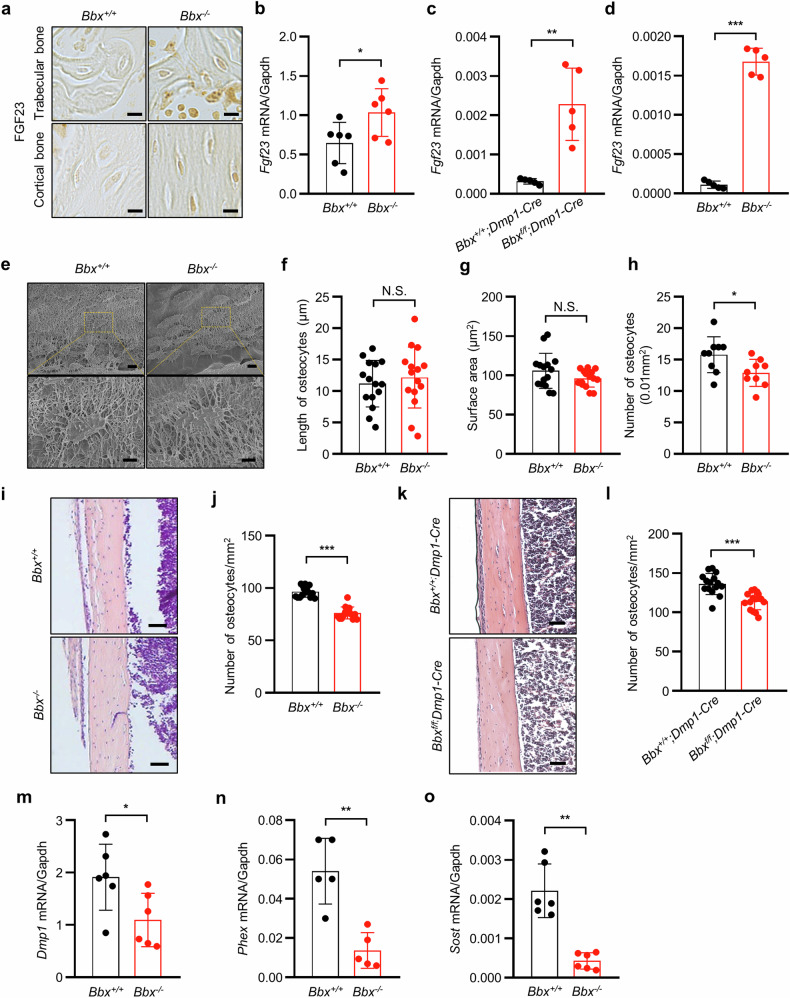
Fibroblast growth factor 23 (FGF23) plays an important role in phosphate homeostasis, and increased FGF23 levels result in hypophosphatemia; however, the molecular mechanism underlying increased FGF23 expression has not been fully elucidated. In this study, we found that mice lacking the bobby sox homolog (Bbx-/-) presented increased FGF23 expression and low phosphate levels in the serum and skeletal abnormalities such as a low bone mineral density (BMD) and bone volume (BV), as well as short and weak bones associated with low bone formation. Osteocyte-specific deletion of Bbx using Dmp-1-Cre resulted in similar skeletal abnormalities, elevated serum FGF23 levels, and reduced serum phosphate levels. In Bbx-/- mice, the expression of sodium phosphate cotransporter 2a (Npt2a) and Npt2c in the kidney and Npt2b in the small intestine, which are negatively regulated by FGF23, was downregulated, leading to phosphate excretion/wasting and malabsorption. An in vitro Fgf23 promoter analysis revealed that 1,25-dihydroxyvitamin D3 (1,25(OH)2D3)-induced transactivation of the Fgf23 promoter was significantly inhibited by BBX overexpression, whereas it was increased following Bbx knockdown. Interestingly, 1,25(OH)2D3 induced an interaction of the 1,25(OH)2D3 receptor (VDR) with BBX and downregulated BBX protein levels. Cycloheximide (CHX) only partially downregulated BBX protein levels, indicating that 1,25(OH)2D3 regulates BBX protein stability. Furthermore, the ubiquitination of BBX followed by proteasomal degradation was required for the increase in Fgf23 expression induced by 1,25(OH)2D3. Collectively, our data demonstrate that BBX negatively regulates Fgf23 expression, and consequently, the ubiquitin-dependent proteasomal degradation of BBX is required for FGF23 expression, thereby regulating phosphate homeostasis and bone development in mice.


Conflict of interest statement

Competing interests: The authors declare no competing interests.

Figures

Fig. 1
Fig. 1. BBX disruption delays postnatal growth and alters the morphological and physical features of mice.
a Morphology of the skeleton and cartilage of Bbx+/+, Bbx+/−, and Bbx−/− mice at P0. P0 embryos were stained with alizarin red/alcian blue. Scale bars, 5 mm b Gross appearance of 4-week-old Bbx+/+, Bbx+/−, and Bbx−/− mice. Scale bars, 1 cm. c Growth curves of Bbx+/+ and Bbx−/− mice. At each time point, the body weights of the Bbx+/+ and Bbx−/− mice were measured (n = 10). d Representative micro-CT images of femurs from 4-week-old Bbx+/+ and Bbx−/− mice. e Comparison of the mean femur length in Bbx+/+ and Bbx−/− mice using CTVox software (n = 6). f Representative micro-CT images of the femurs of 4-week-old Bbx+/+ and Bbx−/− mice. g Pseudocolor images of the femurs of 4-week-old Bbx+/+ and Bbx−/− mice. The color corresponds to the degree of BMC. A lower BMC is shown in blue and green, whereas a higher BMC is shown in red. h A three-point bending test was performed to determine the fracture strength of the tibias of Bbx+/+ and Bbx−/− mice (n = 7). i, j The MMI was measured in the trabecular (i) and cortical (j) bones of the femurs of Bbx+/+ and Bbx−/− mice using CTAn (n = 6). k, l Gross appearances and body weights of 4-week-old Bbx+/+;Dmp1-Cre and Bbxf/f;Dmp1-Cre mice (n = 5). m Representative micro-CT images of femurs from 4-week-old Bbx+/+;Dmp1-Cre and Bbxf/f;Dmp1-Cre mice. n, o The MMI was measured in the trabecular (n) and cortical (m) bones of femurs from Bbx+/+;Dmp1-Cre and Bbxf/f;Dmp1-Cre mice using CTAn (n = 10). The data are presented as the means ± SDs. Each dot represents one independent experiment. *p < 0.05, **p < 0.01, and ***p < 0.001 as determined by an unpaired Student’s t-test between the two indicated genotypes. N.S. indicates no significant difference compared with control mice. Male mice were used in all the experiments.
Fig. 2
Fig. 2. BBX disruption decreases bone formation, the number of osteoblasts, and growth plate length.
a Representative fluorescence images of tibial cross-sections (mid-diaphysis area) from 4-week-old Bbx+/+ and Bbx−/− mice. Bone formation was visualized using double calcein labeling. Scale bars, 10 μm. b, c MAR (b) and BFR/BS (c) at the mid-diaphysis of the tibial shafts from 4-week-old Bbx+/+ and Bbx−/− mice were measured (n = 10). d H&E staining of sagittal tibial sections from 4-week-old Bbx+/+ and Bbx−/− mice. Scale bars, 1 mm. e Quantitative histomorphometric analyses of the proximal tibia. Obs/BS was measured using i-solution (n = 12). f Higher magnification images of the growth plate area in (d). Scale bars, 50 μm. g, h The lengths of the proliferative chondrocyte zones (PZ) (g) and hypertrophic chondrocyte zones (HZ) (h) were measured in the growth plates of 4-week-old Bbx+/+ and Bbx−/− mice. The data are presented as the means ± SDs. Each dot represents one independent experiment. ***p < 0.001, as determined by an unpaired Student’s t-test between the two indicated genotypes.
Fig. 3
Fig. 3. BBX disruption induces hypophosphatemia resulting from phosphate excretion and malabsorption via the upregulation of FGF23.
Analyses of the serum levels of ions and regulatory factors, and tissue expression of ion transporters were performed in 4-week-old mice. ad Serum levels of calcium (a) and phosphate (b) and urine concentrations of phosphate (d) were measured in samples collected from Bbx+/+ and Bbx−/− mice (n = 7). Serum levels of phosphate (c) were measured in samples collected from Bbx+/+;Dmp1-Cre and Bbxf/f;Dmp1-Cre mice (n = 7). eg Renal Npt2a (e), Npt2c (f), and small intestinal Npt2b (g) mRNA levels were measured via qRT‒PCR (n = 5). hl The intact FGF23 levels (h), iFGF23/cFGF23 ratio (i), PTH levels (k), and 1,25(OH)2D3 levels (l) were measured in serum samples from Bbx+/+ and Bbx−/− mice (n = 5‒7), and the intact FGF23 levels (j) were measured in serum samples from Bbx+/+;Dmp1-Cre and Bbxf/f;Dmp1-Cre mice (n = 6). The data are presented as the means ± SDs. Each dot represents one independent experiment. *p < 0.05, **p < 0.01, and ***p < 0.001, as determined by an unpaired Student’s t-test between the two indicated genotypes. N.S. indicates no significant difference compared with control mice.
Fig. 4
Fig. 4. BBX disruption increases FGF23 production in osteoblasts and osteocytes and decreases the number and activity of osteocytes.
a Immunohistochemical staining for FGF23 in osteocytes from the femurs of Bbx+/+ and Bbx−/− mice. Scale bars, 10 μm (lower panel). b Fgf23 mRNA expression in the femurs of Bbx+/+ and Bbx−/− mice was measured via qRT‒PCR (n = 6). c The expression of the Fgf23 mRNA in the femurs of Bbx+/+;Dmp1-Cre and Bbxf/f;Dmp1-Cre mice was measured (n = 5). d Fgf23 mRNA expression was measured in BMSC-derived osteoblasts from Bbx+/+ and Bbx−/− mice (n = 5). e SEM images of acid-etched cortical bone. Scale bars, 10 μm (upper panel) and 5 μm (lower panel). fh Morphometric analyses of osteocytes. The length (f), surface area (g), and number (h) of osteocytes in the cortical bone of Bbx+/+ and Bbx−/− mice were analyzed in SEM images (n = 9–15). i H&E staining of sagittal tibial sections from Bbx+/+ and Bbx−/− mice. Scale bars, 50 μm. j The number of osteocytes per bone surface (mm2) from Bbx+/+ and Bbx−/− mice in (i) was determined (n = 15). k H&E staining of sagittal tibial sections from Bbx+/+;Dmp1-Cre and Bbxf/f;Dmp1-Cre mice. Scale bars, 50 μm. l The number of osteocytes per bone surface (mm2) from Bbx+/+;Dmp1-Cre and Bbxf/f;Dmp1-Cre mice in (k) was analyzed (n = 15). mo Dmp1 (m), Phex (n), and Sost (o) mRNA expression levels were measured in the femurs of Bbx+/+ and Bbx−/− mice (n = 5‒6). The data are presented as the means ± SDs. Each dot represents one independent experiment. *p < 0.05, **p < 0.01, and ***p < 0.001, as determined by an unpaired Student’s t-test between the two indicated genotypes. N.S. indicates no significant difference compared with control mice.
Fig. 5
Fig. 5. BBX negatively regulates the 1,25(OH)2D3-mediated transcriptional activity of FGF23.
a MC3T3-E1 cells were cotransfected with the BBX cDNA in the pcDNA3-Basic vector (150 ng) and Fgf23 promoter-firefly luciferase construct in the pGL-2 Basic plasmid (150 ng), incubated with 1,25(OH)2D3 (20 nM) for 24 h, and dual-luciferase assays were performed. b MC3T3-E1 cells were transfected with the Bbx shRNA or scrambled shRNA and incubated with or without 1,25(OH)2D3 (20 nM) for 24 h, after which FGF23 production was measured. The intact FGF23 level in the culture medium was quantified using an ELISA to detect intact FGF23. c Fgf23 mRNA expression was measured in response to 1,25(OH)2D3 treatment in BMSC-derived osteoblasts from Bbx+/+ and Bbx−/− mice. d MC3T3-E1 cells were transfected with the scrambled or Bbx shRNA and treated with or without 1,25(OH)2D3 (20 nM) for 24 h. BBX levels and 1,25(OH)2D3 receptor (VDR) protein levels were assessed via immunoblot analysis. e Interaction between BBX and VDR. MC3T3-E1 cells were transfected with 2-Flag-tagged BBX and VDR plasmids and immunoprecipitated with anti-Flag or anti-VDR antibodies. The interacting proteins were detected with the corresponding antibodies. f Interactions between endogenous BBX, VDR, and RXR. MC3T3-E1 cells were treated with 1,25(OH)2D3 (20 nM) for 30 min. Endogenous BBX and VDR were immunoprecipitated with anti-BBX or anti-VDR antibodies, and interacting protein levels were analyzed by immunoblotting. g Effects of 1,25(OH)2D3 on BBX protein downregulation and BBX mRNA levels. MC3T3-E1 cells were treated with 1,25(OH)2D3 (20 nM) for 24 h and analyzed by immunoblotting and qRT‒PCR. h Effect of 1,25(OH)2D3 treatment on BBX protein expression in the presence of CHX. MC3T3-E1 cells were treated with CHX (10 μM) for 1 h, followed by treatment with 1,25(OH)2D3 (20 nM) for each time course. i Analysis of the proteasomal degradation of BBX. MC3T3-E1 cells were transfected with the indicated plasmids and treated with or without MG-132 (10 μM) for 1 h, followed by treatment with 1,25(OH)2D3 (20 nM) for 12 h. The cell lysates were subjected to immunoblotting with the indicated antibodies. j 1,25(OH)2D3 increases BBX ubiquitination. MC3T3-E1 cells transfected with 2-Flag-BBX cDNA were treated with MG-132 (10 μM) for 1 h, followed by treatment with 1,25(OH)2D3 (20 nM) for 12 h. The Flag tag was immunoprecipitated from whole-cell lysates and detected with a ubiquitin antibody by immunoblotting. k MC3T3-E1 cells were cotransfected with the BBX cDNA and P1.0 FGF23 promoter-firefly luciferase plasmid and treated with MG-132 (10 μM) for 1 h, followed by treatment with 1,25(OH)2D3 (20 nM) for 12 h. The relative luciferase activity was measured. Actin was used as a loading control. The data are presented as the means ± SDs. ***p < 0.001, as determined by one-way or two-way ANOVA.
Fig. 6
Fig. 6. Schematic drawing illustrating the role of BBX in the transcription of FGF23 and its impact on phosphate homeostasis and bone development.
BBX-deficient mice exhibit a phenotype characterized by delayed growth and skeletal abnormalities, including reduced bone mineralization, BMD, and BV. These abnormalities are linked to elevated FGF23 expression in osteoblasts and osteocytes, which leads to hypophosphatemia. The role of BBX in 1,25(OH)2D3-induced FGF23 expression is demonstrated, as ubiquitination and subsequent proteasomal degradation of BBX are required for this process. Therefore, BBX acts as a negative regulator of FGF23 expression and phosphate metabolism, ultimately influencing bone development and growth. FGF23 Fibroblast growth factor 23; BMD Bone mineral density; BV Bone volume.

References

    1. Subramanian, R. & Khardori, R. Severe hypophosphatemia. Pathophysiologic implications, clinical presentations, and treatment. Medicine79, 1–8 (2000). - PubMed
    1. Florenzano, P. et al. Approach to patients with hypophosphataemia. Lancet Diab. Endocrinol.8, 163–174 (2020). - PubMed
    1. Fukumoto, S. Phosphate metabolism and vitamin D. Bonekey Rep.3, 497 (2014). - PMC - PubMed
    1. Jüppner, H. Phosphate and FGF-23. Kidney Int. Suppl.79, S24–S27 (2011). - PMC - PubMed
    1. Torres, P. A. & De Brauwere, D. P. Three feedback loops precisely regulating serum phosphate concentration. Kidney Int.80, 443–445 (2011). - PubMed

MeSH terms

LinkOut - more resources