

Gas exchange efficiency slopes to assess exercise tolerance in chronic obstructive pulmonary disease
- PMID: 39482616
- PMCID: PMC11529499
- DOI: 10.1186/s12890-024-03312-2
Gas exchange efficiency slopes to assess exercise tolerance in chronic obstructive pulmonary disease
Abstract
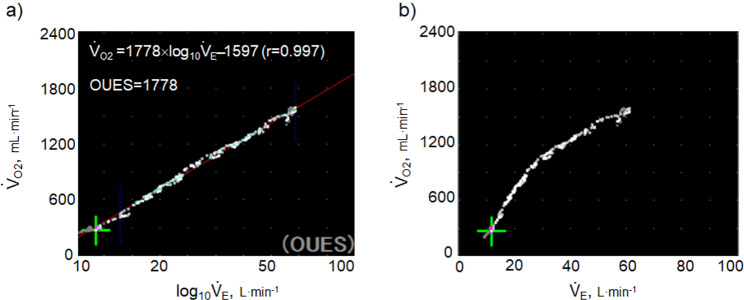
Background: In patients with chronic obstructive pulmonary disease (COPD), the clinical use of the minute ventilation-carbon dioxide production ([Formula: see text]E-[Formula: see text]CO2) slope has been reported as a measure of exercise efficiency, but the oxygen uptake efficiency slope (OUES), i.e., the slope of oxygen uptake ([Formula: see text]O2) versus the logarithmically transformed [Formula: see text]E, has rarely been reported.
Methods: We hypothesized that the [Formula: see text]E-[Formula: see text]CO2 slope is more useful than OUES in clinical use for the pathophysiological evaluation of COPD. Then, we investigated the cardiopulmonary exercise testing parameters affecting each of these slopes in 122 patients with all Global Initiative for Chronic Obstructive Lung Disease (GOLD) COPD grades selected from our database.
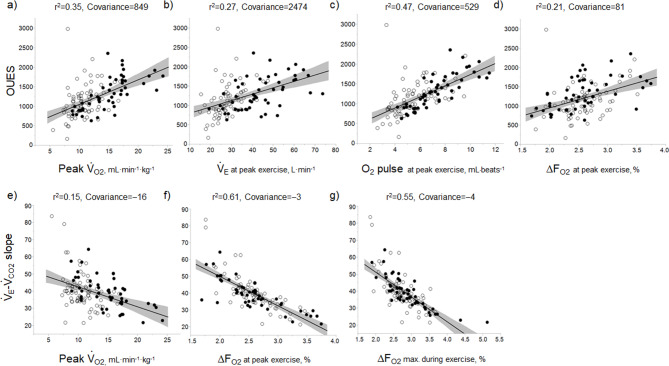
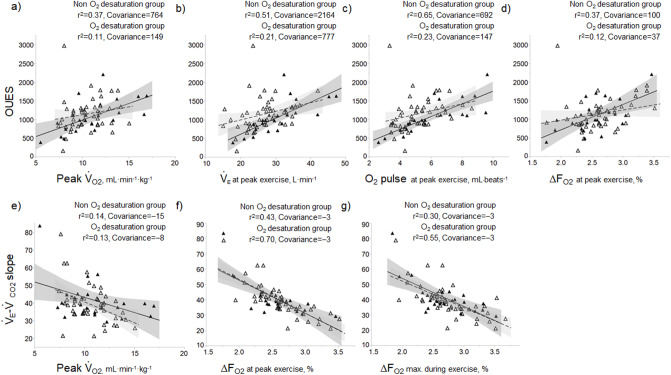
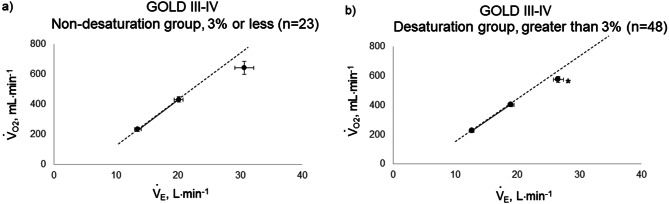
Results: Compared with the GOLD I-II group (n = 51), peak [Formula: see text]O2 (p < 0.0001), OUES (p = 0.0161), [Formula: see text]E at peak exercise (p < 0.0001), and percutaneous oxygen saturation (SpO2) at peak exercise (p = 0.0004) were significantly lower in the GOLD III-IV group (n = 71). The GOLD III-IV group was divided into two groups by the exertional decrease in SpO2 from rest to peak exercise: 3% or less (the non-desaturation group: n = 23), or greater than 3% (the desaturation group: n = 48). OUES correlated only weakly with peak [Formula: see text]O2, [Formula: see text]E at peak exercise, and the difference between inspired and expired mean O2 concentrations (ΔFO2) at peak exercise, i.e., an indicator of oxygen consumption ability throughout the body, in the GOLD III-IV group with exertional hypoxemia. In contrast, the [Formula: see text]E-[Formula: see text]CO2 slope was significantly correlated with ΔFO2 at peak exercise, regardless of the COPD grade and exertional desaturation. Across all COPD stages, there was no correlation between the [Formula: see text]E-[Formula: see text]CO2 slope and [Formula: see text]E at peak exercise, and stepwise analysis identified peak [Formula: see text]O2 (p = 0.0345) and ΔFO2 (p < 0.0001) as variables with a greater effect on the [Formula: see text]E-[Formula: see text]CO2 slope.
Conclusions: The OUES may be less useful in advanced COPD with exertional hypoxemia. The [Formula: see text]E-[Formula: see text]CO2 slope, which is independent of [Formula: see text]E, focuses on oxygen consumption ability and exercise tolerance in COPD, regardless of the exertional hypoxemia level and COPD grade. Therefore, the [Formula: see text]E-[Formula: see text]CO2 slope might be useful in establishing or evaluating tailor-made therapies for individual patient's pathologies in COPD as an indicator focusing on oxygen consumption ability.
Keywords: Carbon dioxide; Exercise tolerance; Gas exchange; Oxygen; Pulmonary rehabilitation; Ventilatory efficiency.
© 2024. The Author(s).
Conflict of interest statement
The authors declare no competing interests.
Figures
Similar articles
-
Emphysema on Thoracic CT and Exercise Ventilatory Inefficiency in Mild-to-Moderate COPD.COPD. 2017 Apr;14(2):210-218. doi: 10.1080/15412555.2016.1253670. Epub 2016 Dec 20. COPD. 2017. PMID: 27997255
-
Responses to incremental exercise and the impact of the coexistence of HF and COPD on exercise capacity: a follow-up study.Sci Rep. 2022 Jan 31;12(1):1592. doi: 10.1038/s41598-022-05503-5. Sci Rep. 2022. PMID: 35102201 Free PMC article.
-
Exercise Ventilation in COPD: Influence of Systolic Heart Failure.COPD. 2016 Dec;13(6):693-699. doi: 10.1080/15412555.2016.1174985. Epub 2016 May 12. COPD. 2016. PMID: 27172093
-
Ventilatory Inefficiency and Exertional Dyspnea in Early Chronic Obstructive Pulmonary Disease.Ann Am Thorac Soc. 2017 Jul;14(Supplement_1):S22-S29. doi: 10.1513/AnnalsATS.201612-1033FR. Ann Am Thorac Soc. 2017. PMID: 28345959 Review.
-
Confirming the attainment of maximal oxygen uptake within special and clinical groups: A systematic review and meta-analysis of cardiopulmonary exercise test and verification phase protocols.PLoS One. 2024 Mar 28;19(3):e0299563. doi: 10.1371/journal.pone.0299563. eCollection 2024. PLoS One. 2024. PMID: 38547136 Free PMC article.
References
-
- Armstrong M, Vogiatzis I. Personalized exercise training in chronic lung diseases. Respirology. 2019;24(9):854–62. - PubMed
-
- Riley CM, Sciurba FC. Diagnosis and Outpatient Management of Chronic Obstructive Pulmonary Disease: a review. JAMA. 2019;321(8):786–97. - PubMed
-
- Wasserman K, Hansen J, Sue D, Stringer W, Sietsema K, Sun X-G. Principles of exercise testing and interpretation: including pathophysiology and clinical applications. Philadelphia: Lippincott Williams and Wilkins; 2012.
-
- Laviolette L, Laveneziana P. Exercise Testing in the prognostic evaluation of patients with lung and heart diseases. In: Clinical Exercise Testing (ERS Monograph). edn. Edited by Palange P, Laveneziana P, Neder JA, Ward SA. Sheffield: European Respiratory Society; 2018: 222–234.
MeSH terms
Substances
Grants and funding
LinkOut - more resources
Full Text Sources
Medical
