

Patient iPSC-derived neural progenitor cells display aberrant cell cycle control, p53, and DNA damage response protein expression in schizophrenia
- PMID: 39482642
- PMCID: PMC11526604
- DOI: 10.1186/s12888-024-06127-x
Patient iPSC-derived neural progenitor cells display aberrant cell cycle control, p53, and DNA damage response protein expression in schizophrenia
Abstract
Background: Schizophrenia (SCZ) is a severe psychiatric disorder associated with alterations in early brain development. Details of underlying pathomechanisms remain unclear, despite genome and transcriptome studies providing evidence for aberrant cellular phenotypes and pathway deregulation in developing neuronal cells. However, mechanistic insight at the protein level is limited.
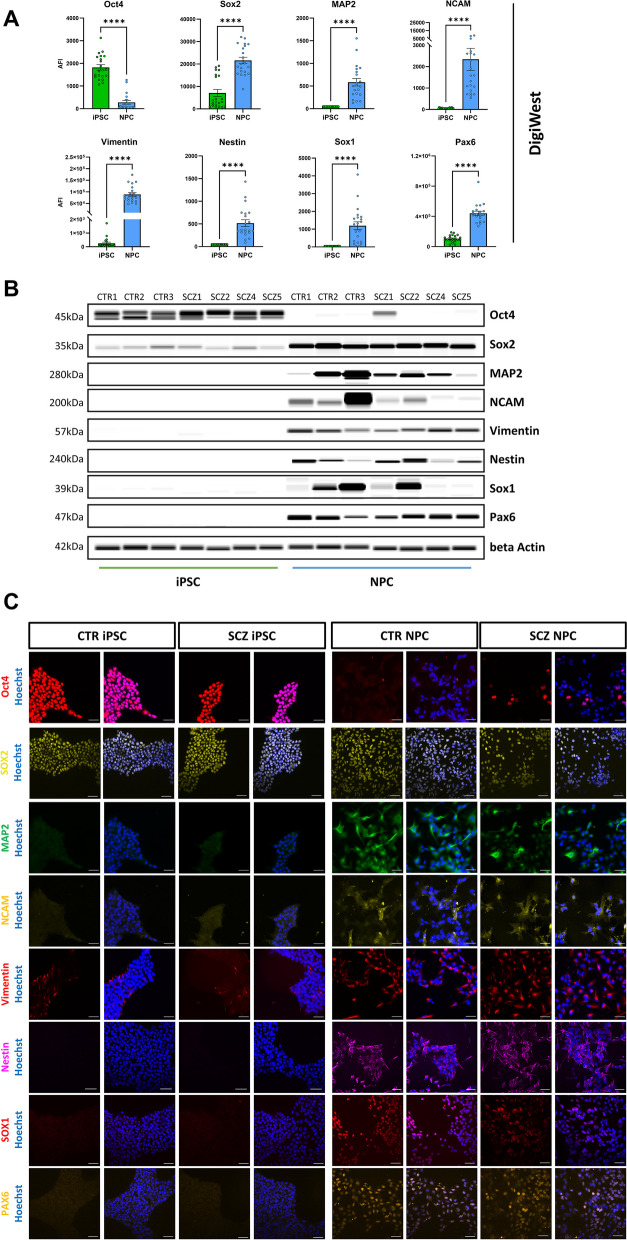
Methods: Here, we investigate SCZ-specific protein expression signatures of neuronal progenitor cells (NPC) derived from patient iPSC in comparison to healthy controls using high-throughput Western Blotting (DigiWest) in a targeted proteomics approach.
Results: SCZ neural progenitors displayed altered expression and phosphorylation patterns related to Wnt and MAPK signaling, protein synthesis, cell cycle regulation and DNA damage response. Consistent with impaired cell cycle control, SCZ NPCs also showed accumulation in the G2/M cell phase and reduced differentiation capacity. Furthermore, we correlated these findings with elevated p53 expression and phosphorylation levels in SCZ patient-derived cells, indicating a potential implication of p53 in hampering cell cycle progression and efficient neurodevelopment in SCZ.
Conclusions: Through targeted proteomics we demonstrate that SCZ NPC display coherent mechanistic alterations in regulation of DNA damage response, cell cycle control and p53 expression. These findings highlight the suitability of iPSC-based approaches for modeling psychiatric disorders and contribute to a better understanding of the disease mechanisms underlying SCZ, particularly during early development.
Keywords: Cell cycle; Cellular signaling; DigiWest; IPSC; Neural progenitors; Proteomics; Schizophrenia; p53.
© 2024. The Author(s).
Conflict of interest statement
The authors declare no competing interests.
Figures


Similar articles
-
βIV spectrin abundancy, cellular distribution and sensitivity to AKT/GSK3 regulation in schizophrenia.Mol Psychiatry. 2025 Jul;30(7):3090-3102. doi: 10.1038/s41380-025-02917-1. Epub 2025 Feb 7. Mol Psychiatry. 2025. PMID: 39920295 Free PMC article.
-
Excitatory Dysfunction Drives Network and Calcium Handling Deficits in 16p11.2 Duplication Schizophrenia Induced Pluripotent Stem Cell-Derived Neurons.Biol Psychiatry. 2023 Jul 15;94(2):153-163. doi: 10.1016/j.biopsych.2022.11.005. Epub 2022 Nov 9. Biol Psychiatry. 2023. PMID: 36581494 Free PMC article.
-
Interneuron migration impairment and brain region-specific DNA damage response following irradiation during early neurogenesis in mice.Cell Mol Life Sci. 2025 Mar 17;82(1):118. doi: 10.1007/s00018-025-05643-7. Cell Mol Life Sci. 2025. PMID: 40095026 Free PMC article.
-
Neurobiological Perturbations in Bipolar Disorder Compared With Schizophrenia: Evidence From Cell Cultures and Brain Organoids.Biol Psychiatry. 2025 Aug 15;98(4):322-332. doi: 10.1016/j.biopsych.2025.02.012. Epub 2025 Feb 19. Biol Psychiatry. 2025. PMID: 39983953 Review.
-
TIS21 (/BTG2/PC3) as a link between ageing and cancer: cell cycle regulator and endogenous cell death molecule.J Cancer Res Clin Oncol. 2006 Jul;132(7):417-26. doi: 10.1007/s00432-006-0080-1. Epub 2006 Feb 3. J Cancer Res Clin Oncol. 2006. PMID: 16456675 Free PMC article. Review.
Cited by
-
Evaluation of the Anticancer Properties of Lamellar Alkaloid Drivatives Extracted from the Tunicate Didemnum abradatum (Moucha Island Sea, Djibouti): Pharmacological and Computational Approach.Molecules. 2025 Aug 11;30(16):3338. doi: 10.3390/molecules30163338. Molecules. 2025. PMID: 40871491 Free PMC article.
-
Aberrant pace of cortical neuron development in brain organoids from patients with 22q11.2 deletion syndrome-associated schizophrenia.Nat Commun. 2025 Aug 1;16(1):6986. doi: 10.1038/s41467-025-62187-x. Nat Commun. 2025. PMID: 40750773 Free PMC article.
-
Towards non-invasive diagnosis of glioblastoma: identifying metabolic biomarkers in liquid biopsies using a ROC-based approach.Discov Oncol. 2025 Aug 2;16(1):1456. doi: 10.1007/s12672-025-03310-8. Discov Oncol. 2025. PMID: 40751888 Free PMC article.
-
Stem cell therapy for the treatment of psychiatric disorders: a real hope for the next decades.Front Psychiatry. 2025 Jan 7;15:1492415. doi: 10.3389/fpsyt.2024.1492415. eCollection 2024. Front Psychiatry. 2025. PMID: 39839136 Free PMC article. Review.
-
Genomic and Transcriptomic Signatures of SETD1A Disruption in Human Excitatory Neuron Development and Psychiatric Disease Risk.bioRxiv [Preprint]. 2025 Mar 28:2025.03.26.645419. doi: 10.1101/2025.03.26.645419. bioRxiv. 2025. PMID: 40196527 Free PMC article. Preprint.
References
-
- Tandon R, Gaebel W, Barch DM, Bustillo J, Gur RE, Heckers S, et al. Definition and description of schizophrenia in the DSM-5. Schizophr Res. 2013;150(1):3–10. - PubMed
-
- Carbon M, Correll CU. Thinking and acting beyond the positive: the role of the cognitive and negative symptoms in schizophrenia. CNS Spectr. 2014;19(Suppl 1):38–52 (quiz 35-7, 53). - PubMed
Publication types
MeSH terms
Substances
Grants and funding
- AZ 35-4223.10/8/State Ministry of Baden-Württemberg for Economic Affairs, Labour and Tourism
- AZ 35-4223.10/8/State Ministry of Baden-Württemberg for Economic Affairs, Labour and Tourism
- AZ 35-4223.10/8/State Ministry of Baden-Württemberg for Economic Affairs, Labour and Tourism
- AZ 35-4223.10/8/State Ministry of Baden-Württemberg for Economic Affairs, Labour and Tourism
- AZ 35-4223.10/8/State Ministry of Baden-Württemberg for Economic Affairs, Labour and Tourism
LinkOut - more resources
Full Text Sources
Medical
Research Materials
Miscellaneous
