. 2024 Oct 31;23(1):245.
doi: 10.1186/s12943-024-02114-8.

Cell-autonomous IL6ST activation suppresses prostate cancer development via STAT3/ARF/p53-driven senescence and confers an immune-active tumor microenvironment

Affiliations

Cell-autonomous IL6ST activation suppresses prostate cancer development via STAT3/ARF/p53-driven senescence and confers an immune-active tumor microenvironment

Christina Sternberg et al. Mol Cancer. .

Abstract

Background: Prostate cancer ranks as the second most frequently diagnosed cancer in men worldwide. Recent research highlights the crucial roles IL6ST-mediated signaling pathways play in the development and progression of various cancers, particularly through hyperactivated STAT3 signaling. However, the molecular programs mediated by IL6ST/STAT3 in prostate cancer are poorly understood.

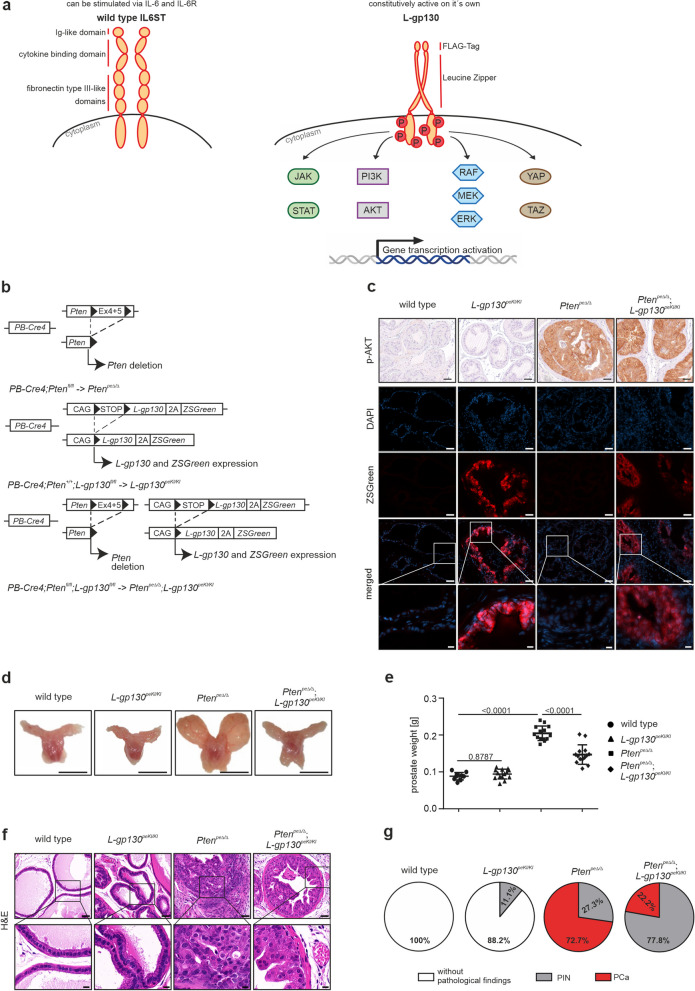
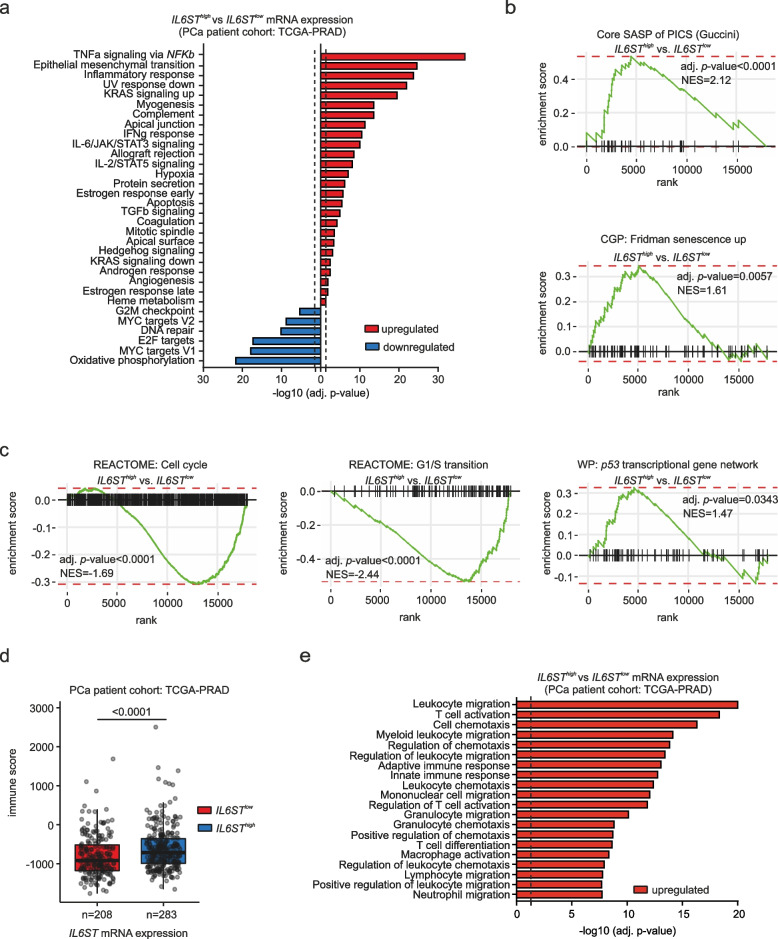
Methods: To investigate the role of IL6ST signaling, we constitutively activated IL6ST signaling in the prostate epithelium of a Pten-deficient prostate cancer mouse model in vivo and examined IL6ST expression in large cohorts of prostate cancer patients. We complemented these data with in-depth transcriptomic and multiplex histopathological analyses.

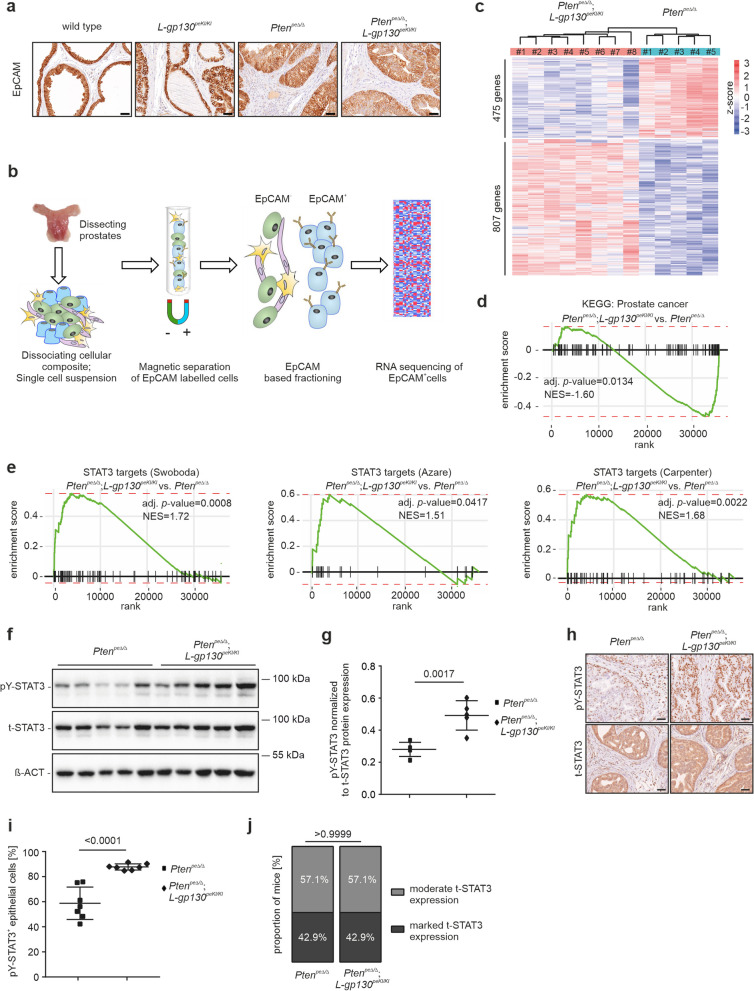
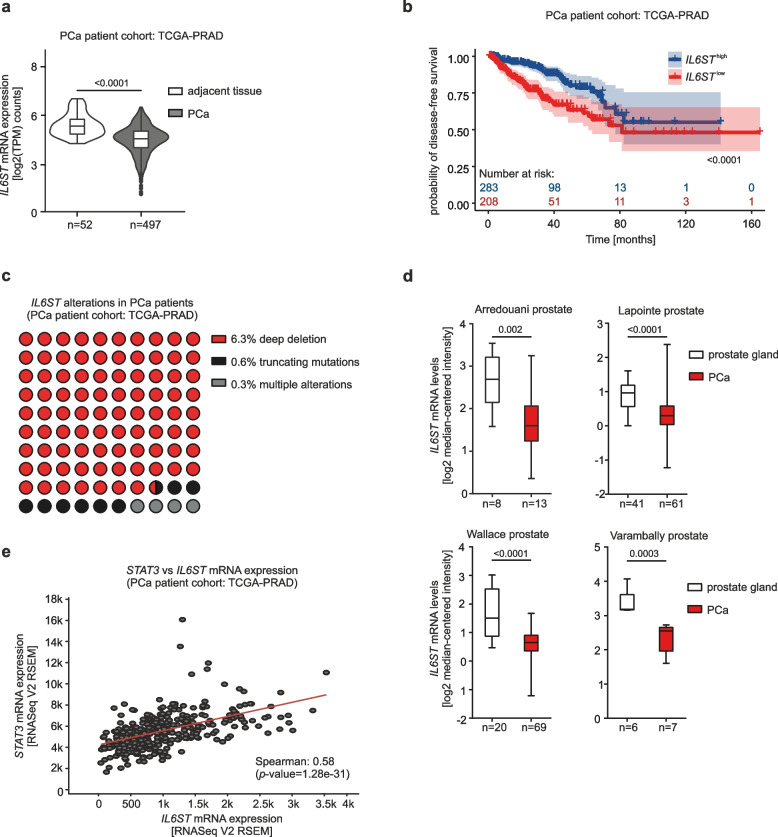
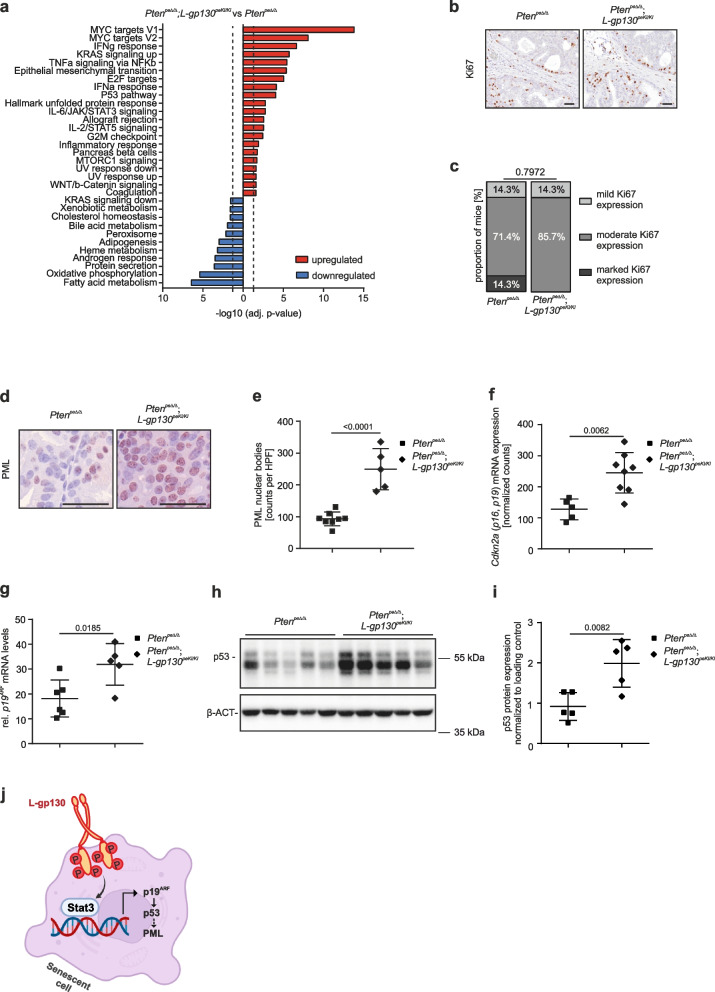
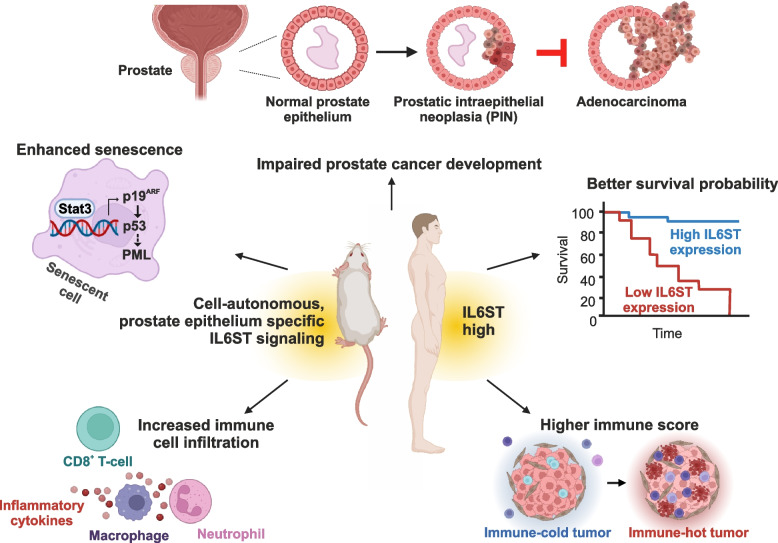
Results: Genetic cell-autonomous activation of the IL6ST receptor in prostate epithelial cells triggers active STAT3 signaling and significantly reduces tumor growth in vivo. Mechanistically, genetic activation of IL6ST signaling mediates senescence via the STAT3/ARF/p53 axis and recruitment of cytotoxic T-cells, ultimately impeding tumor progression. In prostate cancer patients, high IL6ST mRNA expression levels correlate with better recurrence-free survival, increased senescence signals and a transition from an immune-cold to an immune-hot tumor.

Conclusions: Our findings demonstrate a context-dependent role of IL6ST/STAT3 in carcinogenesis and a tumor-suppressive function in prostate cancer development by inducing senescence and immune cell attraction. We challenge the prevailing concept of blocking IL6ST/STAT3 signaling as a functional prostate cancer treatment and instead propose cell-autonomous IL6ST activation as a novel therapeutic strategy.

Keywords: Cytotoxic T-cells; IL6ST/STAT3 signaling; Immune cell infiltration; L-gp130; Prostate cancer; Senescence; Senescence-associated secretory phenotype; Tumor microenvironment.


Conflict of interest statement

The authors declare no competing interests.

Figures

Fig. 1
Fig. 1
Prostate epithelium-specific, cell-autonomous insertion of L-gp130 reduces progressive prostate tumorigenesis. a Illustration of wild type IL6ST receptor, which can be activated by binding of the IL-6 ligand and IL-6R receptor (left panel), and Leucine-gp130 (L-gp130) construct (right panel). Wild type IL6ST consists of an extracellular domain comprising an Ig-like domain, a cytokine binding domain, three fibronectin type III-like domains, a transmembrane domain, and a cytoplasmic domain. For generating L-gp130, wild type IL6ST was truncated 15 amino acids above the transmembrane domain and replaced by the leucine zipper region of the human c-JUN gene and a FLAG-Tag. L-gp130 expression can activate downstream signaling cascades identical to stimulated wild type IL6ST. P: phosphorylation. b Illustration of the genetic approach for conditional deletion of Pten (exon 4 + 5) or/and insertion of L-gp130-ZSGreen in prostate epithelial cells under the control of Probasin (PB) promoter after Cre-mediated recombination resulting in PB-Cre4;Ptenfl/fl;L-gp130+/+ (hereafter PtenpeΔ/Δ), PB-Cre4;Pten+/+;L-gp130fl/fl (hereafter L-gp130peKI/KI) and PB-Cre4;Ptenfl/fl;L-gp130fl/fl mice (hereafter PtenpeΔ/Δ;L-gp130peKI/KI). pe: prostate epithelium; fl: floxed site; ex: exon; 2A: 2A peptide; CAG: CAG promoter; KI: knock in; Δ: knock out. c Representative immunohistochemistry (IHC) pictures of phospho-AKT (p-AKT) and immunofluorescence (IF) pictures of co-stainings of ZSGreen (red) and DAPI (blue) in mouse prostates. DAPI is used as a nuclear stain. Scale bar: 40 µm. Scale bar of inset: 10 µm. d Gross anatomy of representative mouse prostates. Scale bar: 0.5 cm. e Prostate weight of wild type (n = 10), L-gp130peKI/KI (n = 14), PtenpeΔ/Δ (n = 14), and PtenpeΔ/Δ;L-gp130peKI/KI (n = 14) mice. Individual biological replicates are shown. Data are plotted as the means ± SD and p-values were determined by ordinary one-way ANOVA with Tukey’s multiple comparisons test. f Representative pictures of hematoxylin & eosin (H&E) stains of mouse prostates at low (top) and high (bottom) magnification. Scale bar upper panel: 60 µm, scale bar lower panel: 10 µm. g Quantification of histopathological analysis of prostate tissue from wild type (n = 9), L-gp130peKI/KI (n = 9), PtenpeΔ/Δ (n = 11), and PtenpeΔ/Δ;L-gp130peKI/KI (n = 9) mice in regards of histomorphological criteria for aggressive growth patterns: without pathological findings (white); PIN: prostate intraepithelial neoplasia (grey); PCa: prostate cancer (red)
Fig. 2
Fig. 2
L-gp130 leads to activation of the STAT3 transcription factor and STAT3 target gene expression. a Representative immunohistochemistry (IHC) pictures of mouse prostates stained for the epithelial marker EpCAM. Scale bar: 40 µm b RNA-Seq workflow showing processing and magnetic bead-based enrichment of EpCAM-positive (EpCAM+) mouse prostate tissue. Prostates were dissected and enzymatically and mechanically dissociated to generate single cell suspensions. Cells were labeled with biotinylated anti-EpCAM antibody and enriched from the bulk population using streptavidin-coated magnetic beads. EpCAM+ cells were subjected to RNA-Seq analysis. c Heatmap and number of differentially expressed genes (log2norm) based on adj. p-value ≤ 0.05 and fold change ≥ 2 cut-off values comparing PtenpeΔ/Δ and PtenpeΔ/Δ;L-gp130peKI/KI prostate epithelial cells (n ≥ 5). blue: downregulated, red: upregulated. d Fast pre-ranked gene set enrichment analysis (fGSEA) of the KEGG gene set “Prostate cancer” with genes regulated in PtenpeΔ/Δ;L-gp130peKI/KI compared to PtenpeΔ/Δ prostate epithelial cells. Genes sorted based on their Wald statistics are represented as vertical lines on the x-axis. NES: normalized enrichment score. e fGSEA of three previously published STAT3 target signatures (“STAT3 targets (Swoboda)”, “STAT3 targets (Azare)”, “STAT3 targets (Carpenter)”) with genes regulated in PtenpeΔ/Δ;L-gp130peKI/KI compared to PtenpeΔ/Δ prostate epithelial cells. Genes sorted based on their Wald statistics are represented as vertical lines on the x-axis. NES: normalized enrichment score. f Western Blot analysis of prostate protein lysates for phosphoTyrosine705-STAT3 (pY-STAT3) and total-STAT3 (t-STAT3) expression in PtenpeΔ/Δ and PtenpeΔ/Δ;L-gp130peKI/KI mice (n = 5). β-ACTIN (β-ACT) served as loading control. g Quantification of pY-STAT3 protein levels relative to t-STAT3 protein levels shown in f). h Representative pictures of IHC staining of pY-STAT3 and t-STAT3 expression in prostate sections of PtenpeΔ/Δ and PtenpeΔ/Δ;L-gp130peKI/KI mice. Scale bar: 40 µm. i-j Quantitative analysis of pY-STAT3 (i) and semi-quantitative analysis of t-STAT3 (j) IHC stainings shown in h) (n = 7). g,i-j Individual biological replicates are shown (g,i). Data are plotted as the means ± SD and p-values were determined by unpaired two-tailed Student’s t-tests (g,i) or Mann-Whitney test (j)
Fig. 3
Fig. 3
High IL6ST expression is significantly associated with low-risk groups and better recurrence-free survival in human PCa. a IL6ST gene expression in adjacent (n = 52) and PCa (n = 497) tissue in TCGA-PRAD data set. Statistical analysis of the two risk groups was determined by using the Mann–Whitney test. b Kaplan–Meier plot showing time of disease-free survival in months for IL6STlow and IL6SThigh risk groups of the TCGA-PRAD data set. Groups were assessed based on the maximally selected rank statistics. blue: high IL6ST expressing group, red: low IL6ST expressing group. The blue and red numbers above horizontal axis represent the number of patients. c Proportion of IL6ST alterations in the TCGA-PRAD data set. Mutation types: deep deletion (n = 21; red), truncating mutations (n = 2; black) and multiple alterations (n = 1; grey). One patient has simultaneous mutations. The data originate from cBioPortal. d IL6ST mRNA expression levels of four different data sets of PCa patient samples compared to healthy prostate sample control. Normalized data and statistical analyses were extracted from the Oncomine Platform. The respective prostate data set and n-numbers are indicated. Representation: boxes as interquartile range, horizontal line as the mean, whiskers as lower and upper limits. e Spearman-correlation analysis of IL6ST and STAT3 expression in TCGA-PRAD data set using cBioPortal analysis tool
Fig. 4
Fig. 4
Expression of L-gp130 induces p19ARF-p53-driven senescence in Pten-deficient PCa. a Fast pre-ranked gene set enrichment analysis (fGSEA) of significantly enriched HALLMARK gene sets with genes regulated in PtenpeΔ/Δ;L-gp130peKI/KI compared to PtenpeΔ/Δ prostate epithelial cells. Dotted line: adj. p-value (-log10(0.05)), blue: downregulated, red: upregulated; b Representative pictures of immunohistochemistry (IHC) staining of mouse prostates from the indicated genotypes stained for the proliferation marker Ki67. Scale bar: 40 µm. c Semi-quantitative analysis of Ki67+ prostate epithelial cells in the indicated genotypes (n = 7) shown in b). d Representative pictures of IHC staining of PML of PtenpeΔ/Δ and PtenpeΔ/Δ;L-gp130peKI/KI prostates. Scale bar: 40 µm. e Quantification of PML nuclear bodies per high power field (HPF) shown in d) (n ≥ 5). f Cdkn2a mRNA expression levels based on normalized counts from RNA-Seq analysis of PtenpeΔ/Δ and PtenpeΔ/Δ;L-gp130peKI/KI prostates (n ≥ 5). g qRT-PCR mRNA expression analysis of p19ARF in mouse prostate tissue of PtenpeΔ/Δ and PtenpeΔ/Δ;L-gp130peKI/KI mice (n ≥ 5). Signals are relative to the geometric mean of housekeeping genes. h Western Blot analysis of prostate protein lysates of PtenpeΔ/Δ and PtenpeΔ/Δ;L-gp130peKI/K mice (n = 5) for p53 expression. β-ACTIN (β-ACT) served as loading control. i Quantification of p53 protein levels shown in h) normalized to loading control. j Proposed model of IL6ST signaling induced senescence. L-gp130 activated STAT3 binds to its binding sites in Cdkn2a promoter, followed by upregulation of p19ARF and p53 expression promoting senescence in PCa. c,eg,i Individual biological replicates are shown (e–g,i). Data are plotted as the means ± SD and p-values were determined by Mann–Whitney test (c,f), unpaired two-tailed Student’s t-tests (e,g,i)
Fig. 5
Fig. 5
Expression of L-gp130 in PtenpeΔ/Δ mice increases infiltration of immune cells mediating anti-tumor defense. a Representative pictures of hematoxylin & eosin (H&E) stains (upper panel) showing immune infiltrate and quantification of histopathological analysis (lower panel) of prostate tissue from PtenpeΔ/Δ (n = 11) and PtenpeΔ/Δ;L-gp130peKI/KI (n = 9) mice in regards of infiltration (low-grade (grey) and high-grade (red)). Scale bar: 60 µm. b Representative pictures of immunofluorescence (IF) staining of CD45 (red) and DAPI (blue) of mouse prostates with indicated genotypes. DAPI is used as a nuclear stain. Scale bar: 20 µm. c Quantification of CD45+ cells of IF stainings shown in b) (n = 5). The percentage of positive cells relative to PtenpeΔ/Δ was calculated. d Representative pictures of immunofluorescence (IF) staining of CD3 (yellow), CD8 (green) and DAPI (blue) of mouse prostates with indicated genotypes. DAPI is used as a nuclear stain. Scale bar: 20 µm. e Quantification of CD3+;CD8+ cells in the epithelium of IF stainings shown in d) (n = 5). The percentage of positive cells in the prostate epithelium relative to PtenpeΔ/Δ was calculated. f Representative pictures of immunohistochemistry (IHC) staining of NimpR14 (higher panel) and F4/80 (lower panel) of mouse prostates with indicated genotypes. Scale bar: 40 µm. g-h) Quantification of NimpR14+ (g) and F4/80+ (h) cells in the prostate epithelium of IHC stainings shown in f) (n ≥ 6). The percentage of positive cells in the prostate epithelium relative to PtenpeΔ/Δ was calculated. i) Flow cytometry data showing mean fluorescence intensity (MFI) of F4/80+;Cd11b+ macrophages in PtenpeΔ/Δ and PtenpeΔ/Δ;L-gp130peKI/KI prostate tissue (n ≥ 3) for CD86, MHC class II, and CD206. j Representative flow cytomentry blots of data shown in i. k Representative pictures of IHC staining of CD3, NimpR14 and F4/80 (in presented order) of PtenpeΔ/Δ and PtenpeΔ/Δ;Stat3peΔ/Δ prostates. Scale bar: 40 µm. l Semi-quantitative analysis of CD3, NimpR14 and F4/80 IHC stainings shown in k) (n ≥ 3). c, e, g-i, l Individual biological replicates are shown (c,e,g-i). Data are plotted as the means ± SD and p-values were determined by unpaired two-tailed Student’s t-tests (c,e,g-i) or Mann–Whitney test (l)
Fig. 6
Fig. 6
IL6ST signaling in PCa patients actives STAT3 signaling and upregulates senescence, immune score and cytotoxicity. a Fast pre-ranked gene set enrichment analysis (fGSEA) of significantly enriched HALLMARK gene sets with genes regulated in IL6SThigh compared to IL6STlow expressing patients from the TCGA-PRAD data set. Dotted line: adj. p-value (-log10(0.05)), blue: downregulated, red: upregulated; b fGSEA of the previously described core SASP gene signature upon PICS “Core SASP of PICS (Guccini)” (upper panel) and the curated gene set, class chemical and genetic perturbations (CGP) “CGP: Fridman senescence up” (lower panel) with genes regulated in IL6SThigh compared to IL6STlow expressing patients from the TCGA-PRAD data set. Genes sorted based on their Wald statistics are represented as vertical lines on the x-axis. NES: normalized enrichment score. c fGSEA of WikiPathways (WP) gene sets “REACTOME: Cell cycle”, “REACTOME: G1/S transition” and “WP: p53 transcriptional gene network” with genes regulated in IL6SThigh compared to IL6STlow expressing patients from the TCGA-PRAD data set. Genes sorted based on their Wald statistics are represented as vertical lines on the x-axis. NES: normalized enrichment score. d Immune score from the ESTIMATE method for IL6STlow (red, n = 208) and IL6SThigh (blue, n = 283) patients from the TCGA-PRAD data set, compared with Mann–Whitney test. e fGSEA of the top 20 T-cell-, neutrophil-, and macrophage-associated Biological Processes from Gene Ontology pathways (GO-BP) gene sets with genes significantly regulated in IL6SThigh compared to IL6STlow expressing patients from the TCGA-PRAD data set. Dotted line: adj. p-value (-log10(0.05)), red: upregulated;
Fig. 7
Fig. 7
Proposed roles of active IL6ST signaling in prostate tumorigenesis. Using the genetic mouse model, we showed that cell-autonomous, prostate epithelium-specific and constitutively active IL6ST signaling reduces Pten-deficient tumor growth, enhances the STAT3/p19ARF/p53-driven senescence and recruits tumor-infiltrating immune cells (T-cells, neutrophils, and macrophages). In human PCa, high IL6ST expression causes active STAT3 signaling, correlates with better survival and is associated with higher level of immune infiltrates

Similar articles

  • JUN mediates the senescence associated secretory phenotype and immune cell recruitment to prevent prostate cancer progression.
    Redmer T, Raigel M, Sternberg C, Ziegler R, Probst C, Lindner D, Aufinger A, Limberger T, Trachtova K, Kodajova P, Högler S, Schlederer M, Stoiber S, Oberhuber M, Bolis M, Neubauer HA, Miranda S, Tomberger M, Harbusch NS, Garces de Los Fayos Alonso I, Sternberg F, Moriggl R, Theurillat JP, Tichy B, Bystry V, Persson JL, Mathas S, Aberger F, Strobl B, Pospisilova S, Merkel O, Egger G, Lagger S, Kenner L. Redmer T, et al. Mol Cancer. 2024 May 29;23(1):114. doi: 10.1186/s12943-024-02022-x. Mol Cancer. 2024. PMID: 38811984 Free PMC article.
  • STAT3 regulated ARF expression suppresses prostate cancer metastasis.
    Pencik J, Schlederer M, Gruber W, Unger C, Walker SM, Chalaris A, Marié IJ, Hassler MR, Javaheri T, Aksoy O, Blayney JK, Prutsch N, Skucha A, Herac M, Krämer OH, Mazal P, Grebien F, Egger G, Poli V, Mikulits W, Eferl R, Esterbauer H, Kennedy R, Fend F, Scharpf M, Braun M, Perner S, Levy DE, Malcolm T, Turner SD, Haitel A, Susani M, Moazzami A, Rose-John S, Aberger F, Merkel O, Moriggl R, Culig Z, Dolznig H, Kenner L. Pencik J, et al. Nat Commun. 2015 Jul 22;6:7736. doi: 10.1038/ncomms8736. Nat Commun. 2015. PMID: 26198641 Free PMC article.
  • Differential p53-independent outcomes of p19(Arf) loss in oncogenesis.
    Chen Z, Carracedo A, Lin HK, Koutcher JA, Behrendt N, Egia A, Alimonti A, Carver BS, Gerald W, Teruya-Feldstein J, Loda M, Pandolfi PP. Chen Z, et al. Sci Signal. 2009 Aug 18;2(84):ra44. doi: 10.1126/scisignal.2000053. Sci Signal. 2009. PMID: 19690330 Free PMC article.
  • IL-6/STAT3/ARF: the guardians of senescence, cancer progression and metastasis in prostate cancer.
    Pencik J, Wiebringhaus R, Susani M, Culig Z, Kenner L. Pencik J, et al. Swiss Med Wkly. 2015 Dec 21;145:w14215. doi: 10.4414/smw.2015.14215. eCollection 2015. Swiss Med Wkly. 2015. PMID: 26691865 Review.
  • Novel ARF/p53-independent senescence pathways in cancer repression.
    Chan CH, Gao Y, Moten A, Lin HK. Chan CH, et al. J Mol Med (Berl). 2011 Sep;89(9):857-67. doi: 10.1007/s00109-011-0766-y. Epub 2011 May 19. J Mol Med (Berl). 2011. PMID: 21594579 Free PMC article. Review.

Cited by

References

    1. Wang L, Lu B, He M, Wang Y, Wang Z, Du L. Prostate Cancer Incidence and Mortality: Global Status and Temporal Trends in 89 Countries From 2000 to 2019. Front Public Health. 2022;10:176. - PMC - PubMed
    1. del Pino-Sedeño T, Infante-Ventura D, de Armas CA, de Pablos-Rodríguez P, Rueda-Domínguez A, Serrano-Aguilar P, Trujillo-Martín MM. Molecular Biomarkers for the Detection of Clinically Significant Prostate Cancer: A Systematic Review and Meta-analysis. Eur Urol Open Sci. 2022;46:105–27. - PMC - PubMed
    1. Scherger AK, Al-Maarri M, Maurer HC, et al. Activated gp130 signaling selectively targets B cell differentiation to induce mature lymphoma and plasmacytoma. JCI Insight. 2019;4:e128435–e128435. - PMC - PubMed
    1. Golus M, Bugajski P, Chorbińska J, Krajewski W, Lemiński A, Saczko J, Kulbacka J, Szydełko T, Małkiewicz B. STAT3 and Its Pathways’ Dysregulation-Underestimated Role in Urological Tumors. Cells. 2022;11:3024. - PMC - PubMed
    1. Mora LB, Buettner R, Seigne J, et al. Constitutive activation of Stat3 in human prostate tumors and cell lines: Direct inhibition of Stat3 signaling induces apoptosis of prostate cancer cells. Cancer Res. 2002;62:6659–66. - PubMed

MeSH terms

Substances