. 2025 Jan;12(1):e2310308.
doi: 10.1002/advs.202310308. Epub 2024 Oct 31.

Inhibition of Glutamate-to-Glutathione Flux Promotes Tumor Antigen Presentation in Colorectal Cancer Cells

Affiliations

Inhibition of Glutamate-to-Glutathione Flux Promotes Tumor Antigen Presentation in Colorectal Cancer Cells

Tao Yu et al. Adv Sci (Weinh). 2025 Jan.

Abstract

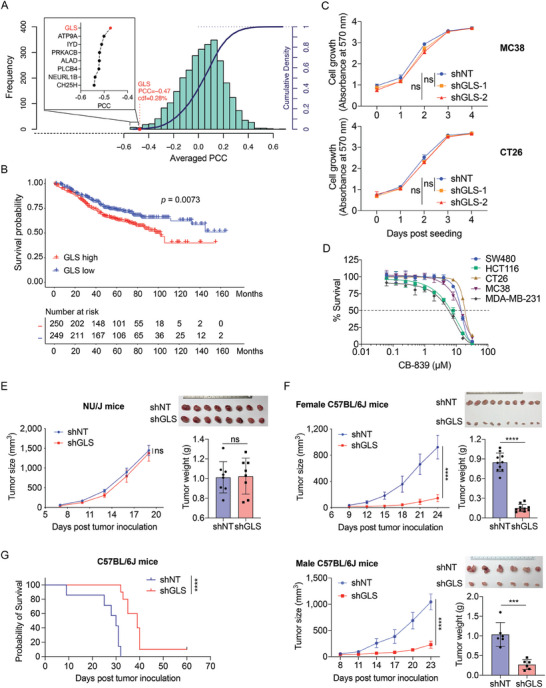
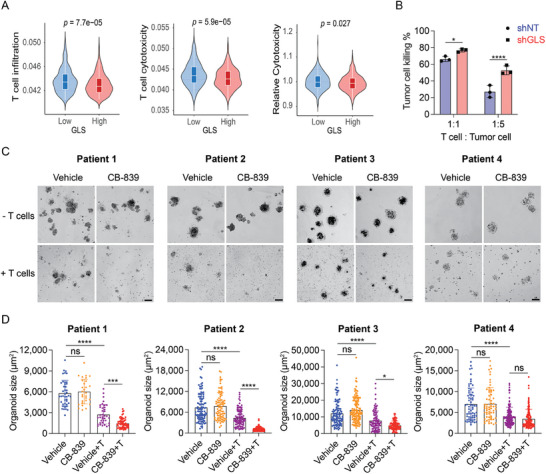
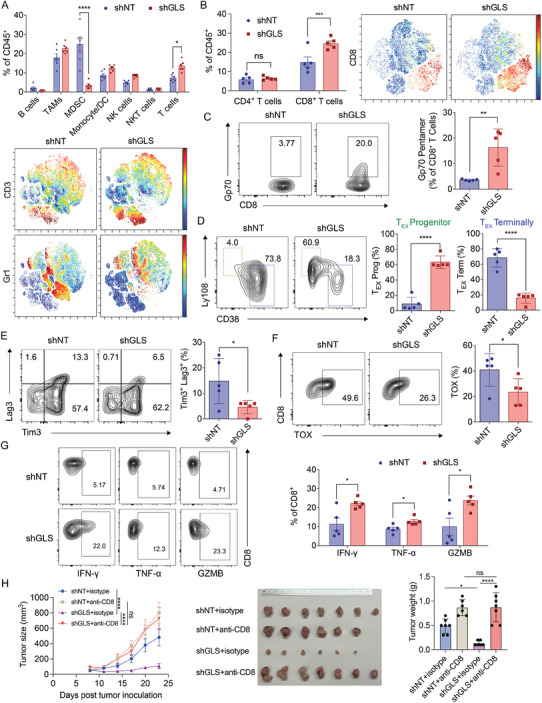
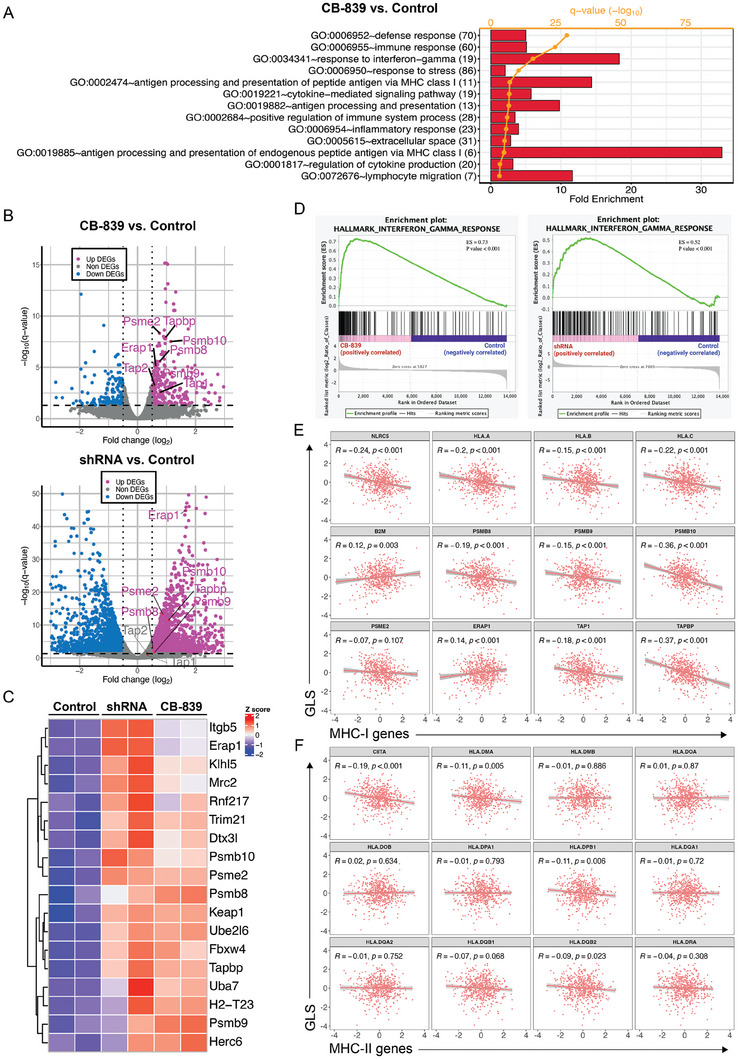
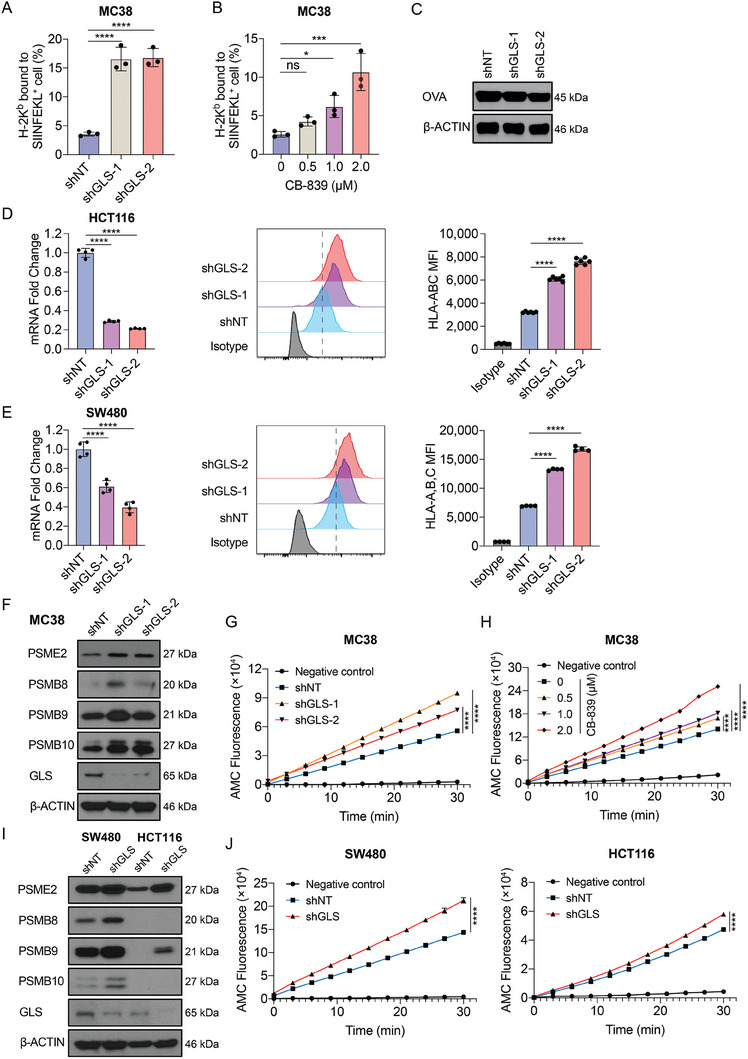
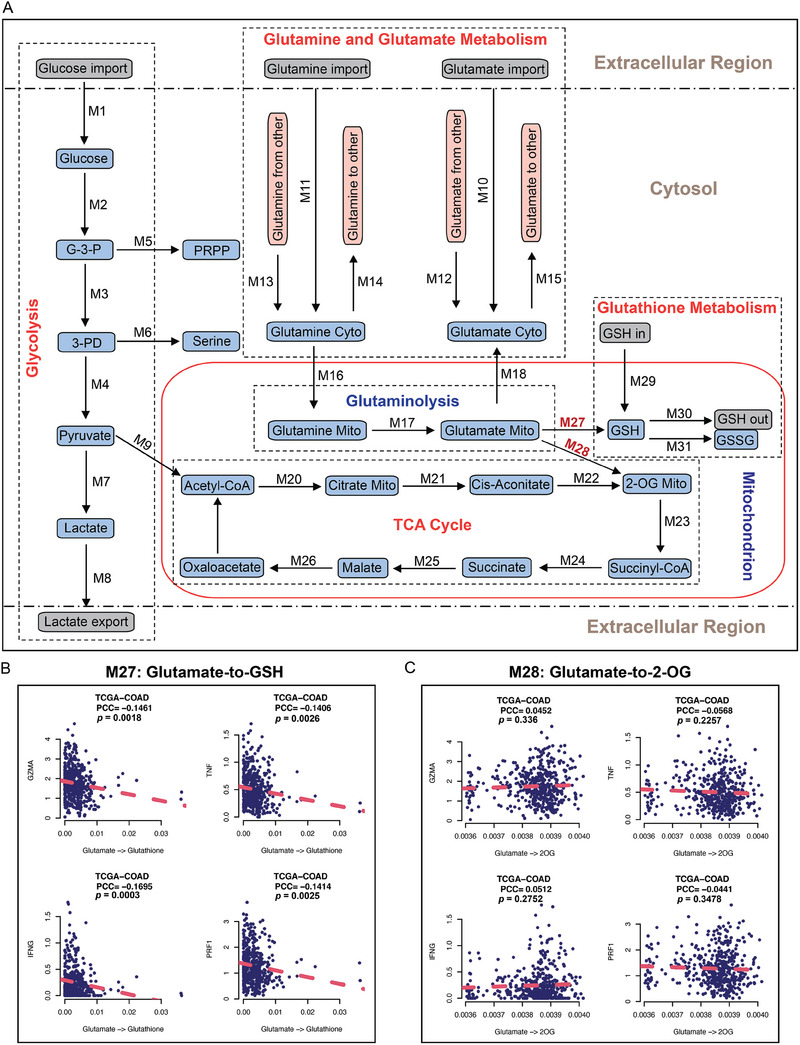
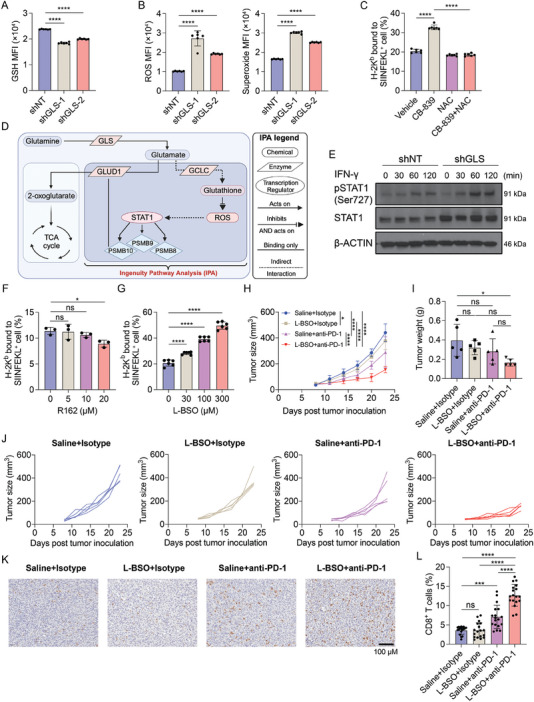
Colorectal cancer (CRC) cells display remarkable adaptability, orchestrating metabolic changes that confer growth advantages, pro-tumor microenvironment, and therapeutic resistance. One such metabolic change occurs in glutamine metabolism. Colorectal tumors with high glutaminase (GLS) expression exhibited reduced T cell infiltration and cytotoxicity, leading to poor clinical outcomes. However, depletion of GLS in CRC cells has minimal effect on tumor growth in immunocompromised mice. By contrast, remarkable inhibition of tumor growth is observed in immunocompetent mice when GLS is knocked down. It is found that GLS knockdown in CRC cells enhanced the cytotoxicity of tumor-specific T cells. Furthermore, the single-cell flux estimation analysis (scFEA) of glutamine metabolism revealed that glutamate-to-glutathione (Glu-GSH) flux, downstream of GLS, rather than Glu-to-2-oxoglutarate flux plays a key role in regulating the immune response of CRC cells in the tumor. Mechanistically, inhibition of the Glu-GSH flux activated reactive oxygen species (ROS)-related signaling pathways in tumor cells, thereby increasing the tumor immunogenicity by promoting the activity of the immunoproteasome. The combinatorial therapy of Glu-GSH flux inhibitor and anti-PD-1 antibody exhibited a superior tumor growth inhibitory effect compared to either monotherapy. Taken together, the study provides the first evidence pointing to Glu-GSH flux as a potential therapeutic target for CRC immunotherapy.

Keywords: MHC‐I antigen presentation; colorectal cancer; glutamine metabolism; immune checkpoint blockade; immunoproteasome; single‐cell flux estimation analysis.


Conflict of interest statement

The authors declare no conflict of interest.

Figures

Figure 1
Figure 1
Inhibition of GLS in tumor cells suppresses tumor growth in immunocompetent mice. A) The average Pearson correlation coefficient (PCC) between metabolic genes and T cell cytotoxicity from the nine CRC datasets was analyzed using the Inference of Cell Types and Deconvolution (ICTD). The histogram and the curve show the distribution and cumulative distribution function (cdf) of the PCC, respectively. The average PCC between GLS and T cell cytotoxicity was highlighted. The top 8 enzyme genes that were negatively associated with the relative cytotoxicity of T cells and their average PCC were shown. B) Kaplan–Meier survival curve from the GSE39582 (n = 505) dataset of CRC cases with high and low GLS expression (top and bottom 40%). C) Cell proliferation of MC38 and CT26 cell lines expressing control (shNT) or GLS shRNA (shGLS). The cell proliferation was determined using violet crystal staining at indicated time points. Data were presented as mean ± SD (n = 5) and analyzed using One‐way ANOVA and Dunnett's multiple comparisons test for the absorbance at the endpoint. D) Inhibition curves of CRC cell lines upon CB‐839 treatment, the dashed line indicates 50% survival of the cells. E,F) MC38 cells with control or GLS knockdown were inoculated subcutaneously into female NU/J mice (E), and female and male C57BL/6J mice (F). The tumor images and tumor weights were taken at the endpoint. The tumor sizes were measured at indicated time points. Data were analyzed using the unpaired two‐tailed t‐test for the tumor sizes and weights at the endpoint and presented as mean ± SD (E, n = 8; F, female mice n = 10; F, male mice n = 6). G) The overall survival of C57BL/6J mice orthotopically implanted with MC38 cells expressing shNT and shGLS. Data were analyzed using Log‐rank (Mantel–Cox) test, shNT, n = 7; shGLS, n = 10.
Figure 2
Figure 2
Inhibition of GLS in tumor cells enhances CD8+ T cell cytotoxicity. A) The Violin Plots represent the tumor infiltration, cytotoxicity, and relative cytotoxicity level of CD8+ T cells in human CRC cases with high or low GLS expression levels. The GSE39582 dataset was used for the analysis. The unpaired two‐tailed t‐test was used for statistical analysis. B) CD8+ T cell cytotoxicity assay. CD8+ T cells were isolated from OT‐I mouse, activated with mouse CD3/CD28 beads and murine IL‐2, and then co‐cultured with MC38 cells that expressed control/GLS shRNA and luciferase and were preloaded with SIINFEKL (OVA) peptides. The tumor cell killing was measured 16 h post‐co‐culture using luciferase assay. Data were analyzed using the unpaired two‐tailed t‐test and presented as mean ± SD (n = 3). C,D) Patient‐derived organoid killing assay. Autologous CD8+ T cells were isolated from the patient tissue and activated in vitro with human CD3/CD28 beads and IL‐2. The organoids were treated with CB‐839 at 2 µM for 2 days and then co‐cultured with or without the CD8+ T cells for 24 h. Representative images (scale bar = 100 µm) of the organoids were shown in (C), and the sizes of the organoids were quantified using Image J (D). Data were presented as mean ± SD. Data were analyzed using ordinary one‐way ANOVA and Tukey's multiple comparisons test (n = 30–100 organoids).
Figure 3
Figure 3
Inhibition of GLS in tumor cells potentiates the CD8+ T cell‐mediated immune responses in mice. A) Flow cytometry analysis of tumor microenvironment changes in MC38 control and GLS‐KD tumors. Data were analyzed using two‐way ANOVA and Sidak's multiple comparisons test (n = 6; presented as mean ± SEM). Representative results of t‐distributed stochastic neighbor embedding (t‐SNE) representation of CD3 and Gr1 positive cells in control and GLS‐KD tumors are shown at the bottom. B) The percentages of CD4+ and CD8+ T cells in the abovementioned tumors were analyzed using two‐way ANOVA and Sidak's multiple comparisons test (n = 5; presented as mean ± SEM). Representative results of t‐SNE representation of CD8 positive cells in control and GLS‐KD tumors are shown on the right. C) Flow cytometry analysis of the tumor‐specific CD8+ T cells. Representative contour plots of Gp70 on CD8+ T cells were shown (left) and the data were analyzed (right) using the unpaired two‐tailed t‐test (n = 5; data displayed as mean ± SD). D) Representative contour plots of Ly108 and CD38 markers on CD8+ T cells with quantification. TEX, exhausted T cells. Data were analyzed using the unpaired two‐tailed t‐test (n = 5; presented as mean ± SD). E) Representative contour plots of Lag3 and Tim3 markers on CD8+ T cells with quantification. Data were analyzed using the unpaired two‐tailed t‐test (n = 5; presented as mean ± SD). F) Representative contour plots of TOX on CD8+ T cells with quantification. Data were analyzed using the unpaired two‐tailed t‐test (n = 5; presented as mean ± SD). G) CD8+ T cells isolated from MC38‐derived control and GLS‐KD tumors were analyzed by flow cytometry for their activity indicated by interferon‐gamma (IFN‐γ), tumor necrosis factor‐alpha (TNF‐α), and granzyme B (GZMB) levels in the cells. Data were analyzed using the unpaired two‐tailed t‐test (n = 5; presented as mean ± SEM). H) MC38 cells with control or GLS knockdown were inoculated subcutaneously into female C57BL/6J mice. The isotype and anti‐CD8 antibodies were administrated two days before the tumor cell inoculation and three times a week throughout the experiment. The tumor sizes were measured at indicated time points and data were analyzed using two‐way ANOVA and Turkey's multiple comparisons test. The tumor images and tumor weights were taken at the endpoint and data were analyzed using one‐way ANOVA and Tukey's multiple comparisons test. Data were presented as mean ± SD (n = 7 for shNT+isotype and shGLS+anti‐CD8; n = 6 for shNT+anti‐CD8 and shGLS+isotype).
Figure 4
Figure 4
Inhibition of GLS in tumor cells enhances the expression of immunoproteasome genes. A) Gene ontology pathway analysis of mRNA‐seq data for control and CB‐839 treated MC38 cells. B) Volcano plot analysis of mRNA‐seq data from CB‐839 versus the control group and shGLS versus the control group. Genes of interest (immunoproteasome genes) were labeled. C) Heatmap of expression of genes that were involved in antigen presentation pathway. D) Gene signature analysis for IFN‐γ responses of mRNA‐seq data from CB‐839 versus control and shGLS versus control groups. E) Correlation analysis of GLS and MHC‐I‐mediated antigen presentation genes using the Colorectal Adenocarcinoma (TCGA, PanCancer Atlas) dataset. F) Correlation analysis of GLS and MHC‐II‐mediated antigen presentation genes using the Colorectal Adenocarcinoma (TCGA, PanCancer Atlas) dataset.
Figure 5
Figure 5
Inhibition of GLS activates immunoproteasome and enhances tumor antigen presentation. A) H‐2Kb mediated SIINFEKL (OVA) presentation in control or GLS‐KD MC38 cells was determined by flow cytometry. Data were analyzed using One‐way ANOVA and Dunnett's multiple comparisons test and presented as mean ± SD (n = 3). B) H‐2Kb mediated SIINFEKL (OVA) presentation in control or MC38‐OVA cells treated with CB‐839 at the indicated doses was determined by flow cytometry. Data were analyzed using one‐way ANOVA and Dunnett's multiple comparisons test and presented as mean ± SD (n = 3). C) Ovalbumin (OVA) overexpression levels in MC38 cells with control or GLS KD were determined by Western blotting, and β‐ACTIN was used as a loading control. D,E) GLS mRNA expression levels were determined using qPCR. Cell surface HLA‐A,B,C levels were determined using flow cytometry in control and shGLS expressing human CRC cell lines. Data were analyzed using One‐way ANOVA and Dunnett's multiple comparisons test and presented as mean ± SD (n = 6 for HCT116; n = 4 for SW480). F) Protein expression levels of immunoproteasome genes were determined by Western blotting in control and GLS‐KD MC38 cells G) Immunoproteasome activities of control and GLS‐KD MC38 cells were determined. Data were analyzed using the unpaired two‐tailed t‐test for the fluorescence at the endpoint and presented as mean ± SD (n = 3). H) Immunoproteasome activities were determined in control and CB‐839‐treated MC38 cells at the indicated doses. Data were analyzed using the unpaired two‐tailed t‐test for the fluorescence at the endpoint and presented as mean ± SD (n = 3). I) Protein expression levels of immunoproteasome genes were determined by Western blotting in control and GLS‐KD human CRC cells. J) Immunoproteasome activities were determined in control and GLS‐KD human CRC cells. Data were analyzed using the unpaired two‐tailed t‐test for the fluorescence at the endpoint and presented as mean ± SD (n = 3).
Figure 6
Figure 6
In silico metabolic flux analysis reveals the role of glutamate‐to‐GSH flux in regulating T cell cytotoxicity. A) Schematic diagram of the metabolic pathways, labeling with metabolic flux identifier numbers (Mx). B,C) The correlation between the metabolic flux analysis of glutamate‐to‐GSH (M27) (B), and glutamate‐to‐2‐OG (M28) (C) with the expression levels of CD8+ T cell effector marker genes.
Figure 7
Figure 7
Targeting Glu‐GSH flux enhances tumor antigen presentation and sensitizes CRC to anti‐PD‐1 therapy. A,B) GSH levels (A) and ROS and superoxide levels (B) were determined by flow cytometry in shNT and shGLS‐expressing MC38 cells. Data were analyzed using One‐way ANOVA and Dunnett's multiple comparisons test and presented as mean ± SD (n = 6). C) H‐2Kb mediated OVA presentation levels in MC38‐OVA cells treated with CB‐839 and/or NAC were determined by flow cytometry. Data were analyzed using one‐way ANOVA and Tukey's multiple comparisons test and presented as mean ± SD (n = 6). D) Ingenuity Pathway Analysis (IPA) pathway builder was used to construct the signaling pathways that connect ROS to the immunoproteasomes. The illustration was created with BioRender.com. E) Phosphorylated STAT1 and total STAT1 protein levels were determined using Western blotting in shNT and shGLS MC38 cells treated with IFN‐γ at the indicated time points, and β‐ACTIN was used as a loading control. F) H‐2Kb mediated OVA presentation levels in MC38‐OVA cells treated with R162 at the indicated doses were determined by flow cytometry. Data were analyzed using one‐way ANOVA and Dunnett's multiple comparisons test and presented as mean ± SD (n = 3), G) H‐2Kb mediated OVA presentation levels in MC38‐OVA cells treated with L‐BSO at indicated doses were determined and analyzed as in F). Data were presented as mean ± SD (n = 6). H–J) MC38 tumor growth in C57BL/6J mice. MC38 cells were inoculated subcutaneously into C57BL/6 mice. The tumor‐bearing mice were treated as indicated. The tumor sizes were monitored (H). The tumor weights (I) were taken at the endpoint. The growth curve of each tumor is shown in (J). (H) was analyzed using two‐way ANOVA and Tukey's multiple comparisons test, and (I) was analyzed using one‐way ANOVA and Tukey's multiple comparisons test, data were presented as mean ± SD (n = 5). K,L) Immunohistochemical staining of CD8 and the quantification in the tumors from the indicated four groups. One representative image from each group was shown. The quantification was analyzed using Image J on 18 images of each group. Data were analyzed using one‐way ANOVA, and Tukey's multiple comparisons test, presented as mean ± SD.

References

    1. Siegel R. L., Wagle N. S., Cercek A., Smith R. A., Jemal A., CA Cancer J Clin. 2023, 73, 233. - PubMed
    1. a) Aparicio J., Esposito F., Serrano S., Falco E., Escudero P., Ruiz‐Casado A., Manzano H., Fernandez‐Montes A., J Clin Med. 2020, 9, 3889; - PMC - PubMed
    2. b) Kuipers E. J., Grady W. M., Lieberman D., Seufferlein T., Sung J. J., Boelens P. G., van de Velde C. J., Watanabe T., Nat. Rev. Dis. Primers 2015, 1, 15065. - PMC - PubMed
    1. Venderbosch S., Nagtegaal I. D., Maughan T. S., Smith C. G., Cheadle J. P., Fisher D., Kaplan R., Quirke P., Seymour M. T., Richman S. D., Meijer G. A., Ylstra B., Heideman D. A., de Haan A. F., Punt C. J., Koopman M., Clin. Cancer Res. 2014, 20, 5322. - PMC - PubMed
    1. Marcus L., Lemery S. J., Keegan P., Pazdur R., Clin. Cancer Res. 2019, 25, 3753. - PubMed
    1. Jhunjhunwala S., Hammer C., Delamarre L., Nat. Rev. Cancer 2021, 21, 298. - PubMed

LinkOut - more resources