. 2024 Oct 1;27(11):111068.
doi: 10.1016/j.isci.2024.111068. eCollection 2024 Nov 15.

Deciphering craniopharyngioma subtypes: Single-cell analysis of tumor microenvironment and immune networks

Affiliations

Deciphering craniopharyngioma subtypes: Single-cell analysis of tumor microenvironment and immune networks

Tatsuma Matsuda et al. iScience. .

Abstract

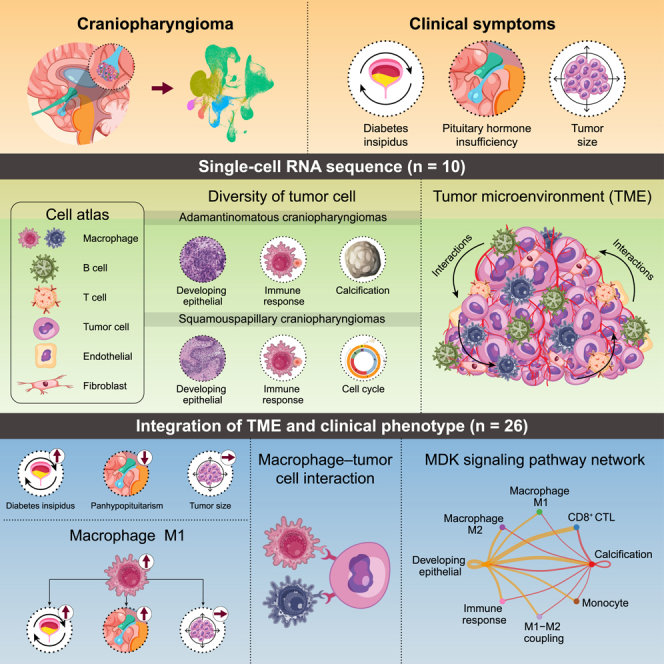
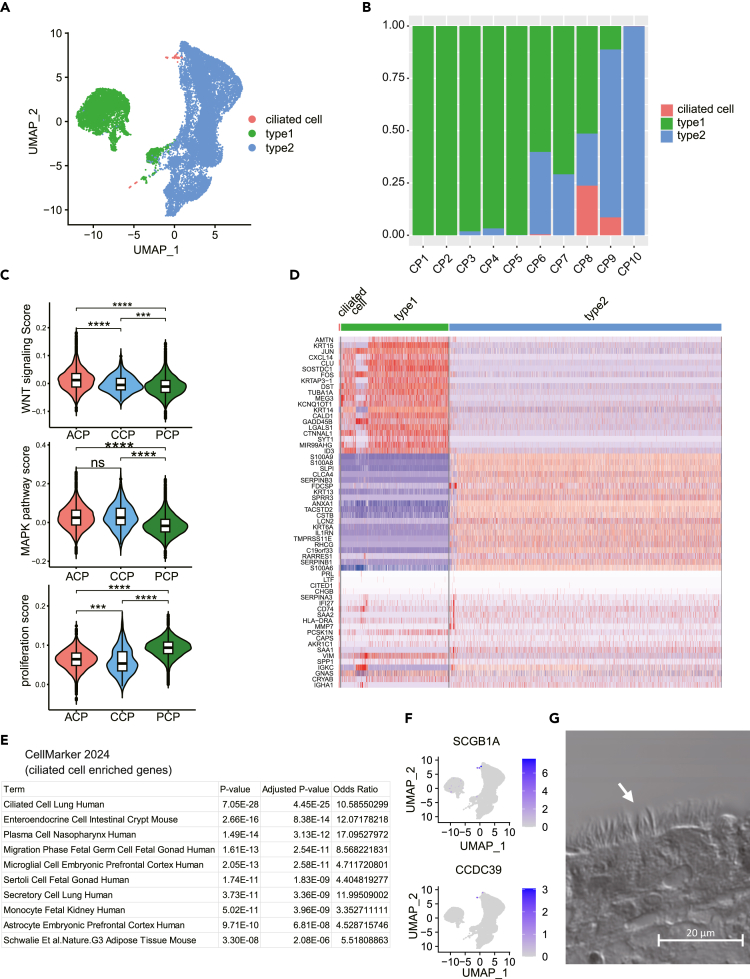
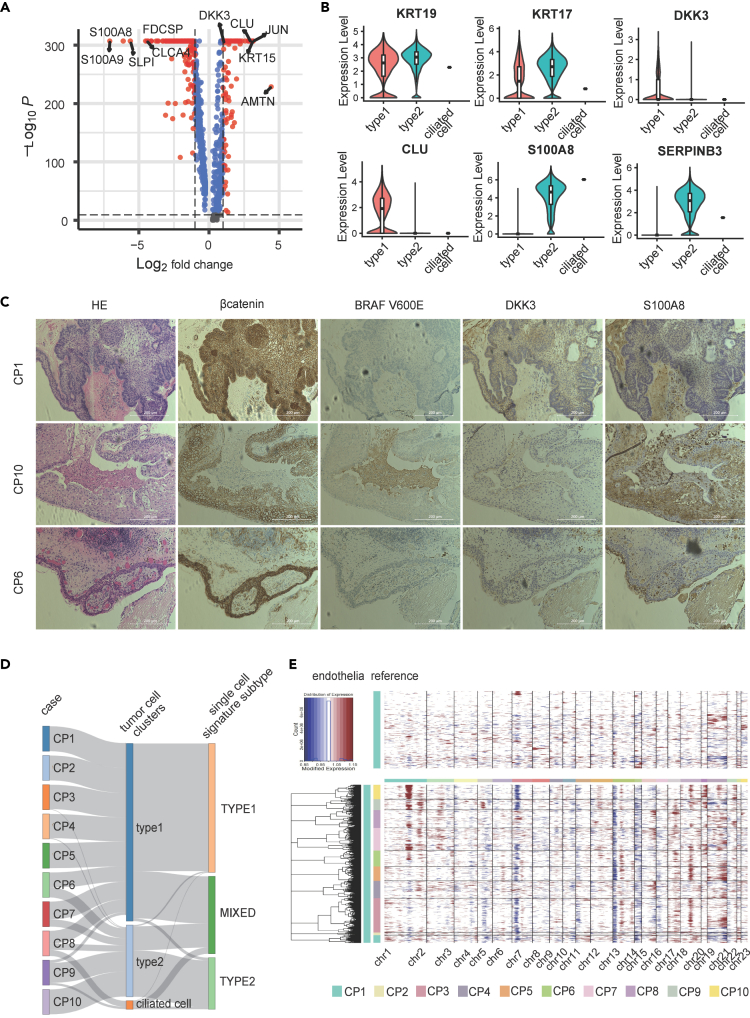
Craniopharyngiomas, including adamantinomatous (ACP) and squamous papillary (PCP) types, are challenging to treat because of their proximity to crucial pituitary structures. This study aimed to characterize the cellular composition, tumor tissue diversity, and cell-cell interactions in ACPs and PCPs using single-cell RNA sequencing. Single-cell clustering revealed diverse cell types, further classified into developing epithelial, calcification, and immune response for ACP and developing epithelial, cell cycle, and immune response for PCP, based on gene expression patterns. Subclustering revealed the enrichment of classical M1 and M2 macrophages in ACP and PCP, respectively, with high expression of pro-inflammatory markers in classical M1 macrophages. The classical M1 and M2 macrophage ratio significantly correlated with the occurrence of diabetes insipidus and panhypopituitarism. Cell-cell interactions, particularly involving CD44-SPP, were identified between tumor cells. Thus, we developed a comprehensive cell atlas that elucidated the molecular characteristics and immune cell inter-networking in ACP and PCP tumor microenvironments.

Keywords: Cancer; Transcriptomics.


Conflict of interest statement

The authors declare no competing interests.

Figures

None
Graphical abstract
Figure 1
Figure 1
Patient clinical information and cell annotation (A) Among the 10 patients with craniopharyngioma, seven had adamantinomatous craniopharyngioma (ACP), two had squamous papillary craniopharyngioma (PCP), and one had ciliated craniopharyngioma (CCP). (B) Approximately 192,520 cells were clustered using the first 15 principal components (PC15) as determined using the ElbowPlot results, with a 0.1 resolution setting. (C) Histogram depicting the overall and individual case-specific cellular tumor composition ratios. (D) Feature plot of representative marker genes used for cell type annotation: KRT8 for tumor cells, PTPRC for immune cells, VWF for endothelial cells, and COL1A1 for fibroblasts. (E) Dot plot of representative marker genes used for cell type annotation: KRT14, KRT17, and KRT18 for tumor cells; COL1A1, COL1A2, and DCN for fibroblasts; VWF, PECAM1, and AQP1 for endothelial cells; PTPRC, IL7R, GZMK, and MS4A1 for immune cells. (F) Feature plot displaying the scores added based on gene sets for keratin and Wnt signaling pathway-related genes. Each score was assigned using the AddModuleScore function of the Seurat R package.
Figure 2
Figure 2
Subclustering of tumor cells (A) Tumor cells were predominantly segregated into type 1 and type 2 tumor cells, with a small cluster of ciliated cells observed. (B) Histogram depicting the composition ratio of tumor cell subtypes for each case. (C) Violin plots representing the scores assigned based on gene sets related to the Wnt signaling pathway, MAPK pathway, and cell proliferation. Each score was assigned using the AddModuleScore function of the Seurat R package. The accompanying boxplot shows the interquartile range, and the line inside represents the median.(∗∗∗∗: p ≤ 0.0001, ∗∗∗: p ≤ 0.001, ∗∗: p ≤ 0.01, ∗: p ≤ 0.1, ns: not significant). (D) Heatmap of gene expression for the top 10 genes based on log2FC among differentially expressed genes (DEGs) in each tumor cell cluster and for genes universally expressed across all tumor cell clusters. DEGs were identified using a threshold of Log2FC > 0.25 and expression >25% of cells of each type, using the FindAllMarkers function of the Seurat package. (E) Cell type annotation of the ciliated cell cluster based on DEGs (Descartes Cell Type and Tissue 202110). (F) Featureplots for the expression of ciliated cell-associated genes. (G) Histological image of CP8 (ciliated craniopharyngioma: CCP) indicating cilia (white arrow). Scarl bar, 20μm.
Figure 3
Figure 3
Comparison between type 1 and type 2 tumor cells and diagnostic marker identification (A) Volcano plot displaying DEGs between type 1 and 2 tumor cells. DEGs were identified using the FindAllMarkers function of the Seurat R package, with a threshold of Log2FC > 0.25 and expression in more than 25% of cells in each type. Genes upregulated in type 1 and type 2 tumor cells are displayed on the right and left, respectively. Genes with Log2FC > 1 are highlighted in red. (B) Violin plots depicting the expression comparison of genes highly specific to each tumor cell type. The accompanying boxplot shows the interquartile range, and the line inside represents the median. (C) Immunostaining results for highly specific markers. Scale bar, 200 μm. (D) Sankey plot depicting the distribution of tumor cell types in individual cases, displayed as the percentage of each tumor cell type for each case. (E) Copy number variation (CNV) inferred for each tumor cell using immune cells as a reference, calculated using the inferCNV R package. Each row represents a single cell.
Figure 4
Figure 4
Heterogeneity of adamantinomatous craniopharyngioma (ACP) tumor cells and biological characteristics and transcription factors of each subtype (A) Uniform Manifold Approximation and Projection (UMAP) of ACP tumor cells revealing three distinct tumor subtypes, color-coded by subtype classification. (B) Histogram depicting the composition ratio of ACP tumor cell subtypes, overall and for each case. (C) Heatmap of gene expression for the top 10 genes based on log2FC among differentially expressed genes (DEGs) in each ACP tumor cell subtype. DEGs were identified using a threshold of log2FC > 0.25 and expression in more than 25% of cells of each type using the FindAllMarkers function of the Seurat R package. (D) Violin plots displaying the scores assigned from gene sets of biological processes indicative of each subtype characteristics. Each score was assigned using the AddModuleScore function of the Seurat package. The accompanying boxplot shows the interquartile range, and the line inside represents the median. (∗∗∗∗: p ≤ 0.0001, ∗∗∗: p ≤ 0.001, ∗∗: p ≤ 0.01, ∗: p ≤ 0.1, ns: not significant). (E) Scatterplot displaying enriched biological process terms for module 2 (developing epithelial), module 4 (immune response), module 5 (calcification). (F) Featureplot depicting the activity of transcription factors specific to each ACP tumor cell subtype, as determined using SCENIC.
Figure 5
Figure 5
Heterogeneity of papillary craniopharyngioma (PCP) tumor cells and biological characteristics and transcription factors of each subtype (A) Uniform Manifold Approximation and Projection (UMAP) of PCP tumor cells revealing three distinct tumor subtypes, color-coded by subtype classification. (B) Histogram displaying the composition ratio of PCP tumor cell subtypes, overall and for each case. (C) Heatmap of gene expression for the top 10 genes based on log2FC among differentially expressed genes (DEGs) in each PCP tumor cell subtype. DEGs were identified using a threshold of Log2FC > 0.25 and expression in more than 25% of cells of each type using the FindAllMarkers function of the Seurat R package. (D) Featureplot displaying expressions of the proliferation markers MKI67, TOP2A, CENPF and MCM6. (E) Scatterplot displaying enriched biological process terms for module 1 (developing epithelia), module 2 (immune response), and module 4 (cell cycle). (F) Scatterplot with the proliferation score on the vertical axis and the immune response score on the horizontal axis. The dot color indicates different tumor cell subtypes in PCP. Each score was assigned using the gene sets for module 2 (immune response) and module 4 (cell cycle) using the AddModuleScore function of the Seurat package. (G) Featureplot depicting the activity of transcription factors specific to each PCP tumor cell subtype, as determined using SCENIC.
Figure 6
Figure 6
Subtyping of tumor-associated macrophages (TAMs) and their impact on clinical symptoms (A) Uniform Manifold Approximation and Projection (UMAP) of myeloid cell color-coded by subtype (monocyte/macrophage M1/macrophage M2). (B) The dot plot displays the expression of marker genes common to myeloid cells and those specific to subtypes. (C) Histogram displaying the composition ratio of myeloid subtypes by type. (D) Scatterplot with M1 and M2 scores on the horizontal and vertical axes, respectively. Dot color corresponds to the myeloid subtypes presented in Figure 6A. Graph quadrants are defined as classical M1, classical M2, M1-M2 coupling, and monocyte. Each score was assigned using the AddModuleScore function of the Seurat R package. (E) Violin plot displaying the expressions of immune-related genes. (∗∗∗∗: p ≤ 0.0001, ∗∗∗: p ≤ 0.001, ∗∗: p ≤ 0.01, ∗: p ≤ 0.1, ns: not significant, cM1: classical M1, cM2: classical M2, coupling: M1-M2 coupling. (F) Dot plot illustrating the impact of calculated macrophage type (CMT) ratios on clinical phenotypes. Ratios are categorized as high or low; both correlation coefficients and p-values were calculated. The correlation coefficients were determined using Pearson’s method. cM1: classical M1, cM2: classical M2. (G) Boxplot depicting the percentage of M1 in 10 single-cell cases and an additional 16 cases assessed through immunohistochemistry, categorized by clinical phenotype. The accompanying boxplot shows the interquartile range, and the line inside represents the median. Each case was photographed in 10 fields of view, excluding those with numerous artifacts or obvious staining defects. Eight fields of view were selected per case for counting positive cells. (H) Immunostaining images of macrophage markers. The scale bar is 100 μm.
Figure 7
Figure 7
Complex cellular interactions within the tumor microenvironment of craniopharyngiomas Role of cell-cell interactions (sender and receiver) among different cell types in (A), adamantinomatous craniopharyngioma (ACP) and (B), papillary craniopharyngioma (PCP). (C) Interactions between tumor cells and macrophages in ACP. The size of the dot representing each cell type indicates the number of cells. The thickness of the line connecting the dots indicates the signal magnitude. (D) Interactions between tumor cells and macrophages in PCP. The size of the dot representing each cell type indicates the number of cells, and the thickness of the line connecting the dots indicates the signal magnitude. (E) Dot plot and interactions displaying the expression of receptors/ligands among different cell types in ACP. The upper section displays signals sent from each tumor cell subtype to each calculated macrophage type (CMT) type. The lower section denotes signals sent from each CMT type to each tumor cell subtype. Lines connecting signatures represent signals. (F) Dot plot and interactions depicting the expression of receptors/ligands among different cell types in ACP. The upper section shows signals sent from each tumor cell subtype to each CMT type. Lower section shows signals sent from each CMT type to each tumor cell subtype. Lines connecting signatures represent signals.

References

    1. Rindi G., Mete O., Uccella S., Basturk O., La Rosa S., Brosens L.A.A., Ezzat S., de Herder W.W., Klimstra D.S., Papotti M., Asa S.L. Overview of the 2022 WHO Classification of Neuroendocrine Neoplasms. Endocr. Pathol. 2022;33:115–154. doi: 10.1007/s12022-022-09708-2. - DOI - PubMed
    1. Sekine S., Shibata T., Kokubu A., Morishita Y., Noguchi M., Nakanishi Y., Sakamoto M., Hirohashi S. Craniopharyngiomas of adamantinomatous type harbor β-catenin gene mutations. Am. J. Pathol. 2002;161:1997–2001. doi: 10.1016/s0002-9440(10)64477-x. - DOI - PMC - PubMed
    1. Brastianos P.K., Taylor-Weiner A., Manley P.E., Jones R.T., Dias-Santagata D., Thorner A.R., Lawrence M.S., Rodriguez F.J., Bernardo L.A., Schubert L., et al. Exome sequencing identifies BRAF mutations in papillary craniopharyngiomas. Nat. Genet. 2014;46:161–165. doi: 10.1038/ng.2868. - DOI - PMC - PubMed
    1. Jiang Y., Yang J., Liang R., Zan X., Fan R., Shan B., Liu H., Li L., Wang Y., Wu M., et al. Single-cell RNA sequencing highlights intratumor heterogeneity and intercellular network featured in adamantinomatous craniopharyngioma. Sci. Adv. 2023;9 doi: 10.1126/sciadv.adc8933. - DOI - PMC - PubMed
    1. Anderson N.M., Simon M.C. The tumor microenvironment. Curr. Biol. 2020;30:R921–R925. doi: 10.1016/j.cub.2020.06.081. - DOI - PMC - PubMed

LinkOut - more resources