. 2024 Oct 17:15:1444777.
doi: 10.3389/fimmu.2024.1444777. eCollection 2024.

Humanized CXCL12 antibody delays onset and modulates immune response in alopecia areata mice: insights from single-cell RNA sequencing

Affiliations

Humanized CXCL12 antibody delays onset and modulates immune response in alopecia areata mice: insights from single-cell RNA sequencing

Seungchan An et al. Front Immunol. .

Abstract

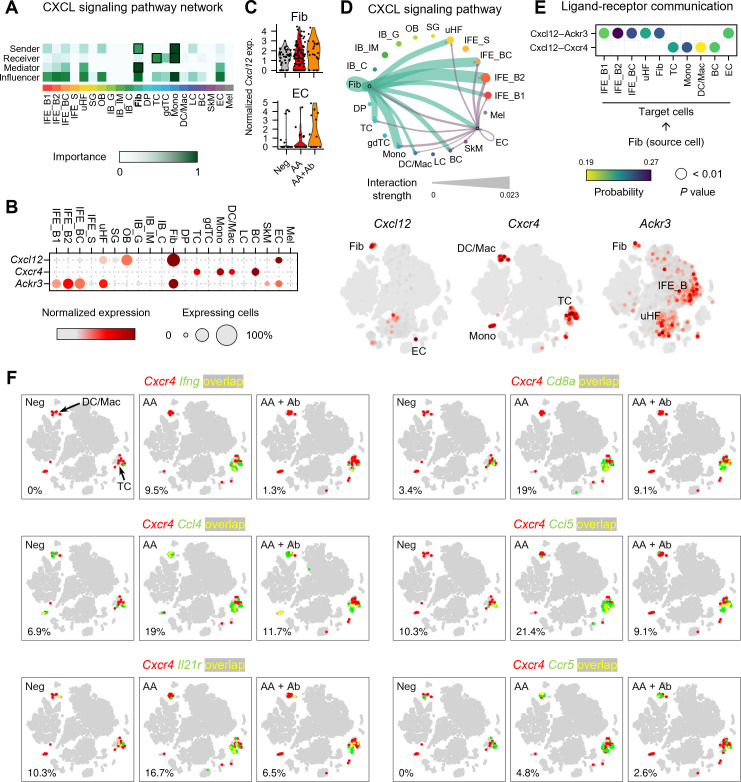
It has been demonstrated that CXCL12 inhibits hair growth via CXCR4, and its neutralizing antibody (Ab) increases hair growth in alopecia areata (AA). However, the molecular mechanisms have not been fully elucidated. In the present study, we further prepared humanized CXCL12 Ab for AA treatment and investigated underlying molecular mechanisms using single-cell RNA sequencing. Subcutaneous injection of humanized CXCL12 Ab significantly delayed AA onset in mice, and dorsal skin was analyzed. T cells and dendritic cells/macrophages were increased in the AA model, but decreased after CXCL12 Ab treatment. Pseudobulk RNA sequencing identified 153 differentially expressed genes that were upregulated in AA model and downregulated after Ab treatment. Gene ontology analysis revealed that immune cell chemotaxis and cellular response to type II interferon were upregulated in AA model but downregulated after Ab treatment. We further identified key immune cell-related genes such as Ifng, Cd8a, Ccr5, Ccl4, Ccl5, and Il21r, which were colocalized with Cxcr4 in T cells and regulated by CXCL12 Ab treatment. Notably, CD8+ T cells were significantly increased and activated via Jak/Stat pathway in the AA model but inactivated after CXCL12 Ab treatment. Collectively, these results indicate that humanized CXCL12 Ab is promising for AA treatment via immune modulatory effects.

Keywords: CD8 + T cell; CXCL12; alopecia areata; humanized antibody; interferon-gamma.


Conflict of interest statement

Authors MZ and J-HS were employed by Epi Biotech Co., Ltd. The remaining authors declare that the research was conducted in the absence of any commercial or financial relationships that could be construed as a potential conflict of interest.

Figures

Figure 1
Figure 1
scRNA-seq of CXCL12 Ab-treated AA mouse model. (A) Workflow of scRNA-seq analysis. (B–D) t-SNE representation of scRNA-seq results from (B) Neg, (C) AA, and (D) AA + Ab groups, colored by annotated cell types. (E) Expression levels for selected marker genes of each cell type. (F) Proportion of each cell type among total cells for each group. (G–I) Proportion of (G) immune cells, (H) T cells, and (I) DC/Mac among total cells for each group. Statistical significance was assessed using the binomial test. *P < 0.05, ***P < 0.001.
Figure 2
Figure 2
Pseudobulk RNA-seq analysis of CXCL12 Ab-treated AA mouse model. (A, B) Identification of DEGs: (A) Neg vs. AA and (B) AA vs. AA + Ab. Genes with a more than twofold increase are shown in red, and those with a decrease are shown in blue, with the number of each DEG indicated. (C) Heatmap showing the normalized Z-scores of all DEGs. (D) Venn diagram depicting the identification of 153 DEGs (AA up & AA + Ab down). (E) STRING network based on protein-protein interactions of the 153 DEGs. (F) Three major clusters are identified from community detection based on weighted edge betweenness. (G) Gene ontology (GO) enrichment analysis results for each cluster. Significant results with P value < 0.001 are shown. (H) Pre-ranked GSEA results using log2 fold change from each comparison as input.
Figure 3
Figure 3
Expression profile of CXCL12 and its receptors in the AA mouse model. (A) Heatmap showing the relative importance of each cell type based on network centrality measures calculated from the CXCL signaling network using CellChat. (B) Expression levels of Cxcl12 and genes of its receptors Cxcr4 and Ackr3. (C) Normalized expression of Cxcl12 in fibroblasts and ECs of each group. (D) Interaction strength between various cell types within the CXCL signaling pathway. The thickness of the lines connecting cell types is proportional to the calculated interaction strength. (E) Significant ligand-receptor pairs contributing to Cxcl12 signaling from fibroblasts. Dot color and size represent calculated communication probability and P values from a one-sided permutation test. (F) Coexpression patterns of Cxcr4 with DEGs related to immune cell activation in each group. In the t-SNE representation, cells expressing Cxcr4 are shown in red, cells expressing Ifng, Cd8a, Ccl4, Ccl5, Il21r, or Ccr5 are shown in green, and cells expressing both are shown in yellow. The percentage at the bottom left represents the proportion of cells expressing both Cxcr4 and the selected genes among Cxcr4-expressing cells.
Figure 4
Figure 4
T cell subpopulations in the AA mouse model. (A) t-SNE representation of T cell subpopulations colored by detailed cell types. (B) Expression levels for selected marker genes of each cell type. (C) t-SNE representation of T cells colored by group (Neg, AA, or AA + Ab). (D) Proportion of each cell type among total T cells. Statistical significance was assessed using the binomial test. *** P < 0.001. (E) Pseudotime analysis of naïve-like T cells and CD8+ T cells. ‘s’ indicates the designated starting point (root) on the trajectory constructed based on UMAP representation. (F) Expression levels of selected marker genes over pseudotime. (G) Density of cells at each pseudotime by group. (H) Coexpression patterns of Cd8a with Jak/Stat-related genes in each group. In the t-SNE representation, cells expressing Cd8a are shown in red, cells expressing Jak2, Stat3, or Stat5a are shown in green, and cells expressing both are shown in yellow. The percentage at the bottom left represents the proportion of cells expressing both Cd8a and the selected genes among Cd8a-expressing cells.

References

    1. Janssens R, Struyf S, Proost P. Pathological roles of the homeostatic chemokine CXCL12. Cytokine Growth Factor Rev. (2018) 44:51–68. doi: 10.1016/j.cytogfr.2018.10.004 - DOI - PubMed
    1. Lu L, Li J, Jiang X, Bai R. CXCR4/CXCL12 axis: “old” pathway as “novel” target for anti-inflammatory drug discovery. Med Res Rev. (2024) 44:1189–220. doi: 10.1002/med.22011 - DOI - PubMed
    1. Karin N. The multiple faces of CXCL12 (SDF-1alpha) in the regulation of immunity during health and disease. J Leukoc Biol. (2010) 88:463–73. doi: 10.1189/jlb.0909602 - DOI - PubMed
    1. Cambier S, Gouwy M, Proost P. The chemokines CXCL8 and CXCL12: molecular and functional properties, role in disease and efforts towards pharmacological intervention. Cell Mol Immunol. (2023) 20:217–51. doi: 10.1038/s41423-023-00974-6 - DOI - PMC - PubMed
    1. Garcia-Cuesta EM, Santiago CA, Vallejo-Díaz J, Juarranz Y, Rodríguez-Frade JM, Mellado M. The role of the CXCL12/CXCR4/ACKR3 axis in autoimmune diseases. Front Endocrinol (Lausanne). (2019) 10:585. doi: 10.3389/fendo.2019.00585 - DOI - PMC - PubMed

MeSH terms