[Preprint]. 2024 Oct 16:rs.3.rs-5237916.
doi: 10.21203/rs.3.rs-5237916/v1.

NINJ1 regulates plasma membrane fragility under mechanical tension

Affiliations

NINJ1 regulates plasma membrane fragility under mechanical tension

Yunfeng Zhu et al. Res Sq. .

Update in

  • NINJ1 regulates plasma membrane fragility under mechanical strain.
    Zhu Y, Xiao F, Wang Y, Wang Y, Li J, Zhong D, Huang Z, Yu M, Wang Z, Barbara J, Plunkett C, Zeng M, Song Y, Tan T, Zhang R, Xu K, Wang Z, Cai C, Guan X, Hammack S, Zhang L, Shi Z, Xiang FL, Shao F, Xu J. Zhu Y, et al. Nature. 2025 Aug;644(8078):1088-1096. doi: 10.1038/s41586-025-09222-5. Epub 2025 Jun 9. Nature. 2025. PMID: 40490006 Free PMC article.

Abstract

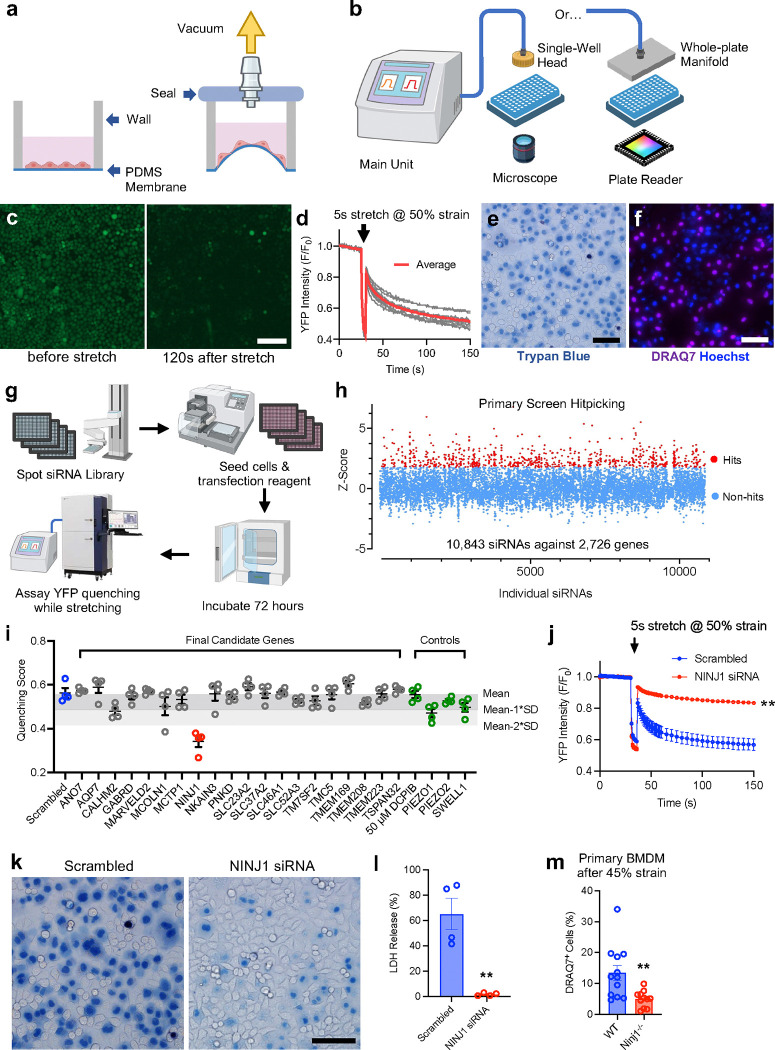
Plasma membrane integrity is vital not only for cell survival but also nearly all aspects of cell functioning1. Mechanical stress can cause plasma membrane damage2, but it is not known whether there are large molecules (proteins) that control plasma membrane integrity. Here we constructed a 384-well cellular stretch system that delivers precise, reproducible mechanical strain to adherent cells. Using the system, we screened 10,843 siRNAs targeting 2,726 multi-pass transmembrane proteins for stretch-induced membrane permeability changes. The screen identified NINJ1, a protein recently proposed to regulate pyroptosis and other lytic cell death3,4, as the top hit. We demonstrate that NINJ1 is a critical regulator for mechanical force-induced plasma membrane rupture (PMR), without the need of stimulating any cell death programs. Low NINJ1 expression renders the membrane more resistant to stretching, while high expression of NINJ1 lowers the threshold of PMR under mechanical strain. NINJ1 level on the plasma membrane is inversely correlated to tension required to rupture the membrane. In the pyroptosis context, NINJ1 on its own is not sufficient to fully rupture the membrane, and additional mechanical stress is required for full PMR. Our work establishes that NINJ1 functions as a bona fide determinant of membrane biomechanical properties. Our study also suggests that PMR across tissues of distinct mechanical environments is subjected to fine tuning by differences in NINJ1 expression and external mechanical forces.


Conflict of interest statement

Competing Interests J.B., C.P. and S.H are employees of Novartis Biomedical Research. F.S. is the scientific founder and chair of the scientific advisory board of Pyrotech Therapeutics. Other authors declare no competing final interest.

Figures

Extended Data Fig. 1
Extended Data Fig. 1. The mechanical characterization of the high-throughput cellular stretch system.
a, The image of the HT cellular stretch system. The main unit features a touch-screen user interface. It connects to the either a vacuum head for single well use on inverted microscopes, or a whole-plate manifold for use with fluorescence plate imagers for high-throughput experiments. b, Finite element analysis of the PDMS membrane under different vacuum levels showed the strain pattern across the whole well. The strain pattern was largely uniform in the center, with slightly higher strain in the corners. The edges showed significantly higher strain, but it is outside of the measuring area of most plate imagers, therefore does not impose a problem in a real-world screening exercise. c, Illustration of the bead imagery assay utilized to empirically estimate the strain values with the formula shown. d, The bead images before stretch (gray) and at −30 kPa (magenta) were overlayed. d is the distance of the bead from the center of the well at the resting state, and d’ is the distance of the same bead from the center in the stretched state. e, Estimated strain values at different vacuum levels from the bead imagery analysis.
Extended Data Fig. 2
Extended Data Fig. 2. Characterization of quenching response of HeLa-YFP stable cells to mechanical strain.
a, HeLa-YFP cells were subjected to stretches of 5s duration at a series of strain levels. Data are mean ± s.e.m.. Each trace is from 150~200 cells from n=3 to 4 wells per group. b, The inhibition curve of the DCPIB, a non-specific chloride channel inhibitor, on the quenching of YFP induced by 5s stretch at 40% strain. Each data point is presented as the mean ± s.e.m. from ~200 cells of each condition. c, The inhibition curve of the DCPIB on the quenching induced by 5s stretch at 50% strain. Each data point is presented as the mean ± s.e.m. from ~220 cells of each condition. Half-inhibition concentration at both strain levels were derived from the curves and noted.
Extended Data Fig. 3
Extended Data Fig. 3. Characterization of Ninj1−/− KO mice.
a, The mortality rate of the Ninj1−/− mice within 2 months from birth. b, The relative NINJ1 mRNA levels from the spleen of WT and Ninj1−/− mice. n=4 animals per genotype. Data are mean ± s.e.m.. ** p<0.01 vs WT.
Extended Data Fig. 4
Extended Data Fig. 4. Overexpression of NINJ1 by CMV promoter drastically increases NINJ1 protein level in HEK-293T cells.
a, LDH release from the vector-transfected HEK-293T cells and the cells overexpressing human NINJ1-IRES-mCherry driven by the CMV promoter. LDH assay was conducted 24 h after transfection. n=3 trials for each group, ** p<0.01 vs Vector. b, Relative mRNA level of control HEK-293T cells and CMV-NINJ1 transfected cells at 24 h post-transfection. n=3 for each group. ** p<0.01 vs Vector. c, Immunoblot of NINJ1 on an SDS-PAGE gel of HEK-293T cells with no-transfection (no Tx), transfected with vector or CMV-NINJ1-IRES-mCherry. Cell lysate were collected 24 h post-transfection and immunoblotted using a polyclonal human NINJ1 antibody. GAPDH was used as loading control. d, Confocal image of HEK cells overexpressing NINJ1-mCherry fusion under the CMV promoter showing high intensity of fluorescence located to the ER and plasma membrane. Fluorescent puncta were visible (arrowheads) and plasma membrane ballooning were evident in some cells (arrows) 24 h post-transfection. NINJ1 was visualized with direct mCherry fluorescence. Nuclei were live stained with Hoechst. Scale bar, 25 μm.
Extended Data Fig. 5
Extended Data Fig. 5. Measurement of relative NINJ1 protein levels in HeLa and ZOS cells.
a, The full image of the immunoblot of NINJ1 from HeLa and ZOS cells on a SDS-PAGE gel. 3 replicates were done for each cell line. b, the quantification of relative protein levels of NINJ1 in HeLa and ZOS cells.
Extended Data Fig. 6
Extended Data Fig. 6. The pyroptotic THP-1 mostly maintain its ballooned morphology after induction of pyroptosis in the absence of mechanical stress stimulation.
The THP-1 cells were treated with 5 μg/ml Nigericin and stained for plasma membrane (CellBrite, red), nuclei of cells with compromised membrane (DRAQ7, yellow) and all nuclei (Hoechst, blue) 48 hours later. Cells with permeabilized plasma membrane showed DRAQ7/Hoechst double staining, represented in white. Scale bar, 50 μm.
Extended Data Fig. 7
Extended Data Fig. 7. NINJ1 facilitates full PMR under mechanical stress in intracellular LPS induced cell death.
a, NINJ1 KO and parental THP-1 cells were electroporated with LPS and stained with CellBrite (red), DRAQ7 (yellow) and Hoechst (blue) at 1h, 8h, 16h and 24h after LPS treatment. Almost all cells showed DRAQ7 staining, indicating large gaps or openings on the plasma membrane, yet still displayed intact ballooned shape without full rupture. b, Quantification of LDH release, percentage of DRAQ7+ cells and percentage of ballooned cells at various time points after electroporation of LPS. n=3 for each group. No difference was observed between NINJ1 KO and parental cells. c, NINJ1 KO and parental THP-1 cells were electroporated with LPS 1 hour before being subjected to flow treatment at various shear rates from 829 s−1 to 2073 s−1. The cells were stained as previously described. A significantly lower percentage of NINJ1 KO cells show DRAQ7+/Hoechst+ bare nuclei, indicative of full rupture of the plasma membrane, after being subjected to mechanical stress exerted by fluid flow. Scale bar, 25 μm.
Extended Data Fig. 8
Extended Data Fig. 8. NINJ1 does not significantly affect full PMR under mechanical stress in LLO induced cell death.
a, NINJ1 KO and parental THP-1 cells were treated with 500 ng/ml LLO and stained with CellBrite (red), DRAQ7 (yellow) and Hoechst (blue) at 1h, 2h, 8h, 12h and 24h later. b, Quantification of LDH release, percentage of DRAQ7+ cells and DRAQ7+ cells with bare nuclei at various time points after LLO treatment. NINJ1 KO cells showed significantly lower LDH release compared to WT in all time points. It also showed significantly fewer cells with bare nuclei (indicative of full ruptured membrane) at 1h post LLO treatment, but was similar to WT from 2h onwards. n=3 for each group. ** p<0.01 vs parental. c, NINJ1 KO and parental THP-1 cells were treated with LLO for 1h before being subjected to flow treatment at the shear rate 829 s−1. After 30 min of flow stimulation, the cells were stained as previously described. Both KO and parental cells showed high full rupture rate. No significant difference was observed between the genotypes. All Scale bars, 25 μm.
Fig. 1
Fig. 1. High-throughput genetic screen identifies NINJ1 as a regulator of plasma membrane rupture induced by mechanical stretch.
a, The operating principle of the HT stretch system. Adherent cells are cultured on the optical quality PDMS membrane on the bottom of the multi-well assay plate. The well is sealed from the top. When vacuum is applied, the PDMS membrane bulges into the well and expands, applying mechanical strain to the cells adhered on top. b, The system was designed to be modular and easy to configure for either microscope use for one well at a time, or for a plate reader to record all wells simultaneously. c, HeLa cells stably expressing anion-sensitive YFP displayed fluorescence reduction after the application of mechanical stretch of 50% strain. Image shown were from immediately before and 120 s after the application of stretch. Scale bar, 150 μm. d, The YFP intensity decreased to half of the original level at 120 s after stretch. Each trace was from average fluorescence of one well from the 10 wells assayed. e, f, Post-stretch trypan blue and DRAQ7/Hoechst staining showed that ~50% of the cells had compromised plasma membrane. Scale bars, 100 μm. g, The workflow of the siRNA screen for genes regulating stretch-induced membrane damage. h, Scattered plot showed the overview of the primary screen covering 2,726 genes encoding multi-pass transmembrane proteins. Each dot was the data from one individual well corresponding to one of the 10,843 siRNAs used. Red dots were primary hits using >1.5 Z-score as the cutoff. Primary hit rate is 6.69%. i, The last round of reconfirmation with the 20 final candidate genes and a selection of 4 control genes showed that NINJ1 was the sole hit of this screen. j, Fluorescence quenching of HeLa-YFP cells induced by a 5 s stretch at 50% strain. Cells were transfected with a pool of 4 siRNAs against NINJ1 or scrambled control and stretched 72 h after. n=4 trials for each group. k, Trypan Blue staining of control and NINJ1 knockdown cells showed reduced plasma membrane rupture events induced by mechanical strain. Scale bar, 100 μm. l, LDH release from the control HeLa cells and the HeLa cells with NINJ1 knocked down. n=4 trials for each group. m, The percentage of DRAQ7+ primary BMDMs from Ninj1−/− mice and WT littermates after the application of 5 s stretch at 45% strain. Each data point is from 100~200 cells in one of the stretched wells. For each genotype, primary BMDMs were isolated and pooled from 4 animals. Unless otherwise noted, all data are mean ± s.e.m.. ** p<0.01 vs respective control groups.
Fig. 2
Fig. 2. NINJ1 renders the plasma membrane susceptible to rupture under mechanical tension.
a, Relative NINJ1 mRNA levels of HEK-293T parental cells and the cells stably expressing NINJ1 driven by a Doxycycline-inducible TRE3G promoter. mRNAs were extracted and measured 24 h after induction by Doxycycline of various doses. N=4, ** p< 0.01 vs parental cells b, Confocal image of TRE3G-NINJ1-mCherry HEK stable cells with no induction or induction by 100 ng/ml Doxycycline for 24 h. Fluorescent puncta were apparent after induction (arrowheads). Scale bar, 10 μm. c, HEK parental cells or TRE3G-NINJ1-mCherry stable cells were treated with Doxycycline at various doses to induce NINJ1 expression, then mechanical strain was applied at 24h post-induction. PMR events were measured by DRAQ7+ staining. n=3~4 trials from a total of 300~500 cells per group. d, The relative NINJ1 mRNA level of HeLa and ZOS cells were determined by qPCR. 3 trials were conducted for each group. e, the immunoblot of NINJ1 from HeLa and ZOS cells on a SDS-PAGE gel. 3 replicates were done for each cell line (The full gel images are in Extended Data Fig. 5). f, The percentage of DRAQ7+ HeLa and ZOS cells were quantified 30 min after stretches of various strain levels. Stretches were 5s in duration. Data are from 3–6 trials. A total of 300~500 cells were analyzed for each group. ** p<0.01 vs HeLa. g, The relative NINJ1 mRNA levels from a collection of the human osteosarcoma cell lines. n=3 trials for each group. ** p<0.01 vs HeLa. h, The percentage of DRAQ7+ osteosarcoma cell lines were quantified 30 min after stretches at 55% strain. Stretches were 5s in duration. Data are from 3 trials. A total of 300~400 cells per group were analyzed for each group. ** p<0.01 vs HeLa. i, Single clones of 143B cells were picked by serial dilution and subjected to mRNA level measurement by qPCR followed by stretch test at 55% strain and DRAQ7 staining. 18 clones were isolated and tested. A total of 300~400 cells were analyzed for each clone. Unless otherwise noted, all data are mean ± s.e.m..
Fig. 3
Fig. 3. NINJ1 level inversely-correlates with the tension required to rupture the plasma membrane.
a, HeLa cells expressing NINJ1-mCherry fusion were treated with 2mM NEM to induce giant plasma membrane vesicle (GPMV) formation. A micropipette was used to capture the GPMVs and apply increasing negative pressure until the vesicle ruptures. b, GPMVs with high levels of NINJ1 ruptured at lower pressure during aspiration protocol than the ones with low levels of NINJ1. NINJ1 was visualized by fluorescence from mCherry fused at C-terminal of the protein. Fluorescently labeled GPI was used to visualize the membrane. Scale bar, 10 μm. c, The trace of a representative NINJ1high vesicle and a NINJ1low one, showing the volume changes during the aspiration protocol. d, The correlation of lysis tension of GPMVs and the NINJ1 protein level on the membrane, as indicated by the intensity of mCherry fluorescence. 28 vesicles harboring WT NINJ1, and 13 vesicles with K45Q NINJ1 (a mutated version with reduced activity) were tested.
Fig. 4
Fig. 4. NINJ1 weakens the plasma membrane and facilitate PMR under mechanical stress during lytic cell deaths.
a, THP-1 cells were treated with 5 μg/ml Nigericin to induce pyroptosis. Plasma membrane was visualized by CellBrite (red). DRAQ7 (yellow) was used to label the nuclei of cells with compromised plasma membrane (permeabilized cells). b, LDH release, percentage of DRAQ7+ cells, and percentage of the ballooned cells were measured at 2, 4, 6, 16 and 24h after Nigericin treatment. n=3, ** p<0.01 vs control. c, Parental and NINJ1 KO THP-1 cell were treated with 5 μg/ml Nigericin. In addition to CellBrite (red) and DRAQ7 (yellow), Hoechst (blue) was used to label all nuclei regardless of the state of the plasma membrane. Permeabilized cells were the ones with DRAQ7+/Hoechst+ nuclei (represented in white). Non-permeabilized cells displayed Hoechst+ nuclei (in blue). d, LDH release, percentage of the DRAQ7+ and the ballooned cells of parental and NINJ1 KO cells were quantified at 2, 4, 6, 16 and 24h after Nigericin treatment. n=3, ** p<0.01 vs parental. e, Work flow of the experiment testing the effect of mechanical stress on PMR in pyroptotic THP-1 cells. f, Diagram adapted from Papaioannou et al. showing the estimated shear rate in various vessel beds in humans. g, Pyroptotic THP-1 cells were stained with CellBrite (red) and DRAQ7 (yellow), after applying flow stimulation at different shear rates for 30 minutes. Cells were treated with 5 μg/ml Nigericin 2 h before the onset of flow. Arrowheads in the 414 s−1 and the 2073 s−1 panel denotes the DRAQ7+ THP-1 cells with bare nuclei without apparent CellBrite staining surrounding them, indicating the cells with fully ruptured plasma membrane. Arrowheads were not added for other panels to reduce image clutter. h, Quantification of full PMR events after applying flow of different shear rates. i, Representative images from WT and NINJ1 KO pyroptotic THP-1 cells after applying flow with a shear rate of 2073 s−1 for 30 min. Cells with no flow treatment (static) were used as control. Both groups were treated with Nigericin 6h prior to the experiment. Cells with fully ruptured membrane displayed DRAQ7+/Hoechst+ bare nuclei (in white). j, Quantification of the LDH release, percentage of fully ruptured parental and NINJ1 KO cells 30 minutes after the onset of flow with shear rates ranging from 207 s−1 to 2073 s−1. k, Cells were electroporated with 500 ng LPS 1h prior to the stimulation by flow with 829 s−1, 1244 s−1, 1658 s−1 and 2073 s−1 in shear rate. LDH release, percentage of fully ruptured parental and NINJ1 KO cells were measured after flow stimulation for 30 min. l, Cells were treated with 500 ng/ml LLO for 1h, then subjected to flow at 829 s−1 in shear rate. Measurement of the LDH release, percentage of fully ruptured parental and KO cells were done after 30 min of flow stimulation. In all assays, data are from 3 trials. To quantify DRAQ7 staining and ballooned cell percentage, 250~300 cells examined for each trial, ** p<0.01 vs parental. All scale bars are 25 μm.

References

    1. Alberts B., Johnson A., Lewis J. in Molecular Biology of The Cell (Garland Science, 2002).
    1. Ammendolia D. A., Bement W. M. & Brumell J. H. Plasma membrane integrity: implications for health and disease. BMC Biol 19, 71 (2021). - PMC - PubMed
    1. Kayagaki N. et al. NINJ1 mediates plasma membrane rupture during lytic cell death. Nature 591, 131–136 (2021). - PubMed
    1. Kayagaki N. et al. Inhibiting membrane rupture with NINJ1 antibodies limits tissue injury. Nature 618, 1072–1077 (2023). - PMC - PubMed
    1. Zhang Y., Chen X., Gueydan C. & Han J. Plasma membrane changes during programmed cell deaths. Cell Res 28, 9–21 (2018). - PMC - PubMed

Publication types