[Preprint]. 2024 Oct 18:rs.3.rs-5125826.
doi: 10.21203/rs.3.rs-5125826/v1.

HIV persists in late coronary atheroma and is associated with increased local inflammation and disease progression

Affiliations

HIV persists in late coronary atheroma and is associated with increased local inflammation and disease progression

Laventa M Obare et al. Res Sq. .

Abstract

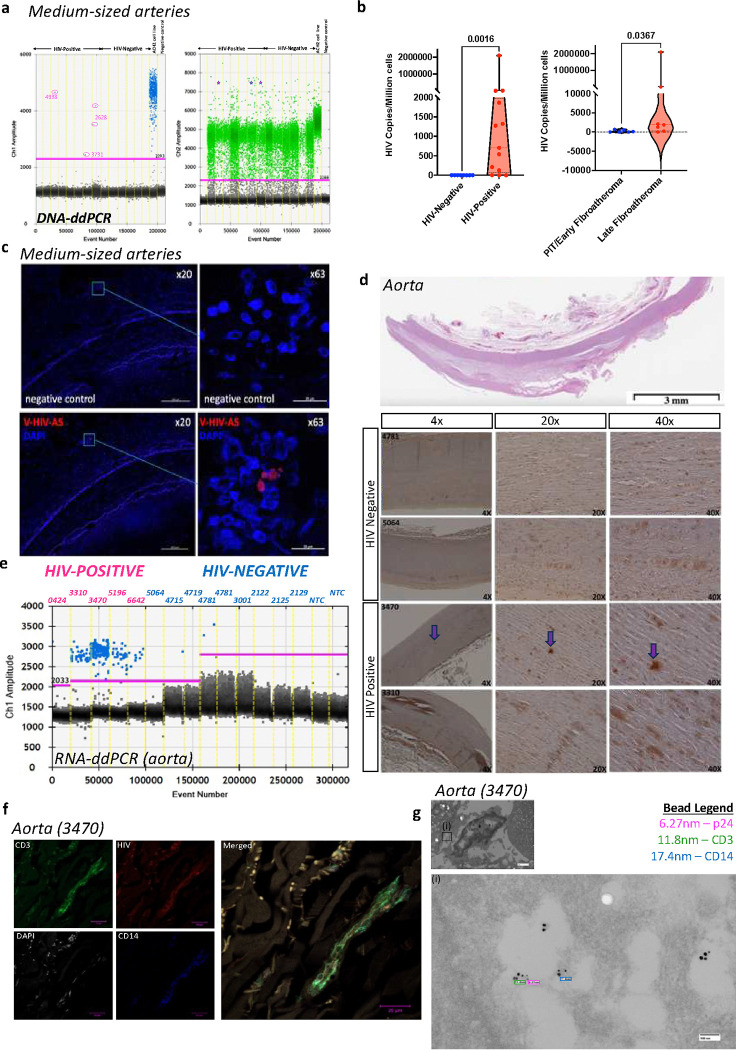
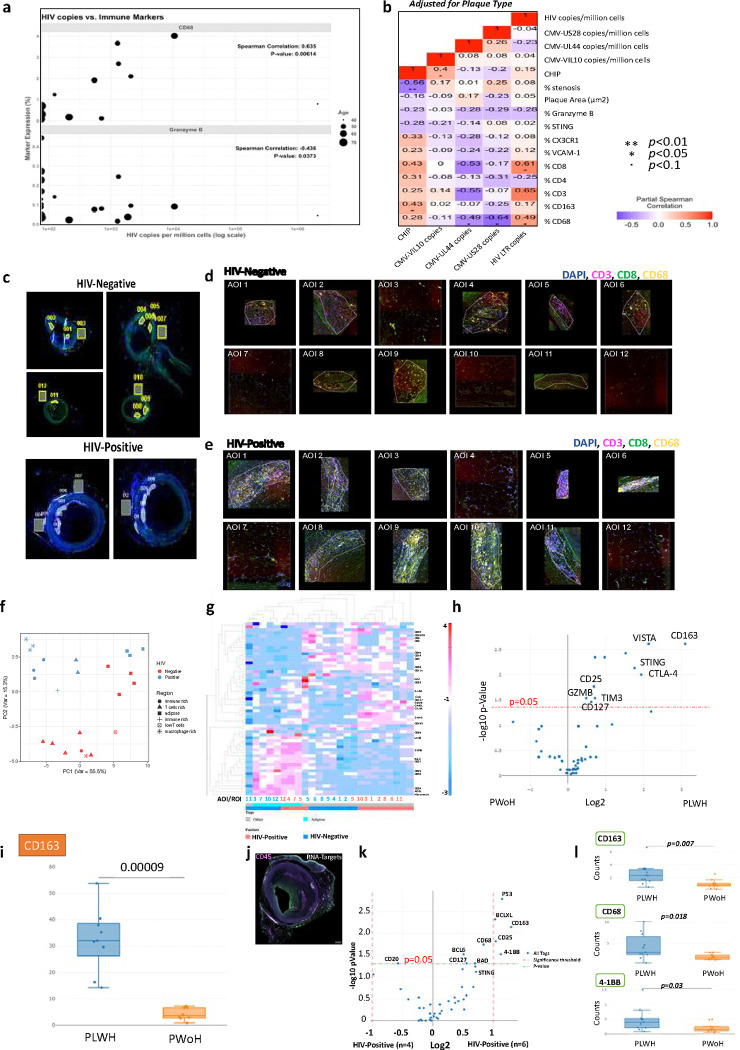
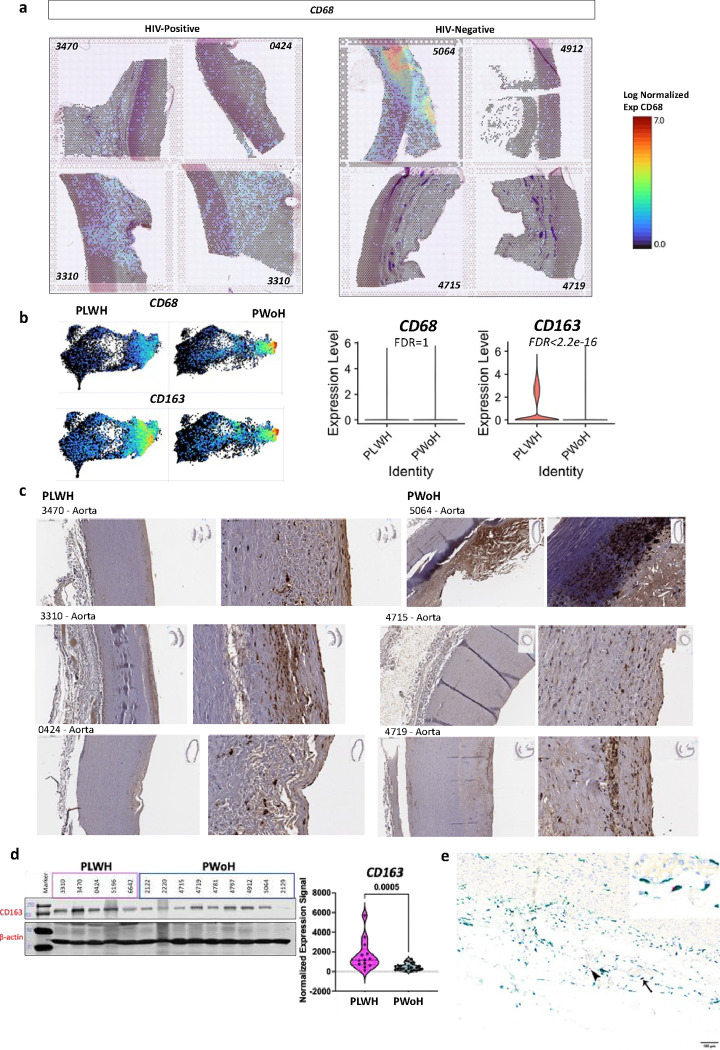
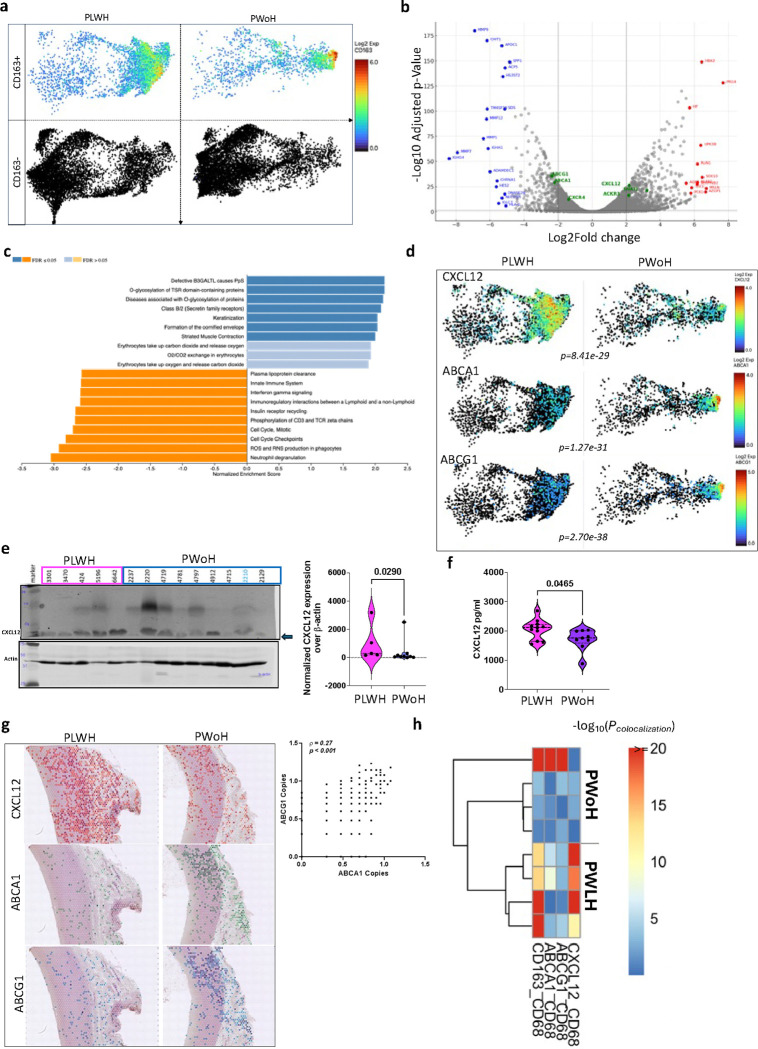
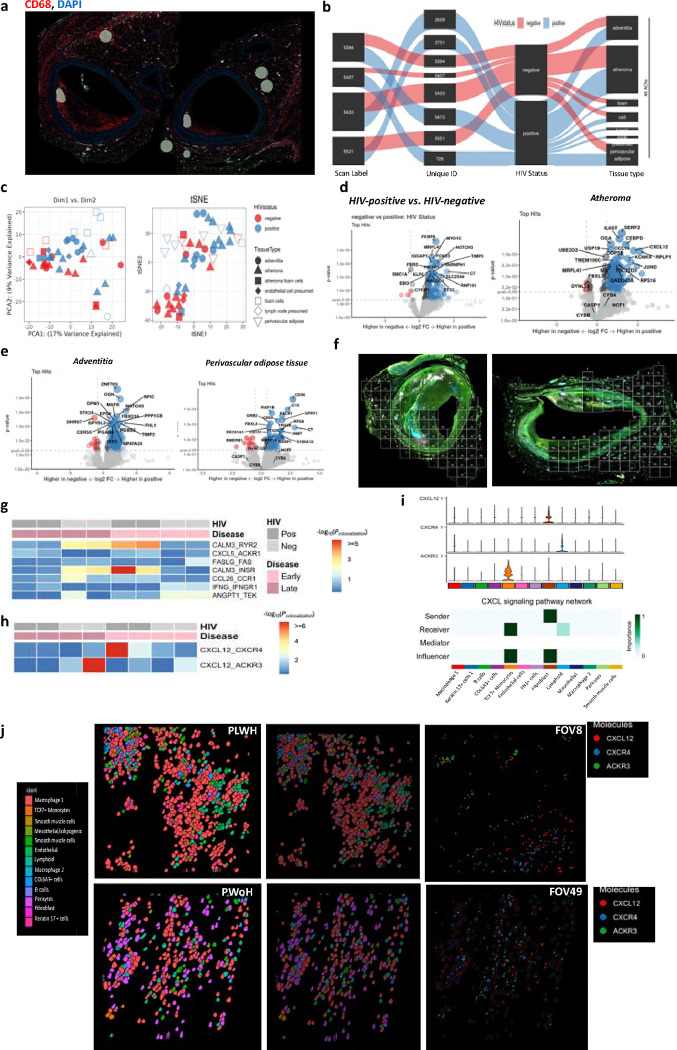
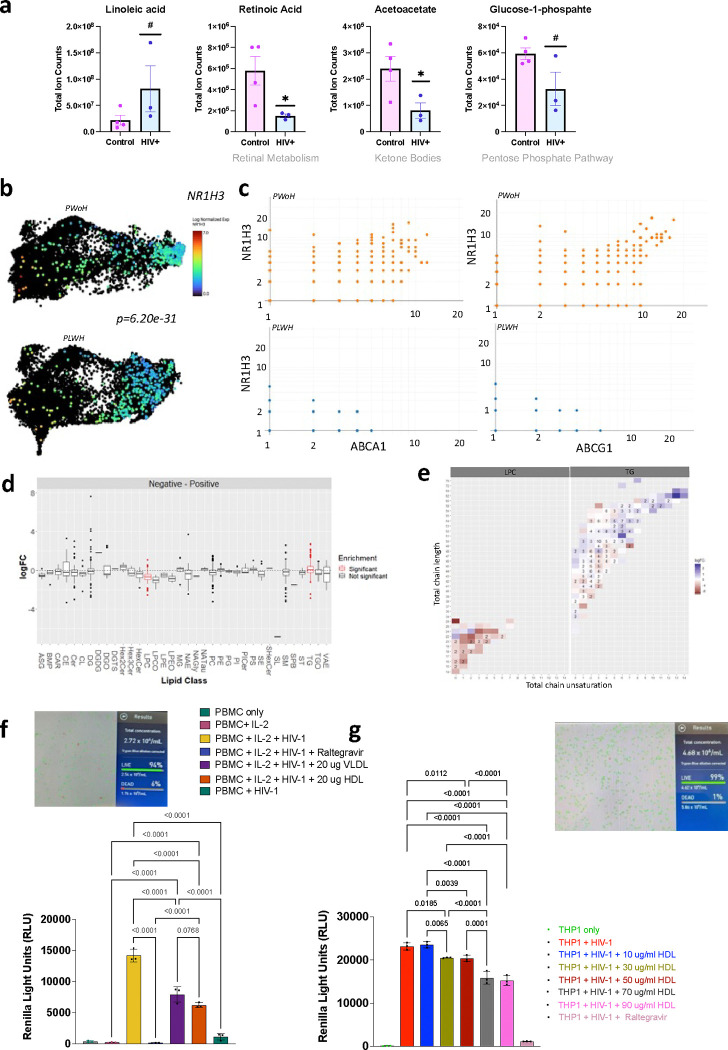
Chronic inflammation contributes to the prevalence of cardiovascular disease in people living with HIV (PLWH). The immune mechanisms driving atherosclerosis progression in PLWH remain unclear. This study conducted comprehensive assessments of medium-sized coronary arteries and aorta from deceased PLWH and controls without HIV using DNA/RNA assays, spatial transcriptomics, and high-resolution mass spectrometry. Findings revealed more significant inflammation correlated with higher HIV copy numbers in late atheroma of PLWH. Enhanced CXCL12 and decreased ABCA1/ABCG1 expression in CD163+ macrophages were co-localized in coronaries of PLWH, suggesting a reduction in plasma lipoprotein clearance compared to controls. Spatial analyses identified potential therapeutic targets by revealing inflammatory changes in medium-sized arteries and the aorta. We examined the relationship between atherosclerotic phenotypes and inflammatory gene expression in Vanderbilts Biobank to study these findings in a larger clinical cohort. This established a significant association between ABCA1 and CXCL12 gene expressions with atherosclerosis, partly influenced by HIV.

Keywords: ABCA1; Atherosclerosis; CD163; CXCL12; HIV; cardiovascular disease.


Figures

Figure 1.
Figure 1.. DNA/RNA and protein assays localize HIV within the coronary arteries and the aorta of PLWH
a, Fluorescence intensities depict DNA droplets ddPCR analysis of medium-sized coronary arteries of seven donors with HIV and six without HIV. The blue droplets on the left are positive for HIV LTR DNA, fluorescence intensity versus droplet number in each droplet. This was multiplexed with RNaseP as the housekeeping gene depicted on the right (green). The positive droplet threshold was determined using the no template controls on the same run. b, Violin plots depict differences in HIV viral copies by sample group (left) and PLWH alone, comparing pathologic intimal thickening (PIT)/early to late atheroma. c, Image of HIV detected in coronary arteries using RNAscope probe HIV-Gagpol. d, We stained aorta samples for Immunohistochemistry analysis with anti-HIV p24. e, Fluorescence intensities depict droplets positive for HIV RNA (aorta samples from five PLWH and nine PWoH deceased donors) as measured by qPCR. f, Image of HIV detected in coronary arteries using RNAscope probe HIV-Gagpol. g, Confocal microscopy of the aorta, using an antibody against HIV p24, anti-CD14, anti-CD3, and DAPI. h, Transmission electron microscopy of FFPE blocks combined with immunogold labeling of the 3470 sample shows colocalization of HIV p24 (6nm), CD3 (12nm), and CD14 (18nm). Statistical analysis was done using the Mann-Whitney U test.
Figure 2.
Figure 2.. Inflammation within coronary arteries of PLWH is associated with the HIV copy number.
a, Bubble plot shows a correlation between HIV copies and immune markers, with the size of the bubble depicting the age of the donors (n=28). b, The heat map shows an adjusted correlation between immune markers with clonal hematopoiesis of indeterminate potential (CHIP), CMV DNA copies, and HIV DNA copies adjusted for plaque type (right). c, Fluorescent images of coronary arteries from PLWH and PWoH matched at the atheroma stage (Early atheroma) using in GeoMX analysis. Areas of interest (AOI 1–12) were selected by drawing geometric regions within the plaque in the advenqqa and perivascular adipose qssue. The coronary arteries were stained with anq-CD3 (magenta), anq-CD8 (green), and anq-CD68 (yellow). SYTO 83 nuclear staining was included to visualize all cells (blue). d-e, The twelve areas selected per sample are shown by HIV status. f, PCA plot shows the distribuqon of AOIs by region and HIV status. g, A heatmap groups AOI segments with similar protein expression. h, Box plots show differences in the expression of select proteins in the different AOIs by HIV status. i, The volcano plot shows differenqal protein expression of all AOIs by HIV status. We used the GeoMX immune pathways RNA panel (84 targets) to compare coronary arteries from PLWH (n=6) to PWoH (n=4). For this analysis, coronary arteries were stained using a custom panel with anti-CD45 (magenta) and PanCK (Green). j, A similar transcriptomic analysis was performed on ten coronary arteries with AOIs selected based on CD45 expressions (PLWH n=six, PWoH n=four). k, Differenqal expression of RNA targets is shown by the volcano plot. l, Box plots show the contribuqon of AOIs for select genes – CD163, CD68, and 4–1BB: statistical analysis, Wilcoxon test, Spearman rank, and Partial Spearman rank analysis. Significance was determined by Mann Whitney test with BH correcqon, * p < 0.05, ** p < 0.01, * *** p < 0.001, **** p < 0.0001.
Figure 3.
Figure 3.. CD163 is higher in the aorta from PLWH compared to PWoH and colocalizes with HIV RNA
a, Thoracic aorta obtained from deceased donors were stained with H&E stains and processed for Visium spatial gene expression analysis. The log normalized expression of CD68 is shown with a spatial resolution. b, The combined HIV-positive and HIV-negative aorta are projected to a UMAP representing each spot that captures data (55μm per spot). Both CD68 and CD163 expression as shown on the UMAPs. Violin plots show the log-normalized expression of CD68 and CD163 in all eight samples by HIV status. c, IHC, and d, western blot showing CD163 protein expression. Violin plots show CD163 expression normalized to the housekeeping proteins β-actin from 3 separate runs. e, Dual detection of CD163 protein expression by immunohistochemistry (green) and HIV RNA hybridization (red) within the aortic adventitia. HIV signals were detected adjacent to (arrowhead) or within CD163-labeled macrophages (thin arrow, inset).
Figure 4.
Figure 4.. Reduced plasma lipoprotein clearance in the aorta of PLWH
a, We compared regions with CD163+ expression to regions without CD163+ expression in the aorta of PLWH (n=4) and PWoH (n=4). b, Differential gene expression was performed using a negative binomial test (edgeR), highlighting genes higher in CD163+ macrophages from PLWH in red and lower genes in blue. c, GSEA analysis with the Reactome pathways shows several pathways different by HIV (blue are upregulated and orange are downregulated pathways in CD163+ macrophages from PLWH). d, UMAPs show the RNA transcript levels of several ABC transporters, including CXCL12, ABCA1, and ABCG1 in the aorta. e, Western blot was used to quantify CXCL12 protein expression in the aorta from PLWH and PWoH, depicted in the violin plot. f, Plasma CXCL12 was measured in the plasma of diabetic PLWH and PWoH. g, Representative images show the gene expression of CXCL12, ABCA1, and ABCG1 in the same regions of the aorta of PLWH and PWoH. ABCA1 is correlated to ABCG1 gene expression (Spearman rank). h, Heatmap shows the spatial colocalization of CXCL12, ABCA1, ABCG1, and CD163 in CD68+ macrophages quantified by SpaGene, a scalable and model-free method. The color scale indicates the significance of colocalization (blue: low significance, red: high significance).
Figure 5.
Figure 5.. CXCL12 expression within coronaries is most detectable in atheroma and is predicted to interact with CXCR4 and ACKR3
a, Regions of interest in coronary arteries were selected based on CD68 expression for spatial analysis using the GeoMX platform, as shown by the representative image. b, The Sankey plot shows the ROI distribution across different coronaries sections from four PLWH and four PWoH. The width of the lines is proportional to the representation of the different regions. c, Nanostring GeoMX whole transcriptomic sequences were obtained from selected regions of interest. PCA and tSNE plots show regions of interest that co-cluster together based on similarities in gene transcripts. d, The volcano plots show differential gene expression by HIV status in all regions and atheroma, e, adventitia, and perivascular adipose tissue. f, Two representative images showing the fields of view of regions selected in the coronary arteries from PLWH and PWoH. g, Heatmap showing the spatial colocalization of genes in coronary arteries, stratified by HIV status (Pos: HIV-positive, Neg: HIV-negative) and atheroma stages (Early vs. Late). The color scale indicates the significance of colocalization (blue: low significance, red: high significance). h, Heatmap showing colocalized expression of CXCL12 and its receptors CXCR4 and ACKR3 across HIV groups and atheroma stages. i, The violin plots show the gene counts of CXCL12, CXCR4, and ACKR3 in each cluster on the x-axis by color code. The heatmap right below shows the predicted CellChat ligand-receptor interactions. j, Representative CosMx fov’s (8 and 49) from coronary arteries of PLWH and PWoH with all cells’ x and y locations. Individual transcripts (CXCL12 - red, ACKR3-green, and CXCR4-blue) are shown on the fov images depicted as molecules. The figure legends are color-coded to depict the different cell types and molecules.
Figure 6.
Figure 6.. Reduced retinoic acid and increased triglycerides in the Aorta of PLWH compared to PWoH.
a, Bar plots show select metabolites compared by HIV status (* p < 0.05, and # p < 0.1 with n=4 PWoH as controls and n=3 PLWH). b, UMAP shows the expression of the NR1H3 gene by HIV status in CD163+ cells. c, Correlation plots show the relationship between NR1H3, ABCA1, and ABCG1 in CD163+ cells in the aorta of PWoH and PLWH. d. The box plot shows the log2-fold change in lipid class enrichment in the aorta of PLWH, with PWoH as the reference. e, Heat maps show enriched lipid classes based on HIV status. f, The bar plot shows PBMCs infected with pseudo-HIV expressing VSV glycoprotein and Renilla luciferase and incubated with antiviral therapy (Raltegravir, Ral), 20μg/ml VLDL, and 20μg/ml HDL. The picture shows the viability of PBMCs infected with HIV and incubated with lipids (VLDL or HDL). g, The bar plot shows THP1 monocytes infected with pseudo-HIV expressing VSV glycoprotein and Renilla luciferase and incubated with antiviral therapy (Raltegravir, Ral), 20μg/ml LDL, 20μg/ml VLDL, and 20μg/ml HDL. The picture shows the viability of the cells. Statistical analysis in c, Spearman rank correlation analysis, f,g. Ordinary one-way ANOVA with Tukeys multiple comparison.

References

    1. Shah A.S.V., et al. Global Burden of Atherosclerotic Cardiovascular Disease in People Living With HIV. Circulation 138, 1100–1112 (2018). - PMC - PubMed
    1. Currier J.S., et al. Coronary heart disease in HIV-infected individuals. J Acquir Immune Defic Syndr 33, 506–512 (2003). - PubMed
    1. Triant V.A., Lee H., Hadigan C. & Grinspoon S.K. Increased acute myocardial infarction rates and cardiovascular risk factors among patients with human immunodeficiency virus disease. J Clin Endocrinol Metab 92, 2506–2512 (2007). - PMC - PubMed
    1. Hsue P.Y., Deeks S.G. & Hunt P.W. Immunologic basis of cardiovascular disease in HIV-infected adults. J Infect Dis 205 Suppl 3, S375–382 (2012). - PMC - PubMed
    1. Freiberg M.S., et al. HIV infection and the risk of acute myocardial infarction. JAMA Intern Med 173, 614–622 (2013). - PMC - PubMed

Publication types

LinkOut - more resources