[Preprint]. 2024 Oct 18:rs.3.rs-5199936.
doi: 10.21203/rs.3.rs-5199936/v1.

Impacts of Medications on Microbiome-mediated Protection against Enteric Pathogens

Affiliations

Impacts of Medications on Microbiome-mediated Protection against Enteric Pathogens

Aman Kumar et al. Res Sq. .

Update in

Abstract

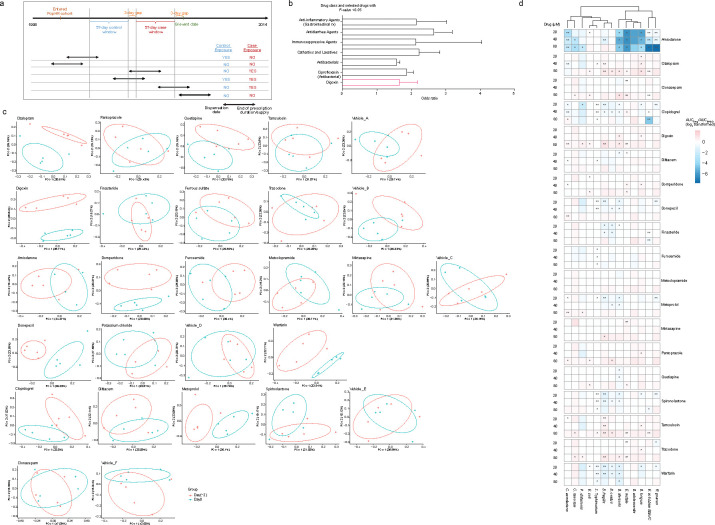
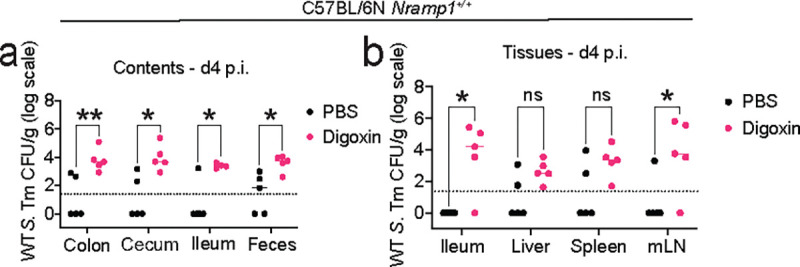
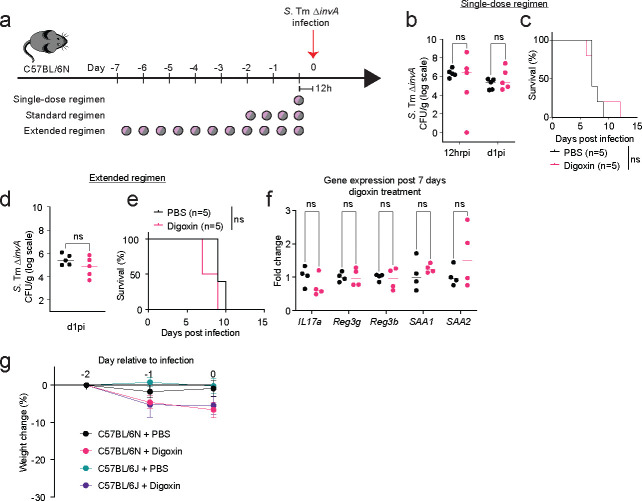
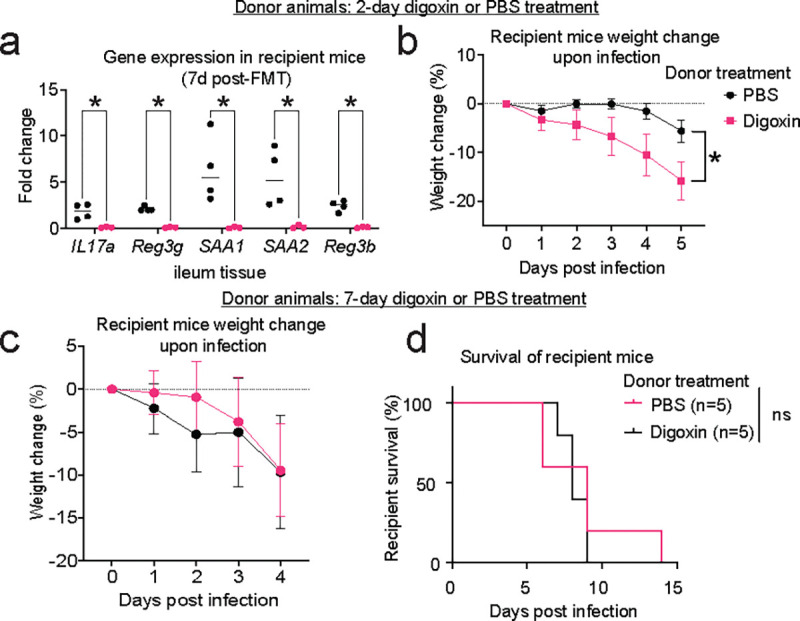
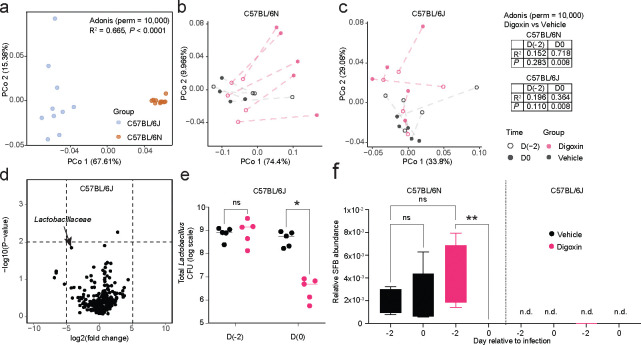
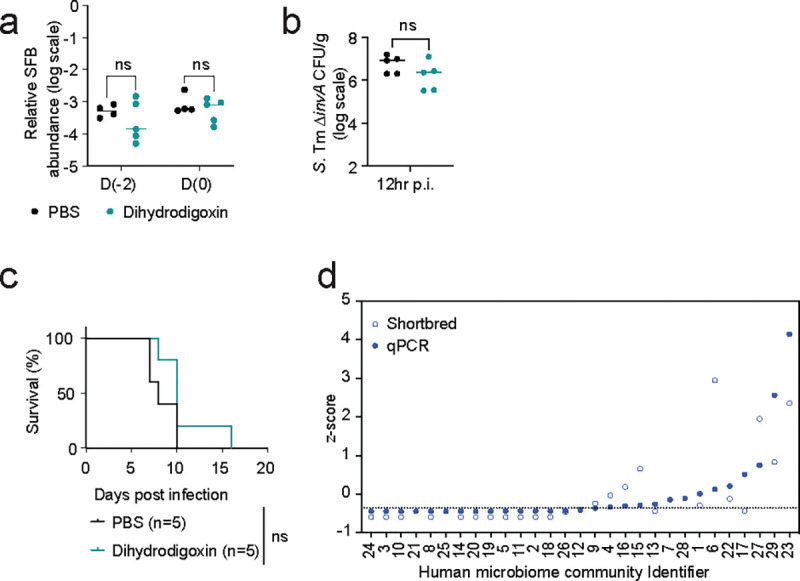
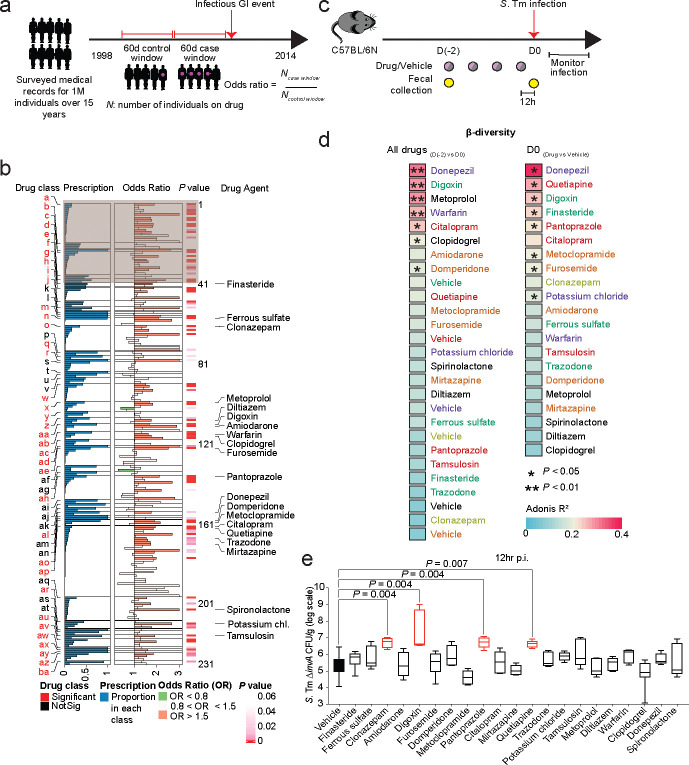
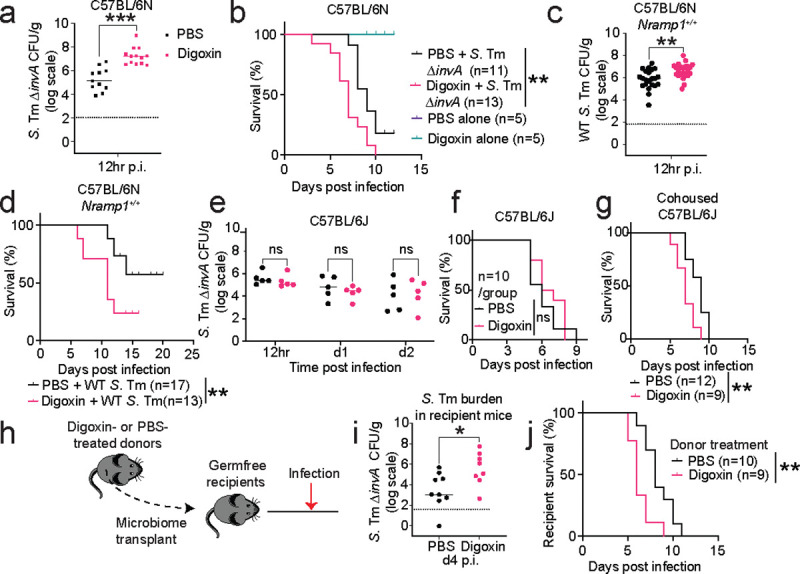
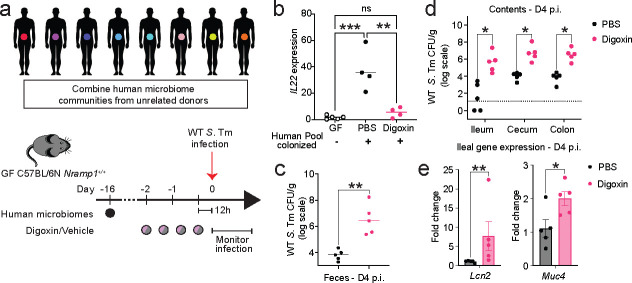
The majority of people in the U.S. manage health through at least one prescription drug. Drugs classified as non-antibiotics can adversely affect the gut microbiome and disrupt intestinal homeostasis. Here, we identified medications associated with an increased risk of GI infections across a population cohort of more than 1 million individuals monitored over 15 years. Notably, the cardiac glycoside digoxin and other drugs identified in this epidemiological study are sufficient to alter microbiome composition and risk of Salmonella enterica subsp. Typhimurium (S. Tm) infection in mice. The impact of digoxin treatment on S. Tm infection is transmissible via the microbiome, and characterization of this interaction highlights a digoxin-responsive β-defensin that alters microbiome composition and consequent immune surveillance of the invading pathogen. Combining epidemiological and experimental approaches thus provides an opportunity to uncover drug-host-microbiome-pathogen interactions that increase infection risk in humans.


Conflict of interest statement

Additional Declarations: There is NO Competing Interest.

Figures

Extended Fig. 1|
Extended Fig. 1|. Impact of medications identified in the epidemiological screen on gut microbes in mice and in vitro.
a, Details of the epidemiology study design. Examples of drug exposures that are included or excluded from case or control windows are shown. b, Infection risk odds ratio for Digoxin is comparable to the odds ratio measured for drug classes and individual drugs expected to increase infection risk. Error bars represent a 95% confidence interval. c, Principal coordinate analysis (PCoA) of Bray-Curtis distances between 16S rRNA sequencing results from fecal samples from C57BL/6N mice before (red) and after treatment (blue). The ellipses in each PCoA plot depicts the 68% confidence marginal relationships among variables in each group generated by an integrated function in the R package “ggplot2”. Each point within the same color represents an individual mouse. d, Area under the curve (AUC) comparison for growth of representative bacterial taxa under increasing drug concentrations (20, 40, and 80μM). The tree represents the clustering of taxa based on growth inhibition profiles across all tested drugs. Color shading represents normalized growth (AUC relative to DMSO control). *P< 0.05, **P<0.01.
Extended Fig. 2|
Extended Fig. 2|. Digoxin pretreatment prior to S. Tm ΔinvA infection leads to increased pathogen colonization and dissemination.
a-g, Digoxin or PBS-pretreated CV C57BL/6N mice were infected with 108 CFUs of S. Tm ΔinvA 12 h after the final drug or vehicle dose and infection monitored over time. a, Pathogen burden in feces at d2 p.i.. b, Fecal pathogen burden at d4 p.i.. Mice were sacrificed at d4 p.i. and pathogen burden was enumerated from the ileum (c), cecum (d), and colon (e) contents. Dissemination of S. Tm ΔinvA to extraintestinal tissues was measured in the liver (f) and spleen (g). A non-parametric Mann-Whitney test is used to compare two groups. Each point represents one mouse. *P<0.05, **P<0.01, ***P<0.001.
Extended Fig. 3|
Extended Fig. 3|. Digoxin pretreatment prior to infection with WT S. Tm leads to increased pathogen burden in Nramp1+/+ mice.
a-b, CV C57BL/6N Nramp1+/+ mice were treated with digoxin or PBS for two days as shown in Fig. 1c; 12h after the final drug or PBS treatment, animals were infected with 108 CFUs of WT S. Tm and pathogen burden measured at d4 p.i. in gastrointestinal contents (a) and tissues (b). A non-parametric Mann-Whitney test is used to compare two groups. Bonferroni-Dunn method is used for multiple comparisons. Each point represents one mouse. *P<0.05, **P<0.01, ns – not significant.
Extended Fig. 4|
Extended Fig. 4|. Digoxin pretreatment decreases ileal proinflammatory responses.
CV C57BL/6N mice were treated with digoxin or PBS for two days. Mice were sacrificed 12 h after the final drug or vehicle dose, and tissues were collected for gene expression measurement by qRT-PCR. a-f, Ileal expression of Th17-related proinflammatory marker genes IL17a (a), IL22 (b), SAA1 (c), SAA2 (d), Reg3b (e), and Reg3g (f). g, Ileal expression of other inflammatory marker genes. h-i, Expression of representative inflammatory marker genes in cecal (h) and colon (i) tissue. Fold change is measured relative to Gapdh expression. A non-parametric Mann-Whitney test is used to compare two groups. Bonferroni-Dunn method is used for multiple comparisons. Each point is one mouse. *P<0.05, **P<0.01, ***P<0.001, ns – not significant.
Extended Fig. 5|
Extended Fig. 5|. Impact of digoxin pretreatment duration on S. Tm infection.
a, Experimental design. CV C57BL/6N mice were treated with digoxin or PBS for one dose 2hr prior to infection (single dose regimen), twice daily for 2 days followed by a 12-hour washout period (standard regimen), or twice daily for 7 days followed by a 12-hour washout period (extended regimen). Mice were then infected with 108 CFUs of S. Tm ΔinvA and infection monitored over time. b-c, Pathogen burden at 12hr p.i. (b) and mortality (c) after single-dose drug or control treatment. d-f, Pathogen burden at 12hr p.i. (d), mortality (e), and expression of proinflammatory marker genes in ileum tissue (f) after the extended regimen drug or control treatment. g, Impact of digoxin or PBS treatment on the weight of CV C57BL/6N and C57BL/6J mice. In f, fold change is measured relative to the mouse housekeeping gene, Gapdh. In b, d, f, a non-parametric Mann-Whitney test is used to compare two groups. For survival analysis, the Gehan-Breslow-Wilcoxon test is used. ns – not significant.
Extended Fig. 6|
Extended Fig. 6|. Altered immune responses and pathogen susceptibility are microbiome dependent.
a-b, Characterization of recipient mice after transplantation of gut microbiomes from donor animals treated with digoxin or PBS for 2 days (standard regimen). a, Gene expression in ileal tissue of recipient mice as measured by qRT-PCR. b, Weight of recipient mice after infection with S. Tm ∆invA. c-d, Characterization of recipient mice after transplantation of gut microbiomes from donor animals treated with digoxin or PBS for 7 days (extended regimen). c, Weight of recipient mice after infection with S. Tm ∆invA. d, Survival of recipient mice after infection with S. Tm ∆invA. In a, fold change is measured relative to the mouse housekeeping gene, Gapdh. In a, b, a non-parametric Mann-Whitney test is used to compare two groups. In a, multiple comparisons are made using the Bonferroni-Dunn method. For survival analysis, the Gehan-Breslow-Wilcoxon test is used. * P< 0.05, ns – not significant.
Extended Fig. 7|
Extended Fig. 7|. Impact of digoxin treatment on the mouse microbiome.
a, Principal coordinate analysis (PCoA) using weighted UniFrac distance matrices were used to calculate the compositional differences between untreated C57BL/6N and C57BL/6J mice. b-c, PCoA plots using weighted UniFrac distance matrices were used to compare the compositional change of untreated, digoxin-treated, or PBS-treated fecal samples in b, C57BL/6N, and c, C57BL/6J mice. In a-c, Permutational Multivariate Analysis of Variance (PERMANOVA) analysis using the adonis function with 10,000 permutations was used to calculate the amount of variation. The effect size (R-squared) explains the magnitude of dissimilarities between groups. d, Volcano plot showing differentially abundant taxa in fecal contents in PBS-pretreated and digoxin-pretreated C57BL/6J mice. e, Impact of digoxin or PBS treatment (standard regimen) on the abundance of Lactobacillus sp. as measured by selective plating on McConkey agar. A non-parametric Mann-Whitney test is used to compare two groups. Multiple comparisons are done using the Bonferroni-Dunn method. f, Relative SFB abundance based on 16S rRNA sequencing of fecal samples collected from C57BL/6N and C57BL/6J mice 12h after the final PBS or digoxin dose of a 2-day (standard) treatment regimen. Kruskal-Wallis test was used to compare three or more groups, followed by Dunn’s multiple comparisons test. a-c, e, Each data point represents one mouse. * P< 0.05, ** P< 0.01, ns – not significant, n.d. – not detected.
Extended Fig. 8|
Extended Fig. 8|. Impact of digoxin dose and treatment duration on SFB abundance in mice.
a, SFB abundance in PBS-pretreated, digoxin-pretreated (5 mg/kg; standard dose), or digoxin-pretreated (0.5 mg/kg) C57BL/6N mice relative to total bacteria, as measured by qPCR. Samples were collected 12 hours after the last treatment dose. Two-way ANOVA was performed, followed by Dunnett’s multiple comparisons test. b, SFB abundance over time in fecal samples from C57BL/6N mice continuously treated (7 days, 2x/day) with PBS or digoxin. Samples were collected 12 hours after the previous treatment dose, and SFB abundance was measured by qPCR and normalized relative to the total bacteria in the sample. c, SFB abundance over time in fecal samples from C57BL/6N mice intermittently treated with digoxin. Mice were administered digoxin 2x/day on days 1–7, followed by a 7-day rest period (no treatment); digoxin treatment was resumed (2x/day) on days 16–17. SFB abundance was measured as in (b). d-e, CV C57BL/6N mice were treated with vancomycin either intraperitoneally or by oral gavage using the standard two-day treatment regimen. PBS was administered intraperitoneally as a control. d, SFB abundance. e, Expression of select maker genes 12h after the final treatment dose. A non-parametric Kruskal-Wallis test was used to compare three or more groups, followed by Dunn’s multiple comparisons test. In b, d, a non-parametric Mann-Whitney test was used to compare two groups, followed by multiple comparisons using the Bonferroni-Dunn method. *P< 0.05, ** P< 0.01, *** P< 0.001, ns – not significant.
Extended Fig. 9|
Extended Fig. 9|. Characterization of the role of RORγt and enteric β-defensins in digoxin response.
a-b, Impact of digoxin or PBS pretreatment on S. Tm ∆invA infection in SFB-colonized Rorγ −/− mice. Pathogen burden (a) and mortality (b) is shown. c, Impact of PBS- or digoxin-pretreatment on SFB levels in SFB-colonized DILC3 mice and littermate RorγSTOP controls. d, Volcano plot of RNA sequencing data showing differentially expressed genes between digoxin-pretreated and PBS-pretreated C57BL/6N mice. e, defb39 expression from ileum tissue of mice pretreated with PBS or digoxin for an extended (7-day) regimen. In a, c, e, a non-parametric Mann-Whitney test was used to compare the two groups. In c, one In b, the Gehan-Breslow-Wilcoxon test is used. ** P< 0.01, ns – not significant.
Extended Fig. 10|
Extended Fig. 10|. Impact of microbial digoxin metabolites on S. Tm ∆invA infection.
a-c, CV C57BL/6N mice treated with dihydrodigoxin (5 mg/kg) or PBS (standard regimen). 12 hours after the final drug or buffer treatment, mice were infected with 108 CFUs of S. Tm ΔinvA and infection monitored over time. a, Relative abundance of SFB, normalized to total bacteria, in fecal samples before and after dihydrodigoxin or PBS treatment. b, Pathogen burden at 12 hr post infection (p.i.) c, Survival curve. d, Estimation of cgr2 gene abundance across 29 fecal communities from unrelated human donors, as measured from metagenomic sequencing and Shortbred analysis or targeted qPCR analysis. In a, b, a non-parametric Mann-Whitney test was used to compare the two groups. In c, the Gehan-Breslow-Wilcoxon test is used. ns - not significant.
Fig. 1|
Fig. 1|. Analysis of 1M individuals over 15 years identifies drugs that increase infection risk in humans and mice.
a, Design of a case-crossover epidemiological study to identify associations between prescription medications and infectious gastrointestinal (GI) events across >1M individuals. Case and control windows are defined relative to infectious GI events; for each drug, an odds ratio is calculated as the number of individuals (N) taking the drug in case periods relative to control periods. b, Epidemiological study results. 21 drugs (with names listed) were identified for further study based on the number of prescriptions within each class, odds ratio > 1.5, and P-value <0.05. Letters (a-ba) indicate drug classes, and numbers (1–231) indicate individual drugs (Extended Data Table 2). Drug classes expected to be associated with infection risk (anti-microbial agents, immunosuppressants, antidiarrheals, analgesics and antipyretics, antiemetics, cathartics, and laxatives) are indicated in the shaded area. c, Experimental design to study colonization resistance in mice. d, Drug-dependent microbiome compositional differences measured using principal coordinate analysis on Bray-Curtis dissimilarity before and after drug treatment (left panel) and between drug- and control-treated animals in the same cohort (right panel). Permutational Multivariate Analysis of Variance (PERMANOVA) analysis was used to calculate the amount of variation. The effect size (R-squared) explains the magnitude of dissimilarities between groups. Drug and vehicle names are colored by mouse cohort. e, Multiple drugs identified in the epidemiological screen impact S. Tm ΔinvA pathogen burden in mice. Statistical significance is calculated using the non-parametric Kruskal-Wallis test followed by Dunn’s multiple comparisons test (n=5 mice/group; n=25 mice for vehicle group).
Fig. 2|
Fig. 2|. The impact of digoxin on infection risk is transmissible via the microbiome.
a, b, CV C57BL/6N mice were orally gavaged with digoxin (5mg/kg) or PBS (in 5% dimethyl sulfoxide, DMSO) and infected with S. Tm ΔinvA as in Fig. 1c. a, Fecal pathogen burden in PBS-pretreated or digoxin-pretreated mice 12 hr post-infection (p.i.). b, Mortality of PBS-pretreated or digoxin-pretreated C57BL/6N mice after S. Tm ΔinvA infection or mock infection. c, Pathogen burden in PBS-pretreated or digoxin-pretreated C57BL/6N Nramp1+/+ mice 12 hr after infection with WT S. Tm. d, Survival of PBS-pretreated or digoxin-pretreated C57BL/6N Nramp1+/+ mice after infection with WT S. Tm. e-f, Impact of digoxin on infection of CV C57BL/6J mice. Fecal pathogen burden (e) and mortality (f) in non-cohoused, PBS-treated or digoxin-pretreated C57BL/6J mice after S. Tm ΔinvA infection is shown. g, Impact of PBS-pretreatment or digoxin-pretreatment on S. Tm infection in C57BL6/J mice that were cohoused with C57BL/6N mice for 14 days. Animals were separated prior to PBS or drug administration and infection. h, Schematic of gut microbiome transplantation experiments. i-j, Impact of transplantation of gastrointestinal contents from PBS-pretreated or digoxin-pretreated donor mice on S. Tm pathogen burden (i) and mortality (j) in ex-GF recipient mice colonized with either microbiome prior to infection. In a, c, e, i, each data point represents one mouse. Bar represents median values, and dotted lines represent the limit of detection. A non-parametric Mann-Whitney test was used for comparison between two groups. In b, d, f, g, j, the P-value was calculated using the Gehan-Breslow-Wilcoxon test. n represents the number of mice. *P<0.05, ** P<0.01, ***P<0.001.
Fig. 3|
Fig. 3|. Digoxin-mediated depletion of segmented filamentous bacteria (SFB) increases susceptibility to S. Tm infection in mice.
a, Volcano plot showing differentially abundant taxa in fecal contents in PBS-pretreated and digoxin-pretreated C57BL/6N mice. b, c, SFB abundance in PBS-pretreated or digoxin-pretreated C57BL/6N (b) and C57BL/6N Nramp1+/+ (c) mice relative to total bacteria, as measured by quantitative PCR (qPCR). d, Scanning electron microscopy of terminal ileum of mice pretreated with PBS or digoxin. e, C57BL/6J mice cohoused with C57BL/6N animals acquire SFB, which is reduced upon digoxin (Dig) treatment. Animals were separated prior to PBS or drug administration. f, Relative abundance of SFB in ex-GF recipient mice after transplantation of gastrointestinal contents from PBS-pretreated or digoxin-pretreated C57BL/6N donor animals. g,h, SFB colonization is sufficient to alter the response of C57BL/6J mice to digoxin. SFB colonization was conducted on day −14 relative to infection, and drugs were administered for two days before infection as in Fig. 1c. Relative abundance of SFB after PBS or digoxin pretreatment (g) and mortality after S. Tm ΔinvA infection (h) is shown. The P-value was calculated using the Gehan-Breslow-Wilcoxon test. n represents the number of mice. In b-c and e-g, a non-parametric Mann-Whitney test was used to compare two groups. Multiple comparisons are made using the Bonferroni-Dunn method; * indicates P< 0.05.
Fig. 4|
Fig. 4|. A digoxin-inducible, RORγt-dependent β-defensin controls SFB levels in the mouse gut.
a, Impact of PBS- or digoxin-pretreatment on SFB levels in SFB-colonized Rorγ −/− mice and their WT littermate controls. b-c, Relative expression of genes encoding anti-microbial peptides (AMPs) in ileal tissue of C57BL/6N mice with and without digoxin pre-treatment, as measured by qRT-PCR of a targeted gene panel (b) and RNA-seq (c). Experiments were performed on separate groups of mice, and an unpaired t test was used to calculate statistical significance. In b, FC indicates fold change. d, defb39 gene expression in ileal tissue of SFB-colonized Rorγ−/− mice after PBS or digoxin pretreatment. e, Absolute SFB abundance in the ileum content of ex-GF mice mono-colonized with SFB and treated with PBS or digoxin. f, Expression of digoxin-induced (defb39) and SFB-responsive (SAA1, Reg3g) genes in ileal tissue of ex-GF mice mono-colonized with SFB and treated with PBS or digoxin. g, SFB abundance in fecal samples from vil-defb39 transgenic mice and WT controls. h, Schematic for measuring antimicrobial activity of purified BD-39 against SFB. i, Absolute SFB abundance over time in ex-GF mice colonized with BD-39 incubated samples or buffer control-incubated samples. A two-sample Welch t-test was used to compare the two groups. In b, d, f, fold change is measured relative to the mouse housekeeping gene, Gapdh. In a, d, e, f, g, a Mann-Whitney test is used to compare two groups. ns, not significant; *P<0.05, **P<0.01., ***P<0.001.
Fig. 5|
Fig. 5|. Digoxin increases the susceptibility of gnotobiotic mice colonized with human microbial communities to WT S. Tm infection.
a, Experimental design. Human fecal samples were pooled and used to colonize GF C57BL/6N Nramp1+/+ recipient mice. Mice were pretreated with PBS or digoxin as in Fig. 1c and infected with WT S. Tm. b, Expression of IL22 in ileal tissue of GF Nramp1+/+ mice and ex-GF Nramp1+/+ animals colonized with pooled human communities prior to infection. Ileal tissues were collected 12 hours after the final treatment dose. Statistical tests were performed using ordinary one-way ANOVA, followed by Tukey’s multiple comparisons test. c-d, Ex-GF Nramp1+/+ mice pretreated with PBS or digoxin were infected with WT S. Tm, and pathogen burden in feces (c), contents of ileum, cecum, and colon (d) is shown. e, Gene expression of S. Tm-responsive inflammatory marker genes in ileal tissue from mice from (a) at day 4 post infection. A non-parametric Mann-Whitney test is used to compare two groups. Each data point is an individual mouse. *P<0.05, **P<0.01, ***P<0.001.

References

    1. Caruso R., Lo B. C. & Núñez G. Host–microbiota interactions in inflammatory bowel disease. Nat Rev Immunol 20, 411–426 (2020). - PubMed
    1. Burgos da Silva M. et al. Preservation of the fecal microbiome is associated with reduced severity of graft-versus-host disease. Blood 140, 2385–2397 (2022). - PMC - PubMed
    1. Dehner C., Fine R. & Kriegel M. A. The microbiome in systemic autoimmune disease: mechanistic insights from recent studies. Curr Opin Rheumatol 31, 201–207 (2019). - PMC - PubMed
    1. Wong S. H. & Yu J. Gut microbiota in colorectal cancer: mechanisms of action and clinical applications. Nat Rev Gastroenterol Hepatol 16, 690–704 (2019). - PubMed
    1. Kim S., Covington A. & Pamer E. G. The intestinal microbiota: Antibiotics, colonization resistance, and enteric pathogens. Immunol Rev 279, 90–105 (2017). - PMC - PubMed

Publication types

LinkOut - more resources