[Preprint]. 2024 Oct 15:rs.3.rs-5167339.
doi: 10.21203/rs.3.rs-5167339/v1.

Cell Populations in Human Breast Cancers are Molecularly and Biologically Distinct with Age

Affiliations

Cell Populations in Human Breast Cancers are Molecularly and Biologically Distinct with Age

Adrienne Parsons et al. Res Sq. .

Abstract

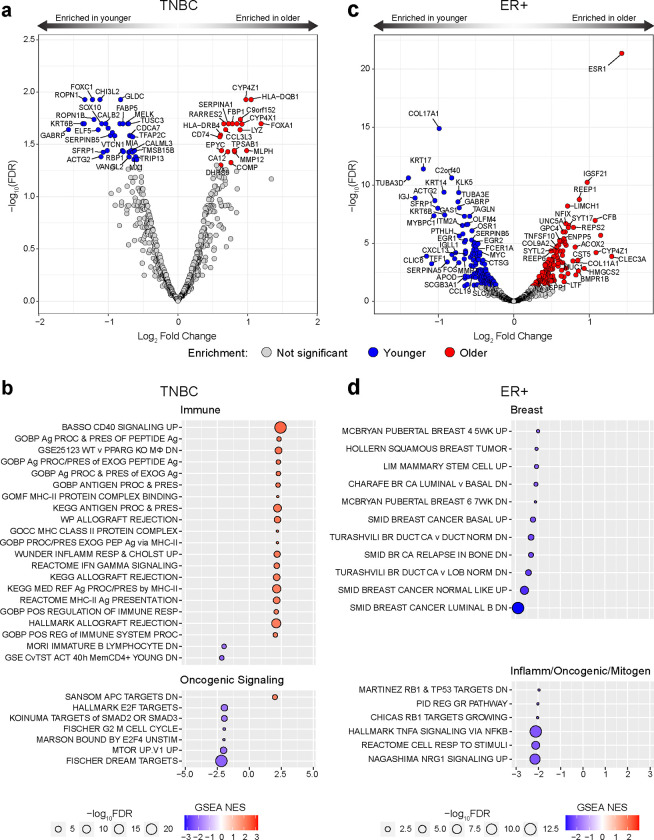
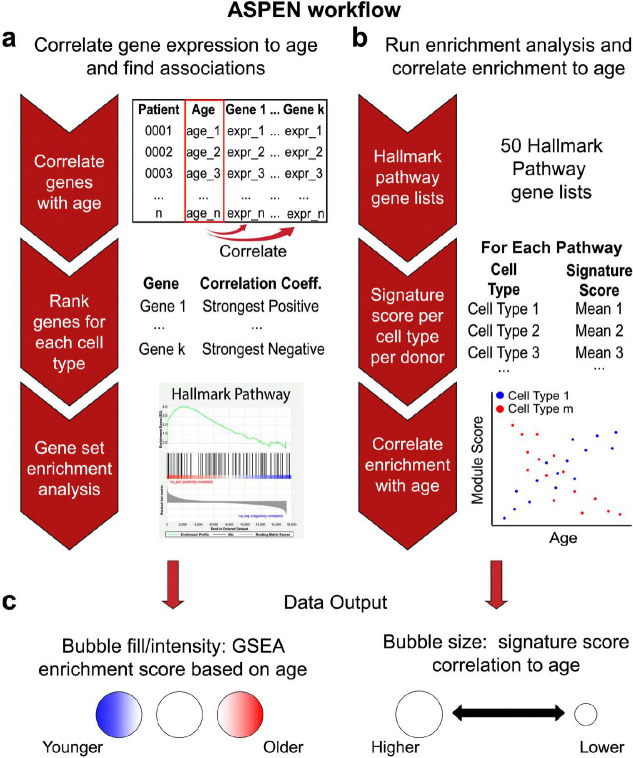
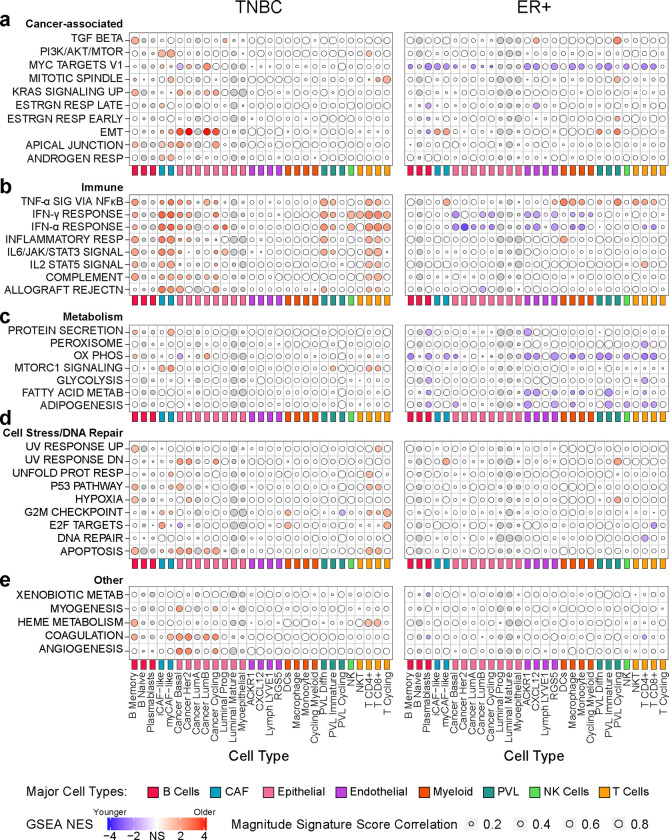
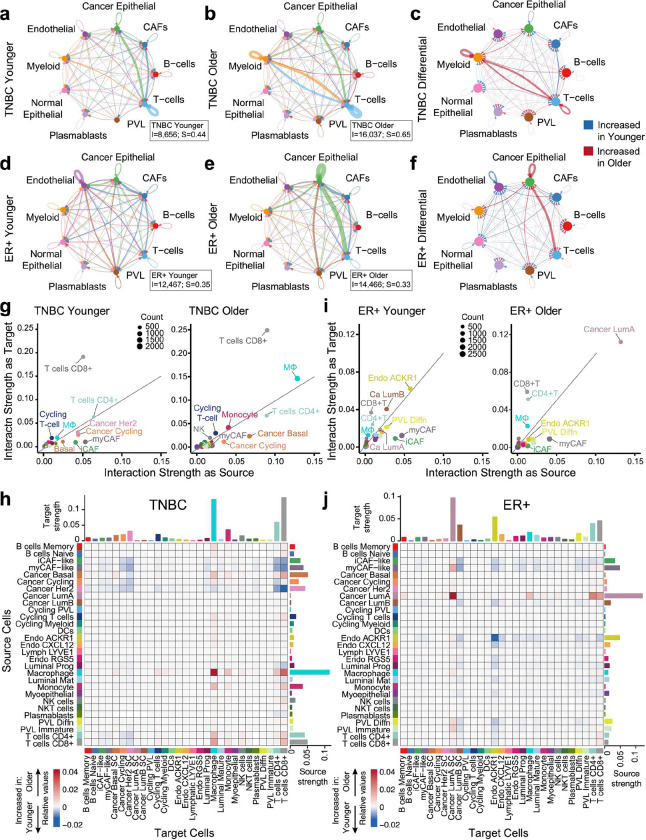
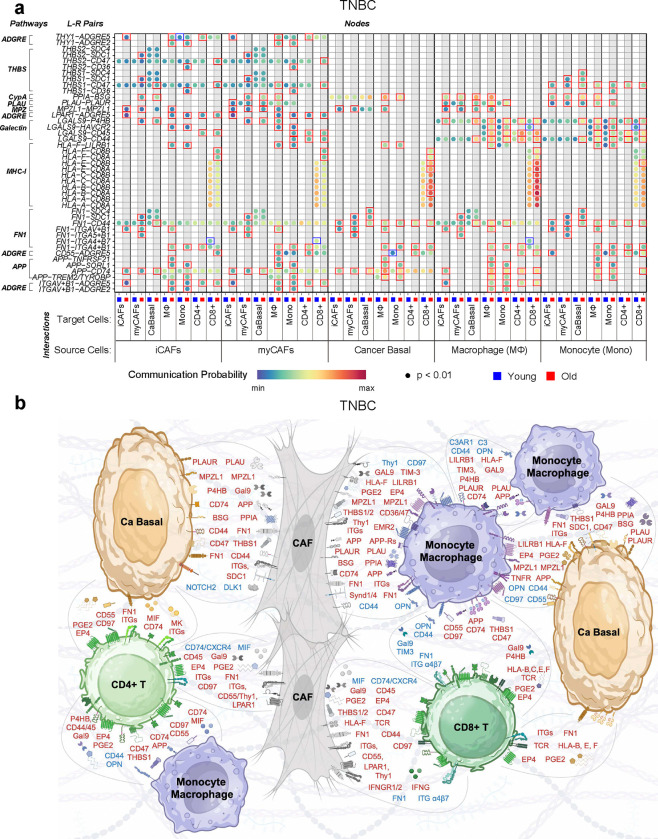
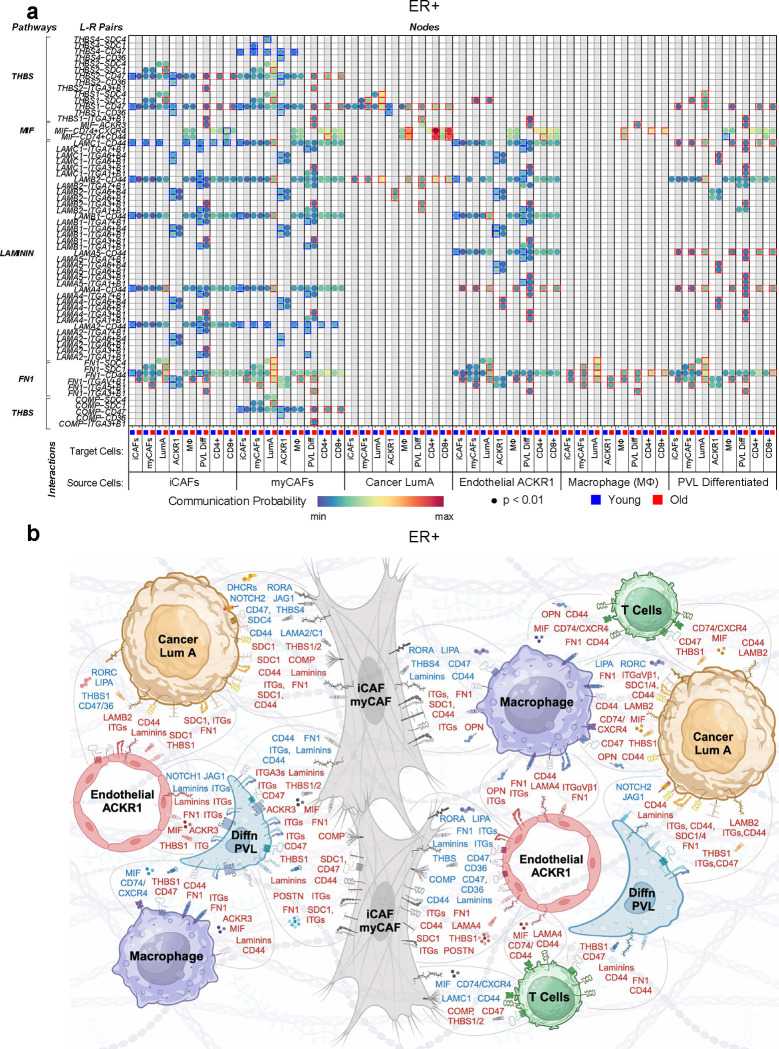
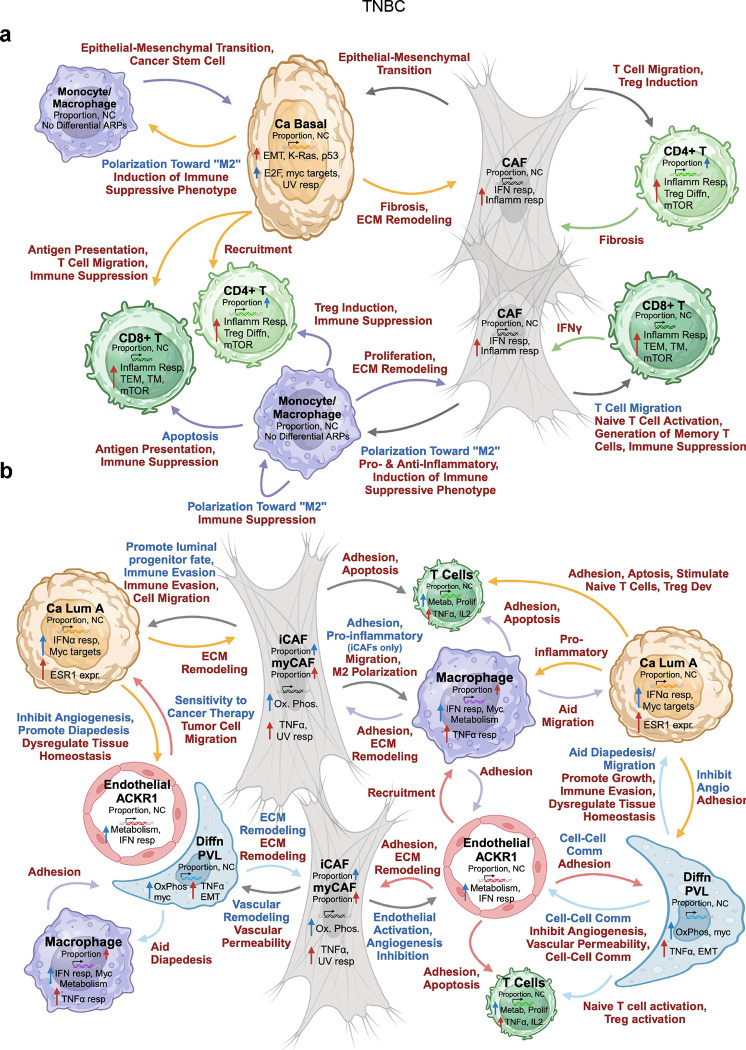
Aging is associated with increased breast cancer risk and outcomes are worse for the oldest and youngest patients, regardless of subtype. It is not known how cells in the breast tumor microenvironment are impacted by age and how they might contribute to age-related disease pathology. Here, we discover age-associated differences in cell states and interactions in human estrogen receptor-positive (ER+) and triple-negative breast cancers (TNBC) using new computational analyses of existing single-cell gene expression data. Age-specific program enrichment (ASPEN) analysis reveals age-related changes, including increased tumor cell epithelial-mesenchymal transition, cancer-associated fibroblast inflammatory responses, and T cell stress responses and apoptosis in TNBC. ER+ breast cancer is dominated by increased cancer cell estrogen receptor 1 (ESR1) and luminal cell activity, reduced immune cell metabolism, and decreased vascular and extracellular matrix (ECM) remodeling with age. Cell interactome analysis reveals candidate signaling pathways that drive many of these cell states. This work lays a foundation for discovery of age-adapted therapeutic interventions for breast cancer.


Conflict of interest statement

Competing interests The authors declare no competing interests.

Figures

Figure 1 |
Figure 1 |. Age-related differentially expressed genes and functional gene set enrichments in TNBC and ER+ breast cancer.
a, c, Volcano plots showing log2fold change for high variance genes (by standard deviation) in tumors from patients with TNBC (a) and ER+ breast cancer (c), comparing the age groups < 45 years and > 65 years from METABRIC. Plots show log2fold change difference on the x-axis and −log10FDR on the y-axis. Red colored dots represent genes enriched in the >65 age group; blue colored dots are genes enriched in the <45 age group; false discovery rate <0.05 (−log10FDR > 0.1.301). n=50 TNBC <45; n=63 TNBC >65; n=86 ER+ <45; n=386 ER+ >65. b, d, Results of age-stratified gene set enrichment analysis (GSEA) of highly variable genes ranked by log2fold difference from a and c in TNBC (b) and ER+ breast cancer (d). Pathways are grouped by biological similarity. Red fill color indicates enrichment in the > 65 age group; blue indicates enrichment in the < 45 age group. Circle size is proportional to relative −log10(FDR) for the enrichment, and color depth represents magnitude of normalized enrichment score (NES), according to indicated scales.
Figure 2 |
Figure 2 |. Development of a single-cell Age-Specific Program ENrichment (ASPEN) analysis pipeline.
ASPEN relies on adaptations of gene set enrichment analysis (GSEA) in parallel assessments to correlate gene expression-based enrichment of functional pathways to age. a, The average gene expression per cell type is matched to donor age and a correlation coefficient for each gene is calculated. The genes with nonzero coefficients are then ranked by their correlation coefficients, and GSEA is performed using select gene sets of choice. b Concurrently, the gene sets are used to assign a signature score to every cell in the single-cell dataset using Seurat v4 commands. Following scoring, the mean signature score for each gene set is calculated per cell type per donor. These mean values are then correlated to donor age. c, The resulting normalized enrichment scores (NES) from a are then plotted as data point color for each cell type/pathway combination, with red indicating statistically significant enrichment in older donors, blue indicating statistically significant enrichment in younger donors, and white indicating a failure to achieve statistical significance. Depth of color is related to magnitude of enrichment. Irrespective of correlation direction (coefficient < 0 or coefficient > 0) in b, the magnitude of the correlation of signature score to age is visualized as the size of the data point for each cell type/pathway combination, with point size being proportional to the magnitude of correlation (larger circle = more strongly correlated or anti-correlated).
Figure 3 |
Figure 3 |. Cell-specific age-related programs (ARPs) in TNBC and ER+ breast cancer.
Results from ASPEN analysis of the breast cancer single-cell RNA-seq atlas dataset and Hallmark gene sets (Human MSigDB) yielding cell-specific age-related programs (ARPs) in TNBC (left) ER+ breast cancer (right). The 29 minor cell types (color coded by indicated major cell type groups) are represented on x-axes and indicated Hallmark pathways on y-axes. ARPs were manually grouped into biologically similar processes, including cancer-associated (a), immune-related (b), metabolism (c), cell stress/DNA repair (d), and others (e). A given cell type must have been present in >50% of donors for that cell type to be correlated to donor age; otherwise, it was excluded from analysis. Donors with a cell count of 0 for a given cell type were excluded from analysis of that cell type. Bubble color indicates normalized enrichment score (NES) of age-associated GSEA analysis (Fig. 2a), with deeper color indicating greater enrichment. Red indicates statistically significant enrichment (adjusted p < 0.05) in older donors; blue indicates statistically significant enrichment (adjusted p < 0.05) in younger donors; white indicates a failure to achieve statistical significance; gray indicates cell types that were not assessed because they were present in < 50% of the donors. Bubble size indicates magnitude of enrichment score correlation to age (Fig. 2b); larger bubbles indicate stronger correlation or anti-correlation. NS = not significant, TNF = tumor necrosis factor, SIG = signaling, IFN = Interferon, RESP = response, SIGNAL = Signaling, REJECTN = rejection, OX PHOS = oxidative phosphorylation, METAB = metabolism, TGF = transforming growth factor, ESTRGN = estrogen, EMT = epithelial to mesenchymal transition, DN = down, UNFOLD PROT RESP = Unfolded Protein Response, CAF = cancer associated fibroblast, PVL = perivascular-like cells.
Figure 4 |
Figure 4 |. Age-related cell-cell interactions in TNBC and ER+ breast cancer.
a-f, Circle plot visualizations of the predicted homotypic and heterotypic interaction strength between major cell types in TNBC (a-c) and ER+ breast cancer (d-e) tumors from the single-cell RNA-seq atlas using CellChat v2 analysis. Circle plots are shown for patients ≤55 (younger, a, d), patients >55 (older, b, e), and the differential between age groups (c, f) for each subtype. TNBC ≤55 years (n=6, N=20,591 cells), TNBC >55 years (n=4, N=20,203 cells), ER+ ≤55 years (n=6, N=21,735 cells), ER+ >55 years (n=5, N=15,344 cells). Indicated cell types are represented by colored nodes; edge colors in a, b, d, e correspond to the source cell type; edge colors in c, f indicate stronger interaction strength in the older cohort (red) or the younger cohort (blue). Line thicknesses are proportional to the strength of interaction between given cells. Boxed insets in a, b, d, e indicate total number of interactions (I) and total interaction strength (S) for each cohort. g, i, Scatter plots representing the interaction strengths of each of the 29 minor cell types as a signaling source (x axes) and target (y axes) for indicated age cohorts in TNBC (g) and ER+ breast cancer (i). Dot sizes represent the number of interactions (count) for each cell type. h, j, Heat maps representing differential interaction strengths between each indicated target cell (x axes) and source cell (y axes) for TNBC (h) and ER+ breast cancer (j). Color scale is based on the differential interaction strength; shades of red indicate stronger interaction in the older cohort; shades of blue are stronger in the younger cohort. Bar plots at top of heat maps correspond to the absolute sum of differential incoming interaction strength for each cell type; bar plots at right of the heat maps correspond to the absolute sum of outgoing interaction strength for each cell type. Cell type color annotations are consistent throughout g-j.
Figure 5 |
Figure 5 |. Age-associated signaling network in TNBC.
a, Bubble plots representing the communication probability for each indicated ligand-receptor pair between indicated source:target cells for each age cohort (See Methods, Supplementary Table 7, and Supplementary Fig. 8). Rows depict the ligand-receptor pairs and signaling pathways; columns depict specific source-target cell interactions for the ≤55 cohort (blue) or >55 cohort (red). Communication probabilities are represented by a color scale, with minimum values colored deep blue, increasing values depicted as green, then yellow, then orange, and maximum values as deep red. Each bubble represents a signaling node predicted to be active with FDR value < 0.01 through CellChat probability calculations. Colored boxes around bubbles indicate signaling nodes that had probabilities detected at p < 0.05 in at least one age group and the difference in that probability was at least 1.2-fold greater in either the younger (blue boxes) or older (red boxes) cohort. b, Schematic representation of the signaling nodes in a and additional signaling nodes of interest following manual curation of specific cell-cell interactions (Supplementary Fig. 8, Supplementary Table 7). For clarity of representation, data were combined for monocytes/macrophages and iCAFs/myCAFs. Blue text indicates enrichment in the ≤55 age group; red text indicates enrichment in the >55 age group.
Figure 6 |
Figure 6 |. Age-associated signaling network in ER+ breast cancer.
a, Bubble plots representing the communication probability for each indicated ligand-receptor pair between indicated source:target cells for each age cohort (See Methods, Supplementary Table 7, and Supplementary Fig. 9). Rows depict the ligand-receptor pairs and signaling pathways; columns depict specific source-target cell interactions for the ≤55 cohort (blue) or > 55 cohort (red). Communication probabilities are represented by a color scale, with minimum values colored deep blue, increasing values depicted as green, then yellow, then orange, and the maximum values as deep red. Each bubble represents a signaling node predicted to be active with FDR value < 0.01 in the CellChat probability calculation. Colored boxes around bubbles indicate signaling nodes that were differentially enriched by at least 1.2- fold, in either the younger (blue boxes) or older (red boxes) cohort. b, Schematic representation of the signaling nodes in a and additional signaling nodes of interest following manual curation of specific cell-cell interactions (Supplementary Fig. 9, Supplementary Table 8). For clarity of representation, data were combined for iCAFs/myCAFs and CD8+/CD4+ T cells. Blue text indicates enrichment in the ≤55 age group; red text indicates enrichment in the >55 age group.
Figure 7 |
Figure 7 |. Working models of the age-related molecular landscapes of TNBC and ER+ breast cancer.
a, b, Schematic depicts biologically distinct functions with age in the TNBC (a) and ER+ (b) breast tumor microenvironment. Selected cell types within the tumor microenvironment are shown with abundance, transcriptional (from METABRIC and ASPEN analyses), and communication (from CellChat analysis) differences with age. Arrows between cell types are colored to coincide with the source cell. Arrows within a cell type and all text depict enrichment in older (red) or younger (blue) patients.

References

    1. Bray F. et al. Global cancer statistics 2022: GLOBOCAN estimates of incidence and mortality worldwide for 36 cancers in 185 countries. CA Cancer J. Clin. 74, 229–263 (2024). - PubMed
    1. Siegel R. L., Giaquinto A. N. & Jemal A. Cancer statistics, 2024. CA Cancer J. Clin. 74, 12–49 (2024). - PubMed
    1. Freedman R. A. et al. Breast cancer-specific survival by age: Worse outcomes for the oldest patients. Cancer 124, 2184–2191 (2018). - PMC - PubMed
    1. Cai S. et al. The Prognostic Impact of Age at Diagnosis Upon Breast Cancer of Different Immunohistochemical Subtypes: A Surveillance, Epidemiology, and End Results (SEER) Population-Based Analysis. Front. Oncol. 10, 1729 (2020). - PMC - PubMed
    1. Hutchins L. F., Unger J. M., Crowley J. J., Coltman C. A. Jr & Albain K. S. Underrepresentation of patients 65 years of age or older in cancer-treatment trials. N. Engl. J. Med. 341, 2061–2067 (1999). - PubMed

Publication types