[Preprint]. 2024 Oct 18:2024.10.17.24315607.
doi: 10.1101/2024.10.17.24315607.

Humoral waning kinetics against SARS-CoV-2 is dictated by disease severity and vaccine platform

Affiliations

Humoral waning kinetics against SARS-CoV-2 is dictated by disease severity and vaccine platform

Xin Tong et al. medRxiv. .

Abstract

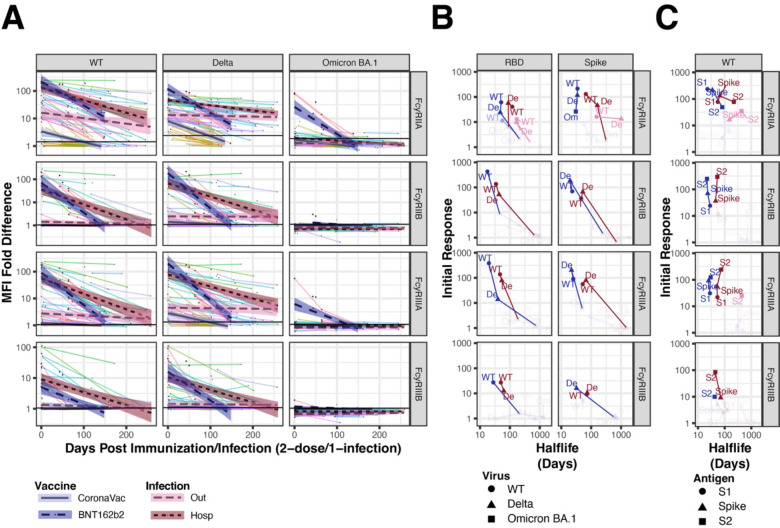
SARS-CoV-2 vaccine-acquired immunity provides robust cross-variant recognition, while infection-acquired immunity can be heterogenous, with disease severity often modulating post-recovery responses. We assessed antibody waning dynamics between infection- and vaccination-acquired immunity across variants of concern (VOC). mRNA vaccination induced potent, cross-VOC Spike recognition and functional responses, but waned more rapidly for Omicron Spike. Hospitalized individuals developed more durable functional responses with lower peaks compared to mRNA vaccination, while outpatients exhibited slower decay than inactivated vaccine recipients. Humoral decay for the receptor binding domain tracked with neutralizing antibody titers, while S2-directed responses tracked with antibody-dependent myeloid cellular phagocytosis. Boosting the recovered patients with mRNA or inactivated vaccines expanded humoral breadth, durability, and restored functional responses, eliminating the severity- and platform-associated decay differences. Therefore, post-recovery hybrid immunization compensates for this distinction and broadens humoral breadth, highlighting the value of boosting immunity in previously infected individuals.


Conflict of interest statement

Competing Interests: The authors declare the following competing interests; Galit Alter is a founder/equity holder in Seroymx Systems and Leyden Labs. G.A. has served as a scientific advisor for Sanofi Vaccines. G.A. has collaborative agreements with GSK, Merck, Abbvie, Sanofi, Medicago, BioNtech, Moderna, BMS, Novavax, SK Biosciences, Gilead, and Sanaria. R.A.M. has served as a scientific advisor for Valneva SE. The remaining authors declare no competing interests.

Figures

Fig. 1.
Fig. 1.. Antigen-specific decay over time post-infection or vaccination for binding immunoglobulins.
(A) Scatter plots show subject-specific (line color) decline in immunoglobulin response specific to WT, Delta, or Omicron BA.1 Spike. Log-linear mixed-effect models with subject-specific random intercepts and slopes estimated trend-lines and 95% confidence intervals using data from Hospitalized (dark-purple) or Outpatient (light-pink) individuals, or subjects following the second BNT162b2 dose (dark-violet) or the second CoronaVac dose (light-violet). Horizontal black lines indicate the innate Spike reactivity in naïve (no-exposure) samples. Shown are the results for IgG1 (top row), IgG3 (second row), IgA1 (third row), and IgM (bottom row). The color legend is shown on the bottom. (B) Regression intercepts and slopes, indicating initial response and decay rate, are plotted with 95% confidence intervals for each variant of concern. Decay and response parameters across variants are also plotted together and connected within vaccination/infection group by lines. Legend for virus variant shape shown at the bottom; color scheme is like A. Shaded out regions indicate a response < the 97.5th percentile of the naïve response. (C) Regression intercepts and slopes, indicating initial response and decay rate, are shown plotted with 95% confidence intervals for the two major Spike subdomains, S1 and S2. Legend for virus antigen shape shown on the bottom; the color scheme is like A. Shaded out regions indicate a response < the 97.5th percentile of the naïve response. All units are median fluorescence intensity (MFI) normalized (fold difference) with respect to the naïve group.
Fig. 2.
Fig. 2.. Antigen-specific decay over time post-infection or vaccination for FcR binding.
(A) Scatter plots show subject-specific (line color) decline in FcgR binding specific to WT, Delta, or Omicron BA.1 Spike. Log-linear mixed-effect models with subject-specific random intercepts and slopes estimated trend-lines and 95% confidence intervals using data from Hospitalized (dark-purple), or Outpatient (light-pink) individuals, or subjects following the second BNT162b2 dose (dark-violet) or the second CoronaVac dose (light-violet). Horizontal black lines indicate the innate spike reactivity in Naïve (no-exposure) samples. Results are shown for FcγRIIA (top row), FcγRIIB (second row), FcγRIIIA (third row), and FcγRIIIB (bottom row). Color legend shown on bottom. (B) Regression intercepts and slopes, indicating initial response and decay rate are plotted with 95% confidence intervals for by each variant of concern. Decay and response parameters across variants are also plotted together and connected within vaccination/infection group by lines. Legend for virus variant shape shown on bottom; color scheme is like A. Shaded-out regions indicate a response < the 97.5th percentile of the naïve response. (C) Regression intercepts and slopes, indicating initial response and decay rate, are shown plotted with 95% confidence intervals for the two major Spike subdomains, S1 and S2. Legend for virus antigen shape shown on the bottom; the color scheme is like A. Shaded-out regions indicate a response < the 97.5th percentile of the naïve response. All units are median fluorescence intensity (MFI) normalized (fold difference) with respect to the naïve group.
Fig. 3.
Fig. 3.. Functional Spike responses decay over time in a disease-severity and vaccine platform specific manner.
(A) Scatter plots show subject-specific (line color) decline in phagocytotic functional response to WT and Omicron BA. 1 Spike. Log-linear mixed-effect models with subject-specific random intercepts and slopes estimated trend-lines and 95% confidence intervals using data from Hospitalized (dark-purple) or Outpatient (light-pink) individuals, or subjects following the second BNT162b2 dose (dark-violet) or the second CoronaVac dose (light-violet). Horizontal black lines indicate the innate spike reactivity in Naïve (no-exposure) samples. Shown are the antibody functional responses of ADCP (top row), ADNP (middle row), and neutralization (bottom row). Color legend shown on bottom. (B) Regression intercepts and slopes, indicating initial response and decay rate, are plotted with 95% confidence intervals for WT and Omicron BA.1 Spike. Decay and response parameters across variants are stratified by infection/vaccination type. Legend for virus variant shape shown on bottom; color scheme is like A. Shaded out regions indicate a response < the 97.5th percentile of the naïve response.
Fig. 4.
Fig. 4.. Overall responses to Omicron Spike are largely outside of RBD.
Decay parameters are shown for WT and Omicron BA.1 Spike across all assays. Color and shape scheme is like A and B. Shaded out regions indicate a response < the 97.5th percentile of the naïve response and a naïve-fold-difference of 2. X-axis units are MFI fold difference for all antibody binding assays, Phagoscore fold difference for ADCP and ADNP, and IC50 fold difference for neutralization.
Fig. 5.
Fig. 5.. Hybrid immune response of vaccinated individuals post SARS-CoV-2 infection.
Paired t-tests are visualized for Omicron and WT Spike binding (A, B) and function (C, D) for naturally infected individuals (hospitalized or outpatients) immunized with either the CoronaVac or BNT162b2 vaccines post-infection. The infection-only boxplots (Out or Hosp) represent the fully waned response (response at the farthest timepoint following infection) while the paired post-infection vaccination boxplots represent peak immunity following vaccination. The grey line indicates the 97th percentile of naïve response. Q-values indicate the FDR corrected significance for each corresponding paired t-test. Y-axis units for A and B are MFI fold difference, while Y-axis units for C and D are Phagoscore fold difference.
Fig. 6.
Fig. 6.. Hybrid immunity induced by inactivated, or mRNA vaccination rescues the disease-severity dependent humoral decay.
(A) Violin plots showing waned post-infection (left) to peak response following the post-infection vaccination with CoronaVac (right). Shown are responses for WT Spike for IgG3 (top row), FcγRIIA- (second row) and FcγRIIIA-binding antibodies (third row), and ADNP (bottom row). Q-values are shown above pairwise comparisons for each subgroup. (B) Same as A, but for responses to Omicron BA.1 Spike. Y-axis units are MFI fold difference and Phagoscore fold difference.

References

    1. Wang C., Horby P. W., Hayden F. G., Gao G. F., A novel coronavirus outbreak of global health concern. Lancet 395, 470–473 (2020). - PMC - PubMed
    1. Li Z., Zhong Q., Li W., Zhang D., Wang W., Yang F., He K., Clinical characteristics of patients with confirmed and asymptomatic SARS-CoV-2 infection in China. PLoS One 17, e0273150 (2022). - PMC - PubMed
    1. Boyton R. J., Altmann D. M., The immunology of asymptomatic SARS-CoV-2 infection: what are the key questions? Nat Rev Immunol 21, 762–768 (2021). - PMC - PubMed
    1. Lu R., Zhao X., Li J., Niu P., Yang B., Wu H., Wang W., Song H., Huang B., Zhu N., Bi Y., Ma X., Zhan F., Wang L., Hu T., Zhou H., Hu Z., Zhou W., Zhao L., Chen J., Meng Y., Wang J., Lin Y., Yuan J., Xie Z., Ma J., Liu W. J., Wang D., Xu W., Holmes E. C., Gao G. F., Wu G., Chen W., Shi W., Tan W., Genomic characterisation and epidemiology of 2019 novel coronavirus: implications for virus origins and receptor binding. Lancet 395, 565–574 (2020). - PMC - PubMed
    1. Cele S., Gazy I., Jackson L., Hwa S. H., Tegally H., Lustig G., Giandhari J., Pillay S., Wilkinson E., Naidoo Y., Karim F., Ganga Y., Khan K., Bernstein M., Balazs A. B., Gosnell B. I., Hanekom W., Moosa M. S., Network A. for Genomic Surveillance in South, C.-K. Team, R. J. Lessells, T. de Oliveira, A. Sigal, Escape of SARS-CoV-2 501Y.V2 from neutralization by convalescent plasma. Nature 593, 142–146 (2021). - PMC - PubMed

Publication types

LinkOut - more resources