[Preprint]. 2024 Oct 18:2024.10.17.24314458.
doi: 10.1101/2024.10.17.24314458.

A human brain network linked to restoration of consciousness after deep brain stimulation

Affiliations

A human brain network linked to restoration of consciousness after deep brain stimulation

Aaron E L Warren et al. medRxiv. .

Update in

Abstract

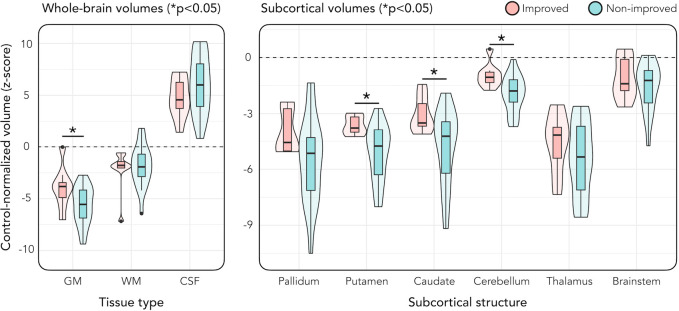
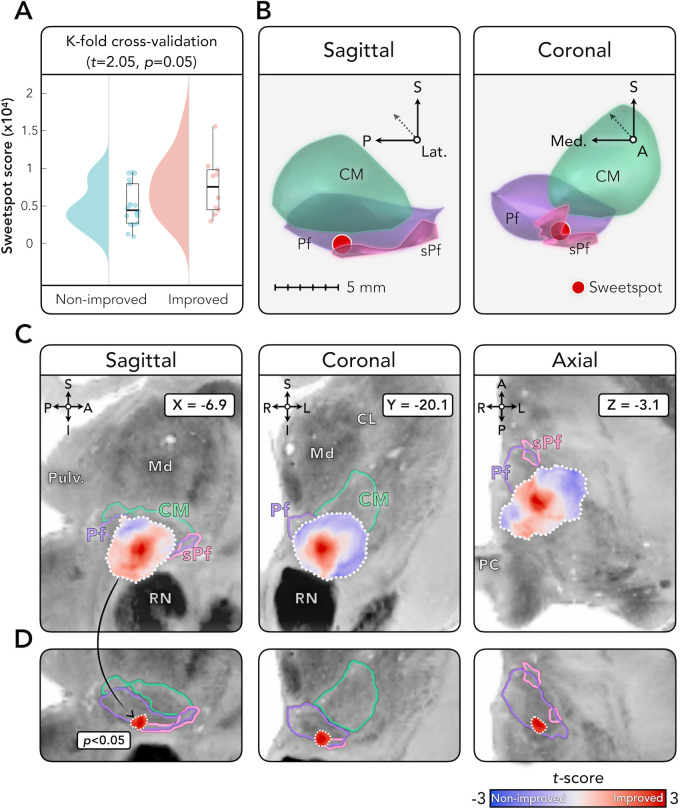
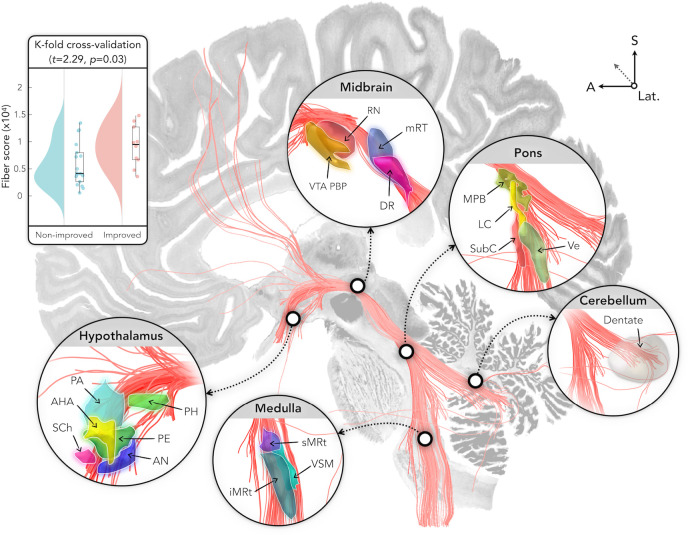
Disorders of consciousness (DoC) are states of impaired arousal or awareness. Deep brain stimulation (DBS) is a potential treatment, but outcomes vary, possibly due to differences in patient characteristics, electrode placement, or stimulation of specific brain networks. We studied 40 patients with DoC who underwent DBS targeting the thalamic centromedian-parafascicular complex. Better-preserved gray matter, especially in the striatum, correlated with consciousness improvement. Stimulation was most effective when electric fields extended into parafascicular and subparafascicular nuclei-ventral to the centromedian nucleus, near the midbrain-and when it engaged projection pathways of the ascending arousal network, including the hypothalamus, brainstem, and frontal lobe. Moreover, effective DBS sites were connected to networks similar to those underlying impaired consciousness due to generalized absence seizures and acquired lesions. These findings support the therapeutic potential of DBS for DoC, emphasizing the importance of precise targeting and revealing a broader link between effective DoC treatment and mechanisms underlying other conscciousness-impairing conditions.

Keywords: DBS; arousal; centromedian; disorders of consciousness; parafascicular; thalamus.


Conflict of interest statement

COMPETING INTERESTS AELW, MR, HF, FLWVJS, JT, SBS, JL, MMJC, KB, MUF, RJ, JEI, PWC, DF, ADB, BLE, and DC have no competing interests to report. MDF has intellectual property on the use of brain connectivity imaging to analyze lesions and guide brain stimulation, has consulted for Magnus Medical, Soterix, Abbott, Boston Scientific, and Tal Medical, and has received research funding from Neuronetics. AH reports lecture fees for Boston Scientific and is a consultant for Neuromodulation and Abbott. JDR has received past consulting payments from Medtronic, Corlieve, ClearPoint, Medtronic, and NeuroPace, and currently consults for Turing Medical.

Figures

Figure 1:
Figure 1:. Clinical outcomes and DBS electrode localizations for the improved and non-improved patient groups.
(A) Raincloud plots showing DoC severity measured before and 12 months after DBS using the Coma Recovery Scale-Revised (CRS-R), where higher scores correspond to better outcomes. Patients were categorized into improved (n=11) and non-improved (n=29) groups. (B) Three-dimensional DBS electrode localizations. All patients underwent unilateral implantation. Leads are shown with respect to the centromedian (CM) and parafascicular (Pf) nuclei, as defined by the atlas of Krauth et al. based on the histology work of Morel. Leads are shown only for patients in whom accurate image registrations were possible (n=10 improved and n=18 non-improved). (C) Two-dimensional coronal views of the thalamus showing the center of each patient’s volume of tissue activated (i.e., the modelled electric field around DBS contact(s) chosen for stimulation). Pink and blue circles indicate locations for patients in the improved and non-improved groups, respectively. Y coordinates indicate the coronal position (in mm) of each slice, in MNI 152 ICBM 2009b nonlinear asymmetric template space. Stimulation coordinates for each patient are reported in Supplementary Material. Locations are displayed upon the BigBrain histological atlas registered to MNI space.. Abbreviations: A, Anterior, CL, Central lateral nucleus, CM, Centromedian nucleus, CRS-R, Coma Recovery Scale—Revised, I, Inferior, L, Left, Lat., Lateral, LD, Lateral dorsal nucleus, Md, Mediodorsal nucleus, Pf, Parafascicular nucleus, R, Right, RN, Red nucleus, S, Superior, sPf, Subparafascicular nucleus, STh, Subthalamic nucleus.
Figure 2:
Figure 2:. Comparison of MRI tissue volumes between improved and non-improved groups.
Violin plots showing whole-brain volumes of gray matter (GM), white matter (WM), and cerebrospinal fluid (CSF) in the improved (n=8) and non-improved (n=18) groups. This analysis only included patients with T1-weighted MRI available. The plot on the right shows comparisons of subcortical gray matter volumes. The dashed horizonal line on each plot indicates the average value in age-matched controls from the Nathan Kline Institute-Rockland Sample (NKI-RS). Volumes from patients are expressed as z-scores measuring the distance, in units of SD, away from the control mean. * = p<0.05 (uncorrected).
Figure 3:
Figure 3:. Anatomical localization and cross-validation of optimal stimulation site.
(A) K-fold (k=10) cross-validation showing that E-field peak locations are associated with clinical outcomes in left-out patients (p=0.05). (B) Three-dimensional views displaying the location of the stimulation “sweet spot”, defined as the center-of-gravity of the largest cluster (p<0.05, uncorrected) following voxel-wise two-sample t-tests of E-field magnitudes between improved (n=10) and non-improved (n=18) groups. The sweet spot is shown in sagittal and coronal orientations with respect to the centromedian (CM), parafascicular (Pf), and subparafascicular (sPf) thalamic nuclei, as defined by the atlas of Krauth et al. based on the histology work of Morel. (C) Two-dimensional views of the thalamus showing an unthresholded map of t-scores where positive values indicate locations where E-field magnitudes were higher in the improved relative to non-improved group, and negative values where they were lower. The X, Y, and Z values indicate sagittal, coronal, and axial positions (mm) in MNI 152 ICBM 2009b nonlinear asymmetric template space, respectively. (D) Thresholded map (p<0.05, uncorrected) showing the peak site associated with therapeutic benefit. Results are displayed upon the BigBrain histological atlas registered to MNI space. Abbreviations: A, Anterior, CL, Central lateral nucleus, I, Inferior, L, Left, Lat., Lateral, Md, Mediodorsal nucleus, Med., Medial, P, Posterior, PC, Posterior commissure, Pulv, Pulvinar nucleus, R, Right, RN, Red nucleus, S, Superior.
Figure 4:
Figure 4:. Anatomical localization and cross-validation of optimal structural connectivity.
White matter fiber tracts more strongly involved in the improved (n=10) relative to non-improved (n=18) group (p<0.05, uncorrected). Box plots in the upper left corner show the results of K-fold (k=10) cross-validation, demonstrating that fiber tracts are associated with clinical outcome in left-out patients (p=0.03). The most strongly connected subcortical nuclei are displayed using published atlases of the hypothalamus (https://zenodo.org/records/3942115), brainstem (https://www.nitrc.org/projects/brainstemnavig), ascending arousal network (https://doi.org/10.5061/dryad.zw3r228d2), and cerebellum (https://www.diedrichsenlab.org/imaging/propatlas.htm). Results are displayed upon the BigBrain histological atlas registered to MNI space. Abbreviations: A, Anterior, AHA, Anterior hypothalamic area, AN, Arcuate nucleus, DR, Dorsal raphe nucleus, iMRt, Inferior medullary reticular formation, Lat., Lateral, LC, Locus coeruleus, MPB, Medial parabrachial nucleus, mRt, Mesencephalic reticular formation, PA, Paraventricular nucleus, PE, Periventricular nucleus, PH, Posterior hypothalamus, RN, Red nucleus, S, Superior, SCh, Suprachiasmatic nucleus, sMRt, Superior medullary reticular formation, SubC, Subcoeruleus, Ve, Vestibular nuclei complex, VSM, Viscero-sensory-motor nuclei complex, VTA PBP, Ventral tegmental area (parabrachial pigmented nucleus complex).
Figure 5:
Figure 5:. Optimal functional connectivity and alignment with brain networks disrupted in other consciousness-impairing conditions.
(A) A DBS improvement network was calculated by comparing functional connectivity of stimulation sites between improved (n=10) and non-improved (n=18) groups, using normative fMRI data., Results are t-scores (unthresholded), where positive values indicate regions of higher connectivity in the improved group and negative values indicate lower connectivity. Cortical views are shown using the fs_LR_32k template (https://balsa.wustl.edu/QXj2) and subcortical views using the BigBrain histological atlas registered to MNI space.. (B) We spatially compared the DBS improvement network (from A) to patterns of functional connectivity seen in a separate group of 45 patients with acute-onset, arousal-impairing lesions., Axial views are frequency maps showing all lesion locations. For each lesion, we calculated a whole-brain functional connectivity map. We then assessed spatial similarity between each map and our DBS improvement network. The scatter plot shows a significantly negative association with arousal outcomes in the lesional group (measured as a 6-point rating, where lower values indicate more severe impairment; for details, see, ). (C) We also assessed spatial similarity between the DBS improvement network and areas of blood-oxygen-level-dependent (BOLD) signal change during generalized spike-wave discharges in 15 patients with absence epilepsy scanned using simultaneous EEG with functional MRI (EEG-fMRI). The EEG trace shows an example of these discharges recorded inside the MRI scanner (for methodological details, refer to). EEG-fMRI results are displayed as group-level z-scores where positive values indicate increased BOLD signal during discharges and negative values indicate decreased BOLD signal. The histogram/density plot shows the results of spin permutation testing (10,000 spins), demonstrating a significantly negative correlation between the EEG-fMRI map and the DBS improvement network. Abbreviations: Conn., Connectivity, EEG, Electroencephalogram, ECG, Electrocardiogram, Func., Functional, L, Left, R, Right.

References

    1. Giacino JT, Katz DI, Schiff ND, et al. Practice guideline update recommendations summary: Disorders of consciousness: Report of the Guideline Development, Dissemination, and Implementation Subcommittee of the American Academy of Neurology; the American Congress of Rehabilitation Medicine; and the National Institute on Disability, Independent Living, and Rehabilitation Research. Neurology 2018;91(10):450–460. - PMC - PubMed
    1. Kondziella D, Bender A, Diserens K, et al. European Academy of Neurology guideline on the diagnosis of coma and other disorders of consciousness. Eur J Neurol 2020;27(5):741–756. - PubMed
    1. Edlow BL, Claassen J, Schiff ND, et al. Recovery from disorders of consciousness: mechanisms, prognosis and emerging therapies. Nat Rev Neurol 2021;17(3):135–156. - PMC - PubMed
    1. Fischer D, Edlow BL. Coma Prognostication After Acute Brain Injury: A Review. JAMA Neurol 2024. - PubMed
    1. Hassler R, Ore GD, Bricolo A, et al. EEG and clinical arousal induced by bilateral long-term stimulation of pallidal systems in traumatic vigil coma. Electroencephalogr Clin Neurophysiol 1969;27(7):689–690. - PubMed

Publication types

LinkOut - more resources