[Preprint]. 2024 Oct 21:2024.10.17.618945.
doi: 10.1101/2024.10.17.618945.

Deletions Rate-Limit Breast and Ovarian Cancer Initiation

Affiliations

Deletions Rate-Limit Breast and Ovarian Cancer Initiation

Kathleen E Houlahan et al. bioRxiv. .

Abstract

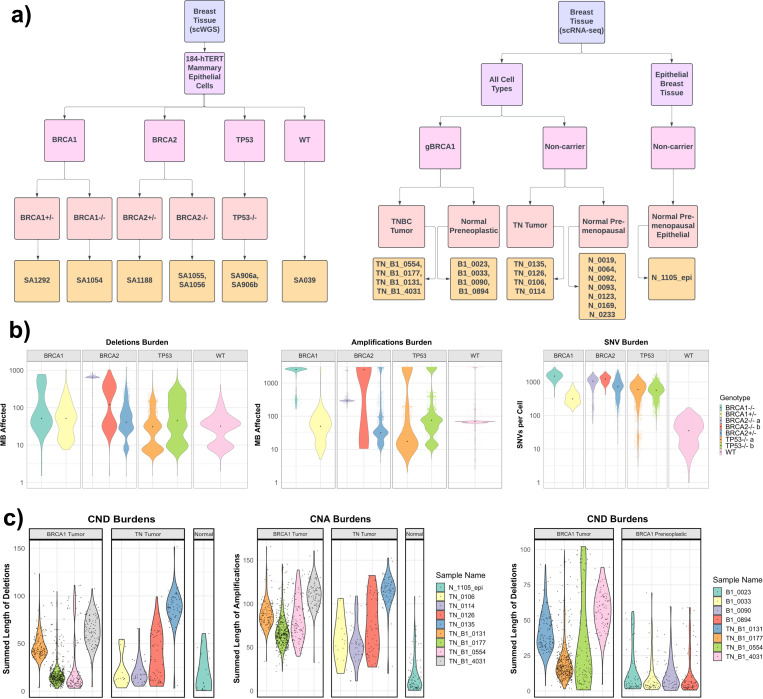
Optimizing prevention and early detection of cancer requires understanding the number, types and timing of driver mutations. To quantify this, we exploited the elevated cancer incidence and mutation rates in germline BRCA1 and BRCA2 (gBRCA1/2) carriers. Using novel statistical models, we identify genomic deletions as the likely rate-limiting mutational processes, with 1-3 deletions required to initiate breast and ovarian tumors. gBRCA1/2-driven hereditary and sporadic tumors undergo convergent evolution to develop a similar set of driver deletions, and deletions explain the elevated cancer risk of gBRCA1/2-carriers. Orthogonal mutation timing analysis identifies deletions of chromosome 17 and 13q as early, recurrent events. Single-cell analyses confirmed deletion rate differences in gBRCA1/2 vs. non-carrier tumors as well as cells engineered to harbor gBRCA1/2. The centrality of deletion-associated chromosomal instability to tumorigenesis shapes interpretation of the somatic evolution of non-malignant tissue and guides strategies for precision prevention and early detection.


Conflict of interest statement

COMPETING FINANCIAL INTERESTS K.H. is a co-founder and board member of a not-for-profit organization, Open Box Science, where he does not receive any compensation. P.C.B. sits on the scientific advisory boards of BioSymetrics, Inc. and Intersect Diagnostics, Inc. and previously sat on that of Sage Bionetworks. All other authors declare no competing financial interests.

Figures

Figure 1:
Figure 1:. Increased mutation burden in BRCA1 and BRCA2 carriers
(a) Breast and ovarian tumors in BRCA1 and BRCA2 carriers show an increased mutation rate (bp/year) compared to non-carrier (WT) individuals. Dot size and colour reflect β magnitude and direction from linear regression correcting for stage, grade and subtype. Background shading indicates FDR. Covariate along the top indicates gene and cancer type. b-c) Boxplots show increased coding SNV mutation rate (bp/year) in breast (b) and ovarian (c) tumors in BRCA1 and BRCA2 carriers compared to WT. Boxplots represent median, 0.25 and 0.75 quantiles with whiskers are 1.5x interquartile range. β and FDR from linear regression. d) BRCA1 and BRCA2 carriers show an increased CNA deletion rate compared to WT in ovarian tumors. e) BRCA1 and BRCA2 carriers show an increased small deletion rate compared to WT in breast tumors. NV: single nucleotide variants; CNA: copy number aberrations; DEL: deletions; INDEL: small insertion and deletions
Figure 2:
Figure 2:. SNV and CNA mutation burden alone cannot explain breast and ovarian cancer incidence
Estimated incidence rates based on SNV (a-d) and CNA (e-h) mutational burden with the increasing number of drivers cannot explain the observed incidence ratio of breast and ovarian cancer in BRCA1 and BRCA2 carriers. Points represent estimated incidence ratios based on the number of driver events along the x-axis for breast cancer in BRCA1 (a&e) and BRCA2 (b&f) carriers and ovarian cancer in BRCA1 (c&g) and BRCA2 (d&h) carriers. Error bars indicate 95% confidence intervals. The horizontal line indicates observed incidence rate, and grey shading indicates 95% confidence intervals.
Figure 3:
Figure 3:. Deletions are the likely rate-limiting mutational process in BRCA1 and BRCA2 carriers
a-d) Incidence estimates based on deletion rates converge on the observed incidence rate. Deletion burden calculated as the number of base pairs altered normalized by age at diagnosis. e-h) Incidence estimates based on small deletions. i-l) Incidence estimates based on gain rates. Segplots compare estimated incidence rate to observed incidence rate as described in Figure 2.
Figure 4:
Figure 4:. Empirical driver and timing prediction from sequencing studies
a) Summary of the minimum number of drivers estimated for each cancer type, carrier and mutation type modeled. Grey background indicates the model did not converge and covariate along the left indicates cancer type, carrier and mutation type modeled. b-c) The average number of drivers per patient observed for each gene from sequencing data in TCGA breast and ovarian cancers. The top 10 genes with the highest average driver count per patient are colored distinctively, and all other driver genes are grouped into a single category. Connections between stacked bars indicate the same genes in the top 10 across the driver prioritization method and variant type. Each stacked bar signifies the average total driver SNV or CNA found amongst patients with breast (b) and ovarian (c) cancers. d-e) Recurrence (y-axis) and relative timing (early vs. late; x-axis) for 28 and 26 drivers in breast (d) and ovarian (e) cancer, respectively. Drivers are colored based on the type of mutational event. The union of the top five most recurrent and earliest occurring drivers are labeled.
Figure 5.
Figure 5.. Single-cell comparison of rate-limiting mutational process in gBRCA1/2 vs non-carrier tumor samples and genetically engineered cells
a) Summary flowchart of single cell datasets and samples used for analyses, including in the left panel, data from Funnell, T. et al. (2022) that provided scWGS-analyzed 184-hTERT Mammary Epithelial Cells with genetically-engineered BRCA1, BRCA2, and TP53 genotypes. On the right panel, Pal, B. et al. (2021) provided scRNA-Seq-analyzed samples from gBRCA1 carriers and non-carriers, including Triple Negative Breast Cancer (TNBC) tumor tissues, premenopausal/pre-neoplastic normal breast tissues. b) Cell-level comparison of deletion, amplification, and SNV burdens in genetically-engineered BRCA1, BRCA2, TP53, and WT cells included in the scWGS dataset. c) Cell-level comparison of deletion and amplification burdens of TNBCs from gBRCA1 carriers and non-carriers (left) and gBRCA1 TNBCs and pre-neoplastic normal breast tissues included in the scRNA-Seq dataset, where CNAs were inferred using inferCNV. For (b-c), each point provides the genomic alteration burden of a given cell in the sample. For amplifications/deletions, the CNA burdens were calculated by the summed length of megabase affected. The dot in each violin represents the median cell in a given sample.

Similar articles

References

    1. Vogelstein B., Papadopoulos N., Velculescu V. E., Zhou S., Diaz L. A. Jr, Kinzler K. W., Cancer genome landscapes. Science 339, 1546–1558 (2013). - PMC - PubMed
    1. Garraway L. A., Lander E. S., Lessons from the cancer genome. Cell 153, 17–37 (2013). - PubMed
    1. Tan W. Y., Yan X. W., A new stochastic and state space model of human colon cancer incorporating multiple pathways. Biol Direct 5, 26 (2010). - PMC - PubMed
    1. Little M. P., Are two mutations sufficient to cause cancer? Some generalizations of the two-mutation model of carcinogenesis of Moolgavkar, Venzon, and Knudson, and of the multistage model of Armitage and Doll. Biometrics 51, 1278–1291 (1995). - PubMed
    1. Wu S., Zhu W., Thompson P., Hannun Y. A., Evaluating intrinsic and non-intrinsic cancer risk factors. Nature Communications 9, (2018). - PMC - PubMed

Publication types

LinkOut - more resources