[Preprint]. 2024 Oct 26:2024.10.23.619827.
doi: 10.1101/2024.10.23.619827.

Immunogenic shift of arginine metabolism triggers systemic metabolic and immunological reprogramming to prevent HER2+ breast cancer

Affiliations

Immunogenic shift of arginine metabolism triggers systemic metabolic and immunological reprogramming to prevent HER2+ breast cancer

Vandana Sharma et al. bioRxiv. .

Update in

Abstract

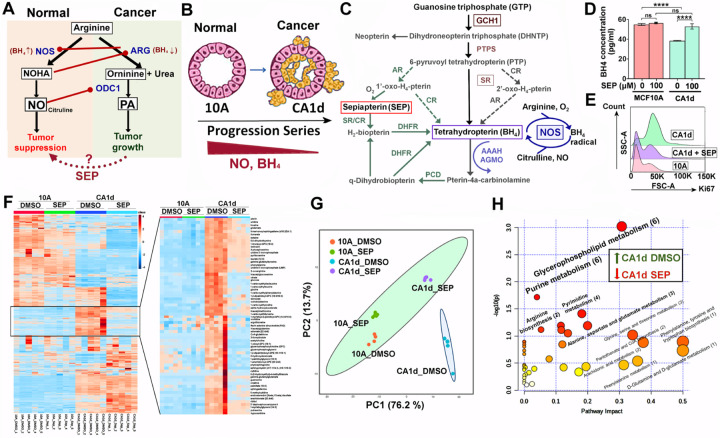
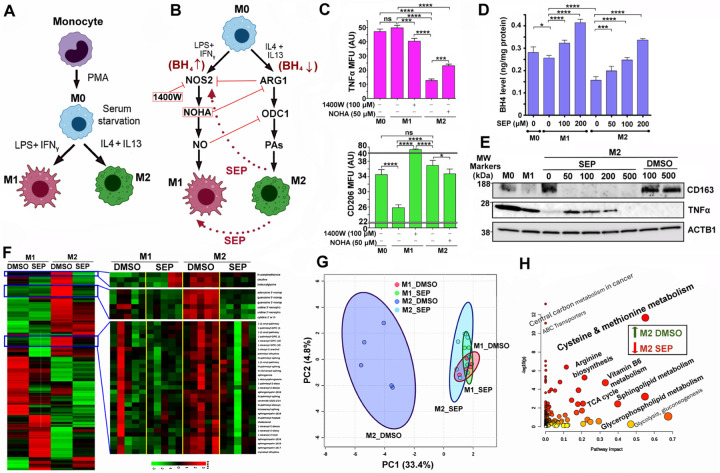
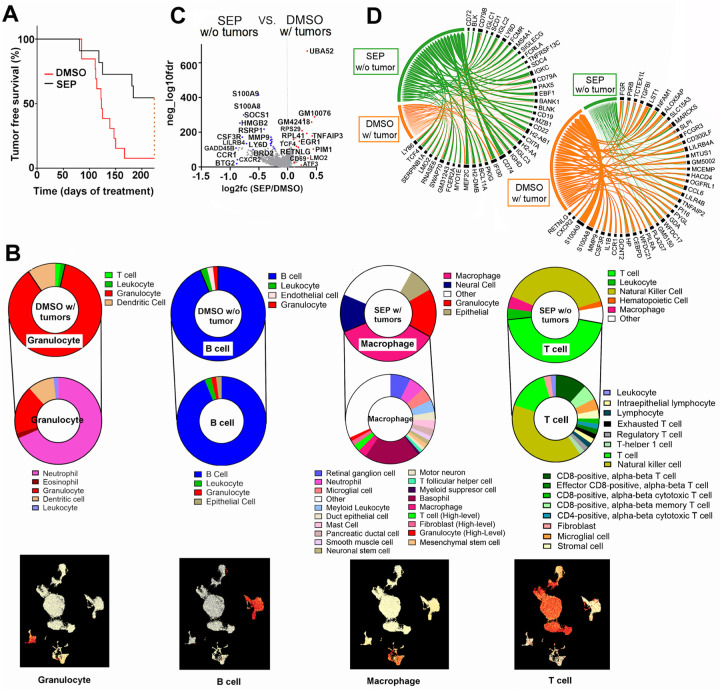
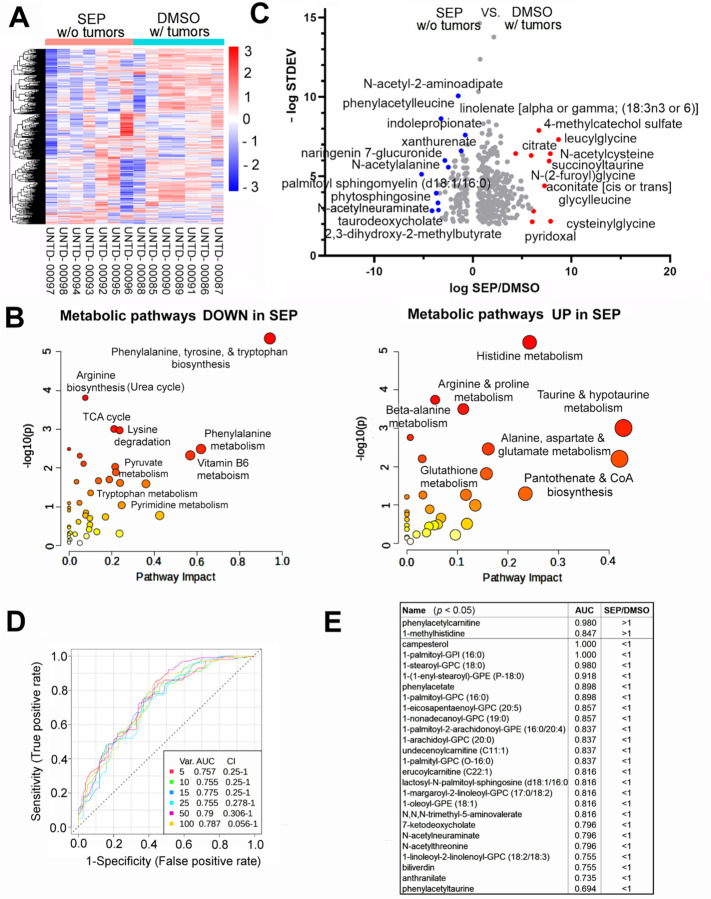
Arginine metabolism in tumors is often shunted into the pathway producing pro-tumor and immune suppressive polyamines (PAs), while downmodulating the alternative nitric oxide (NO) synthesis pathway. Aiming to correct arginine metabolism in tumors, arginine deprivation therapy and inhibitors of PA synthesis have been developed. Despite some therapeutic advantages, these approaches have often yielded severe side effects, making it necessary to explore an alternative strategy. We previously reported that supplementing SEP, the endogenous precursor of BH4 (the essential NO synthase cofactor), could correct arginine metabolism in tumor cells and tumor-associated macrophages (TAMs) and induce their metabolic and phenotypic reprogramming. We saw that oral SEP treatment effectively suppressed the growth of HER2-positive mammary tumors in animals. SEP also has no reported dose-dependent toxicity in clinical trials for metabolic disorders. In the present study, we report that a long-term use of SEP in animals susceptible to HER2-positive mammary tumors effectively prevented tumor occurrence. These SEP-treated animals had undergone reprogramming of the systemic metabolism and immunity, elevating total T cell counts in the circulation and bone marrow. Given that bone marrow-resident T cells are mostly memory T cells, it is plausible that chronic SEP treatment promoted memory T cell formation, leading to a potent tumor prevention. These findings suggest the possible roles of the SEP/BH4/NO axis in promoting memory T cell formation and its potential therapeutic utility for preventing HER2-positive breast cancer.

Keywords: HER2; T cells; arginine; breast cancer; cancer prevention; metabolism; nitric oxide; polyamines.


Conflict of interest statement

Disclosure and competing interests statement The authors declare that they have no conflict of interest.

Figures

Figure 1.
Figure 1.. Reprogramming arginine metabolism inhibits the growth of HER2+ breast cancer cells.
A. Bimodal arginine metabolism leading to two antagonizing pathways: NO vs. PA syntheses. NOS: nitric oxide synthase, NOHA (Nω-hydroxy-nor-arginine); ARG: arginase; ODC1: ornithine decarboxylase 1. B. MCF10A (normal) >> CA1d (invasive) in MCF10A human breast cancer progression series showing the decrease of NO and BH4 levels along with cancer progression. C. BH4 biosynthesis pathways featuring sepiapterin (SEP) as a precursor. D. Reduced BH4 levels in cancerous CA1d compared to normal MCF10A cells, and normalization of the levels after SEP (100 µM) treatment for 2 days (12). E. Normalization of a proliferation marker Ki67 levels in CA1d cells treated with SEP. F. (Left) Heatmap of metabolite levels in MCF10A cells vs. CA1d cells treated with control DMSO vs. SEP (n=5). (Right) Metabolites normalized in CA1d after SEP treatment. G. Principal component analysis (PCA) of metabolites normalized in SEP-treated CA1d. Note the co-localization of SEP-treated CA1d with 10A (DMSO or SEP-treated) and a segregation of DMSO-treated CA1d. H. Pathway analysis of metabolites normalized (downmodulated) in SEP-treated CA1d. Note the significant involvements of fatty acid and nucleotide metabolisms in the normalized pathways.
Figure 2.
Figure 2.. Redirecting arginine metabolism reprograms tumor-associated macrophages (TAMs).
A. Scheme for differentiation of monocytes into naïve (M0) macrophages and subsequent M1 vs. M2 polarization in vitro. B. Discrete arginine metabolic pathways in M1 vs. M2 macrophages and their antagonistic relationships. Scheme for phenotypic conversions between M1 and M2 macrophages by inhibiting NOS2 in M1 (M1→M2 conversion) vs. ARG1 in M2 (M2→M1 conversion) or providing SEP to M2 (M2→M1 conversion) (18,19). C. (Top) M1 marker TNFα levels in different subsets of macrophages (M0, M1, or M2) treated with an NOS2 inhibitor 1400W or ARG1 inhibitor NOHA. MFU: Mean fluorescence unit. (Bottom) M2 marker CD206 levels in macrophage subsets treated with 1400W or NOHA. Note that 1400W treatment of M1 cells reduced TNFα levels, but increased CD206 levels. Conversely, NOHA treatment of M2 cells elevated TNFα levels, but decreased CD206 levels. D. Reduced BH4 levels in M2 macrophages, compared to M0 and M1 macrophages, and dose-dependent normalization of the levels after SEP (50, 100, or 200 µM) treatment for 3 days. E. Treatment of M2 macrophages with SEP (50, 100, or 200 µM) lowered M2 marker (CD163) levels, while elevating M1 marker (TNFα) levels. Note that the decrease of TNFα levels in M2 cells treated with the extremely high (500 µM) SEP was presumably due to reduced viability of cells. F. (Left) Heatmap of metabolite levels in M1 vs. M2 macrophages treated with control DMSO vs. SEP (n=5). (Right) Metabolites normalized in M2 macrophages after SEP treatment. G. PCA of metabolites normalized in SEP-treated M2 macrophages. Note the co-localization of SEP-treated M2 with M1 (DMSO or SEP-treated) macrophages and segregation of DMSO-treated M2. H. Pathway analysis of metabolites normalized (downmodulated) in SEP-treated M2 macrophages. Note the significant involvements of these metabolites in energy production, including TCA cycle, lipid and amino acid metabolism.
Figure 3.
Figure 3.. Long-term oral SEP treatment prevents mammary tumor occurrence of MMTV-neu mice, while inducing systemic immunological reprogramming.
A. Tumor-free survival curves of MMTV-neu mice treated with control DMSO vs. SEP (1 mg/kg, n=20) in drinking water. B. Major cell types (top) and sub cell types (middle) determined by single cell sequencing of PBMCs of DMSO with tumor, DMSO without tumor, SEP with tumor, and SEP without tumor groups. (Bottom) UMAPs featuring the major cell type for each group. Note the enrichment of T cells in PBMCs of SEP without tumor group. C. Volcano plot for differentially expressed genes in PBMCs of MMTV-neu mice which were SEP-treated and did not develop tumors (SEP without tumors) vs. DMSO-treated and developed tumors (DMSO with tumors). D. Chord diagrams of genes elevated (left) or downmodulated (right) in PBMCs of SEP without tumor group compared to those of DMSO with tumor group
Figure 4.
Figure 4.. Long-term oral SEP induces systemic metabolic reprogramming in MMTV-neu mice.
A. Heatmap of metabolite levels in the plasma of SEP without tumor group vs. DMSO with tumor group of MMTV-neu mice (n=7). Note the global decreases of metabolites in SEP without tumor group. B. Metabolic pathways downregualted (left) and upregulated (right) in SEP without tumor group compared to DMSO with tumor group. Note that metabolites lowered in the former group mostly belonged to energy production and immune suppression pathways, including TCA cycle, nucleotide, phenylalanine, and tryptophan metabolism. Conversely, metabolites elevated in the former group mainly belonged to pro-inflammatory pathways, including histidine/histamine, taurine, and CoA metabolism. C. Volcano plot for differentially represented metabolites in the plasma of SEP without tumor group vs. DMSO with tumor group. Note the significant reduction of tumor-associated metabolites, including N-acetylneuraminate and palmotyl sphingomyelin (59,102). Conversely, the increases in citrate and aconitate indicate inhibition of the TCA cycle. D. Receiver operating characteristic (ROC) curve analysis (multivariate, random forest regression) on differentially represented metabolites. E. Metabolites with the largest Area under Curve values (AUC~1) and statistical sifnicance (p<0.05).
Figure 5.
Figure 5.. CUT & Tag analysis of bone marrow of SEP-treated MMTV-neu mice reveals increased levels of total T cells.
A-B The heatmaps (A) and peak sizes (B) of H3K27me3 (suppression) and H3K27ac (activation) histone marks of the bone marrows of DMSO with tumor vs. SEP without tumor groups of MMTV-neu mice. Note that both histone marks were higher in the latter than the former groups. C. Pathways of genes with elevated H3K27me3 mark (more strongly suppressed, left) vs. pathways of genes with elevated H3K27ac mark (more strongly activated, right) in SEP without tumor group compared to DMSO with tumor group. Note that SEP-suppressed pathways belonged to those involved in immune suppression (e.g., IL5 production), whereas SEP-activated pathways belonged to those involved in pro-inflammatory responses (e.g., IL-6 production). D. H3K27me3 and H3K27ac marks of select SEP-activated genes involved in T cell activation or memory T cell formation (IL6RA, IL7R, IFNGR2, and CD44 (–86). E. Bone marrow cell compositions determined based on epigenomic profiles (predicted by Cellkb). Note the significant increase in T cell, NK cell and stem cells in the bone marrow of SEP-treated animals.

Similar articles

Cited by

References

    1. Tapiero H, Mathé G, Couvreur P, Tew KD. I. Arginine. Biomedicine & Pharmacotherapy 2002;56(9):439–45. - PubMed
    1. Hogarty MD, Norris MD, Davis K, Liu X, Evageliou NF, Hayes CS, et al. ODC1 is a critical determinant of MYCN oncogenesis and a therapeutic target in neuroblastoma. Cancer Res 2008;68(23):9735–45. - PMC - PubMed
    1. Bachmann AS, Geerts D. Polyamine synthesis as a target of MYC oncogenes. J Biol Chem 2018;293(48):18757–69. - PMC - PubMed
    1. Bauer PM, Buga GM, Fukuto JM, Pegg AE, Ignarro LJ. Nitric oxide inhibits ornithine decarboxylase via S-nitrosylation of cysteine 360 in the active site of the enzyme. J Biol Chem 2001;276(37):34458–64. - PubMed
    1. Tenu JP, Lepoivre M, Moali C, Brollo M, Mansuy D, Boucher JL. Effects of the new arginase inhibitor N(omega)-hydroxy-nor-L-arginine on NO synthase activity in murine macrophages. Nitric Oxide 1999;3(6):427–38. - PubMed

Publication types