[Preprint]. 2024 Oct 24:2024.10.22.619694.
doi: 10.1101/2024.10.22.619694.

α-Synuclein Strain Dynamics Correlate with Cognitive Shifts in Parkinson's Disease

Affiliations

α-Synuclein Strain Dynamics Correlate with Cognitive Shifts in Parkinson's Disease

Kundlik Gadhave et al. bioRxiv. .

Abstract

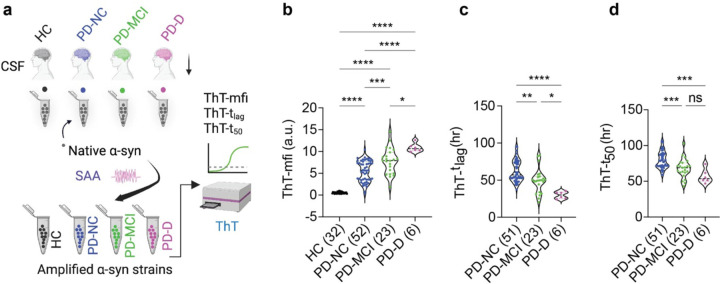
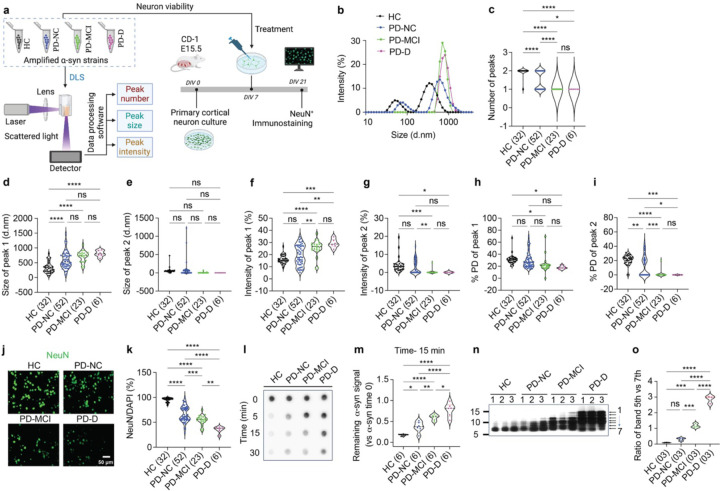
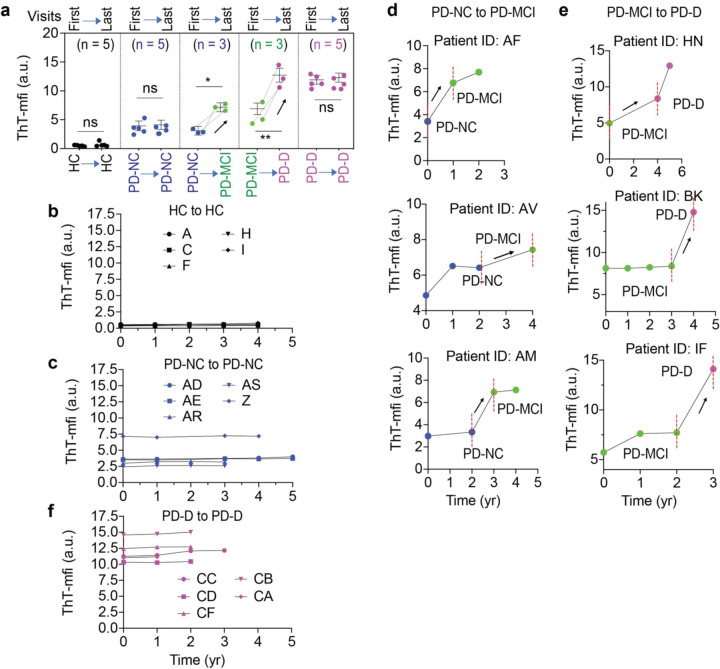
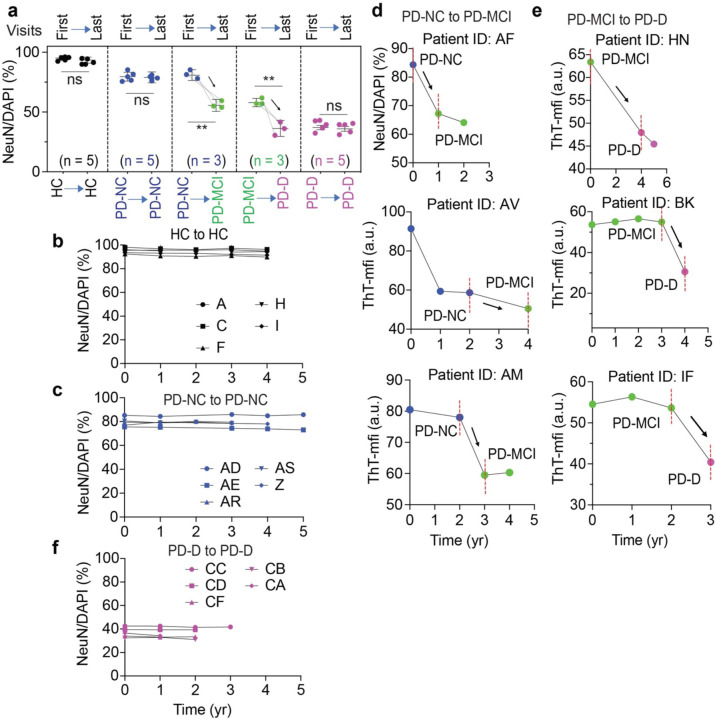
α-Synuclein (α-syn) strains can serve as discriminators between Parkinson's disease (PD) from other α-synucleinopathies. The relationship between α-syn strain dynamics and clinical performance as patients transition from normal cognition (NC) to cognitive impairment (CI) is not known. Here, we show that the biophysical properties and neurotoxicity of α-syn strains change as PD cognitive status transitions from NC to mild cognitive impairment (PD-MCI) and dementia (PD-D). Both cross-sectional and longitudinal analyses reveal distinct α-syn strains in PD patients correlating to their level of cognitive impairment. This study presents evidence that individuals with PD have different α-syn strains that change in accordance with their cognitive status and highlights the potential of α-syn strain dynamics to guide future diagnosis, management, and stratification of PD patients.

Keywords: SAA; cognitive impairment; strain; α-synuclein.


Figures

Figure 1.
Figure 1.. Differentiating amplified α-syn strains via Thioflavin T (ThT) derived from patients with PD-NC, PD-MCI, and PD-D.
(a) Schematic representation of α-syn amplification and characterization using ThT assay. In these groups: HC (health control), PD-NC (PD with normal cognition), PD-MCI (PD with mild cognitive impairment), PD-D (PD with dementia), and CSF samples were amplified with SAA and the ThT assay was performed. (b) ThT-mfi (maximal fluorescence intensity) of CSF-SAA samples. HC (n = 32), PD-NC (n = 52), PD-MCI (n = 23), and PD-D (n = 6). (c) ThT-tlag (time at which aggregation started) of CSF-SAA samples. PD-NC (n = 51), PD-MCI (n = 23), and PD-D (n = 6). (d) ThT-t50 (time at which aggregation is 50% complete) of CSF-SAA samples. PD-NC (n = 51), PD-MCI (n = 23), and PD-D (n = 6). Data are mean ± SEM. The statistical significance was evaluated via one-way ANOVA with Tukey’s multiple comparisons test. No significant difference (ns) P > 0.05, *P < 0.05, **P < 0.01, ***P < 0.001, ****P < 0.0001. Every dot indicates an individual biological sample measured in duplicate.
Figure 2.
Figure 2.. Differentiating α-syn strains using dynamic light scattering (DLS), cell-based, and biochemical assays.
(a) Schematic representation of the characterization of α-syn strains from HC, PD-NC, PD-MCI, and PD-D. DLS data processing provides peak number, peak size, and peak intensities. Neuronal culture were used to assess neurotoxicity. (b) DLS spectra of amplified α-syn strains from HC, PD-NC, PD-MCI, and PD-D. (c) The number of DLS peaks for HC (n = 32), PD-NC (n = 52), PD-MCI (n = 23), and PD-D (n = 6). (d) Size of peak 1 from DLS for amplified α-syn strains from HC, PD-NC, PD-MCI, and PD-D. (e) Size of peak 2 from DLS for amplified α-syn strains from HC, PD-NC, PD-MCI, and PD-D. (f) Intensity of peak 1 from DLS for amplified α-syn strains from HC, PD-NC, PD-MCI, and PD-D. (g) Intensity of peak 2 from DLS for amplified α-syn strains from HC, PD-NC, PD-MCI, and PD-D. (h) %PD of peak 1 from DLS for amplified α-syn strains from HC, PD-NC, PD-MCI, and PD-D. (i) %PD of peak 2 from DLS for amplified α-syn strains from HC, PD-NC, PD-MCI, and PD-D. (j & k) Neurotoxicity of α-syn strains assessed with the immunostaining and quantification of anti-NeuN (neuronal nuclei marker). Scale bar, 50 μm. (l) α-Syn dot-blot immunostaining after proteinase K (PK)-digestion and (m) quantification. (n) SDS–PAGE followed by silver staining of PK-digested α-syn strains and (o) quantification. (c, d, e, f, g, h, i, k, m,o) Each dot represents an individual biological sample. The violin plot shows all the points. Data are presented as the mean ± SEM. The statistical significance was evaluated via one-way ANOVA with Tukey’s multiple comparisons test. No significant difference (ns) P > 0.05, *P < 0.05, **P < 0.01, ***P < 0.001, ****P < 0.0001.
Figure 3.
Figure 3.. Longitudinal analysis of α-syn strains using ThT-mfi.
(a) ThT-mfi of amplified α-syn strains from HC, PD-NC, PD-MCI, and PD-D groups between the first- and last-visit of Cohort I. (b,c,f) Yearly mapping of ThT-mfi of amplified α-syn strains from individuals with stable cognitive status. (d,e) Yearly mapping of ThT-mfi of amplified α-syn strains from individuals with changed cognitive status. The statistical significance was evaluated via one-way ANOVA with Tukey’s multiple comparisons test. No significant difference (ns) P > 0.05, *P < 0.05, **P < 0.01.
Figure 4.
Figure 4.. Longitudinal analysis (yearly) for the neurotoxicity of α-syn strains from HC, PD-NC, PD-MCI, and PD-D.
Amplified α-syn strains (10 μg/mL) were added to mouse cortical neurons at DIV 7 days. 21 days later neurotoxicity was determined via NeuN counting. (a) Neurotoxicity of amplified α-syn strains from longitudinal HC, PD-NC, PD-MCI, and PD-D groups between the first- and last-visit in Cohort I. (b,c,f) Yearly mapping of neurotoxicity of amplified α-syn strains from individuals with stable cognitive status. (d,e) Yearly mapping of neurotoxicity of amplified α-syn strains from individuals with changed cognitive status. The statistical significance was evaluated via one-way ANOVA with Tukey’s multiple comparisons test. No significant difference (ns) P > 0.05, **P < 0.01.

References

    1. Shahnawaz M. et al. Discriminating alpha-synuclein strains in Parkinson’s disease and multiple system atrophy. Nature 578, 273–277 (2020). 10.1038/s41586-020-1984-7 - DOI - PMC - PubMed
    1. Okuzumi A. et al. Propagative alpha-synuclein seeds as serum biomarkers for synucleinopathies. Nat Med 29, 1448–1455 (2023). 10.1038/s41591-023-02358-9 - DOI - PMC - PubMed
    1. Siderowf A. et al. Assessment of heterogeneity among participants in the Parkinson’s Progression Markers Initiative cohort using alpha-synuclein seed amplification: a cross-sectional study. Lancet Neurol 22, 407–417 (2023). 10.1016/S1474-4422(23)00109-6 - DOI - PMC - PubMed
    1. Irwin D. J. et al. Neuropathological and genetic correlates of survival and dementia onset in synucleinopathies: a retrospective analysis. Lancet Neurol 16, 55–65 (2017). 10.1016/S1474-4422(16)30291-5 - DOI - PMC - PubMed
    1. Smith C. et al. Neuropathology of dementia in patients with Parkinson’s disease: a systematic review of autopsy studies. J Neurol Neurosurg Psychiatry 90, 1234–1243 (2019). 10.1136/jnnp-2019-321111 - DOI - PubMed

Publication types

LinkOut - more resources