[Preprint]. 2024 Oct 26:2024.10.25.620311.
doi: 10.1101/2024.10.25.620311.

Cellular and molecular mechanisms that shape the development and evolution of tail vertebral proportion in mice and jerboas

Affiliations

Cellular and molecular mechanisms that shape the development and evolution of tail vertebral proportion in mice and jerboas

Ceri J Weber et al. bioRxiv. .

Abstract

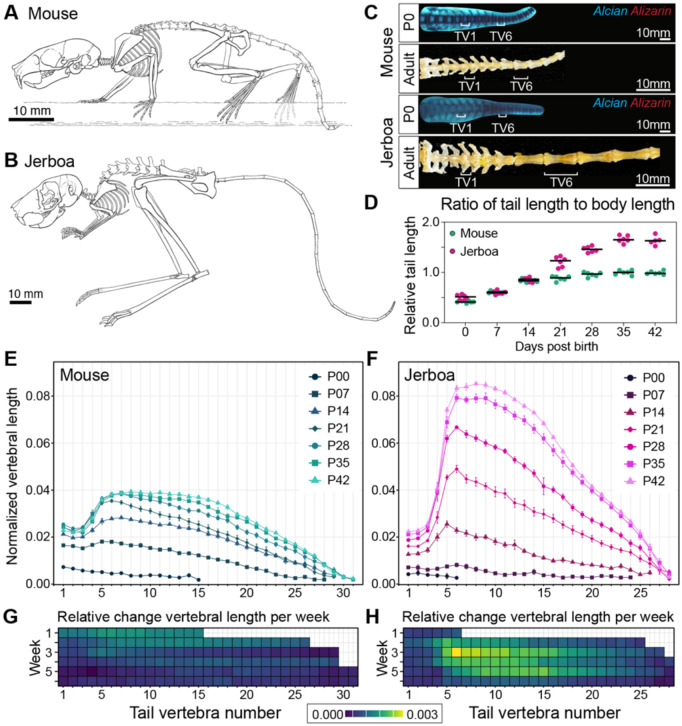
Despite the functional importance of the vertebral skeleton, little is known about how individual vertebrae elongate or achieve disproportionate lengths as in the giraffe neck. Rodent tails are an abundantly diverse and more tractable system to understand mechanisms of vertebral growth and proportion. In many rodents, disproportionately long mid-tail vertebrae form a 'crescendo-decrescendo' of lengths in the tail series. In bipedal jerboas, these vertebrae grow exceptionally long such that the adult tail is 1.5x the length of a mouse tail, relative to body length, with four fewer vertebrae. How do vertebrae with the same regional identity elongate differently from their neighbors to establish and diversify adult proportion? Here, we find that vertebral lengths are largely determined by differences in growth cartilage height and the number of cells progressing through endochondral ossification. Hypertrophic chondrocyte size, a major contributor to differential elongation in mammal limb bones, differs only in the longest jerboa mid-tail vertebrae where they are exceptionally large. To uncover candidate molecular mechanisms of disproportionate vertebral growth, we performed intersectional RNA-Seq of mouse and jerboa tail vertebrae with similar and disproportionate elongation rates. Many regulators of posterior axial identity and endochondral elongation are disproportionately differentially expressed in jerboa vertebrae. Among these, the inhibitory natriuretic peptide receptor C (NPR3) appears in multiple studies of rodent and human skeletal proportion suggesting it refines local growth rates broadly in the skeleton and broadly in mammals. Consistent with this hypothesis, NPR3 loss of function mice have abnormal tail and limb proportions. Therefore, in addition to genetic components of the complex process of vertebral evolution, these studies reveal fundamental mechanisms of skeletal growth and proportion.


Figures

Figure 1.
Figure 1.. Development of mouse and jerboa tail proportion.
(A-B) Diagram of adult mouse (A) and jerboa (B) skeletons modified from Moore et al. 2015. (C) Alcian and alizarin-stained neonates show all proximal vertebral elements are present at P0 in both species. Cleaned adult proximal tail skeletons show similar vertebral morphologies despite differences in size and proportion. (D) Mouse and jerboa tails are about half of the naso-anal length at birth. Tail proportion diverges by P21; the mouse tail remains about equal to body length while the jerboa tail elongates to 1.5x the body length. (E-H) Lengths of vertebral centra measured weekly from birth to six weeks, normalized to the naso-anal length of each mouse (E) and jerboa (F). The weekly relative change in length of each vertebra is represented in a heat map. The greatest rate of change is yellow and least in dark blue with the scale equivalent for mouse (G) and jerboa (H).
Figure 2.
Figure 2.. Cellular parameters of growth during the greatest difference in vertebral elongation rate.
(A) Schematic of tail vertebrae with cranial and caudal growth cartilage color schemes used throughout. (B-C) Histology of mouse and jerboa cranial and caudal growth cartilages of TV1 (B) and TV6 (C) during rapid elongation. (RZ=resting zone, PZ=proliferative zone, HZ=hypertrophic zone). (D-I) Growth cartilage parameters in each cranial and caudal of mouse and jerboa TV1 and TV6. (D) Daily elongation rate. (E) Height of the growth plate. (F) Height of the proliferative zone. (G) Proliferative index calculated as the fraction of EdU+ cells of all cells in an ROI. (H) Height of the hypertrophic zone. (I) Maximum height of hypertrophic chondrocytes in the direction of bone elongation. Welch’s t-test, n=>9 of mixed male and female animals, * ≤ 0.05, ** ≤ 0.01, *** ≤ 0.001, **** ≤ 0.0001.
Figure 4.
Figure 4.. Design and analysis of intersectional interspecies transcriptomics.
(A-C) Schematics of the interspecies and intraspecies comparison approaches of differential expression analyses. (E) 1,864 genes are significantly differentially expressed between mouse and jerboa TV6 but not between species in TV1. Genes that are expressed higher in jerboa TV6 are orange; lower are purple. (F) 6,786 genes are significantly differentially expressed between jerboa and mouse both in TV6 (y-axis) and in TV1 (x-axis); most are equivalently differentially expressed (gray points, slope=0.883), but 421 genes are outside of the 95% prediction interval and designated disproportionately differentially expressed. (F) Of all 2,285 genes highlighted in D and E, 1,454 are also differentially expressed in jerboa TV6 versus TV1, consistently in the same direction in the longest versus shortest element. Genes in orange are expressed higher in jerboa TV6 compared to mouse TV6 and in jerboa TV6 compared to jerboa TV1, while those lower in both comparisons are in purple. (G) Selection of GO terms relevant to cartilage that are enriched among the 1,454 candidate genes.
Figure 5.
Figure 5.. Natriuretic peptide signaling affects tail vertebrae proportion.
(A) Ratio of tail length to naso-anal distance in adult (P42) Npr3−/− mice (orange triangle) and wildtype Npr3+/+ siblings (gold square) compared to average relative tail lengths in CD1 mice (shades of blue). (B) Lengths of vertebral centra at P42 normalized to the naso-anal length of each Npr3−/− (orange triangle) and wildtype Npr3+/+ siblings (gold square). Normalized vertebral lengths for CD1 mice at P07, P21, and P42 are displayed for comparison. The distal-most vertebrae in all Npr3−/− mice and siblings were not measurable due to the lower μCT-scanner resolution. (C) Npr3−/− mouse with wildtype sibling aged P42. White arrowhead points to ‘cone-shaped implantation of the tail’.

Similar articles

References

    1. Arnold P., Amson E., and Fischer M.S. (2017). Differential scaling patterns of vertebrae and the evolution of neck length in mammals. Evolution 71, 1587–1599. 10.1111/evo.13232. - DOI - PubMed
    1. Narita Y., and Kuratani S. (2005). Evolution of the vertebral formulae in mammals: a perspective on developmental constraints. J Exp Zool B Mol Dev Evol 304, 91–106. 10.1002/jez.b.21029. - DOI - PubMed
    1. Mincer S.T., and Russo G.A. (2020). Substrate use drives the macroevolution of mammalian tail length diversity. Proc Biol Sci 287, 20192885. 10.1098/rspb.2019.2885. - DOI - PMC - PubMed
    1. Couly G.F., Coltey P.M., and Douarin N.M.L. (1993). The triple origin of skull in higher vertebrates: a study in quail-chick chimeras. Development 117, 409–429. 10.1242/dev.117.2.409. - DOI - PubMed
    1. Cooper K.L., and Tabin C.J. (2009). Developmental patterning of the limb skeleton. In The Skeletal System (Cold Spring Harbor Press; ), p. 39.

Publication types

LinkOut - more resources