[Preprint]. 2024 Oct 22:2024.10.18.619054.
doi: 10.1101/2024.10.18.619054.

A genome-to-proteome atlas charts natural variants controlling proteome diversity and forecasts their fitness effects

Affiliations

A genome-to-proteome atlas charts natural variants controlling proteome diversity and forecasts their fitness effects

Christopher M Jakobson et al. bioRxiv. .

Abstract

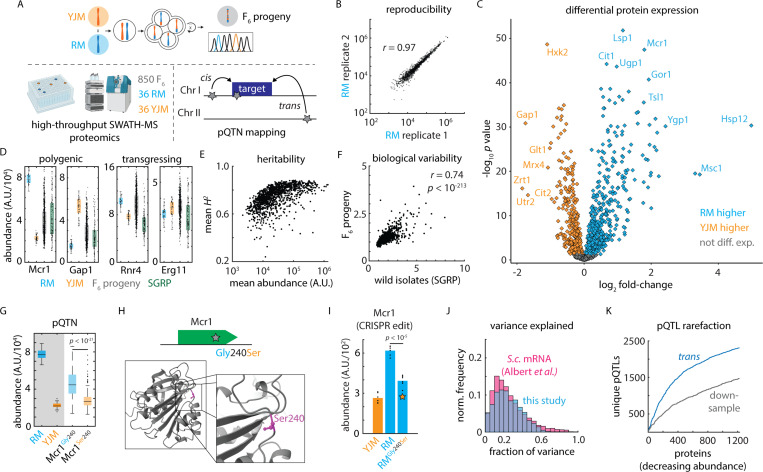
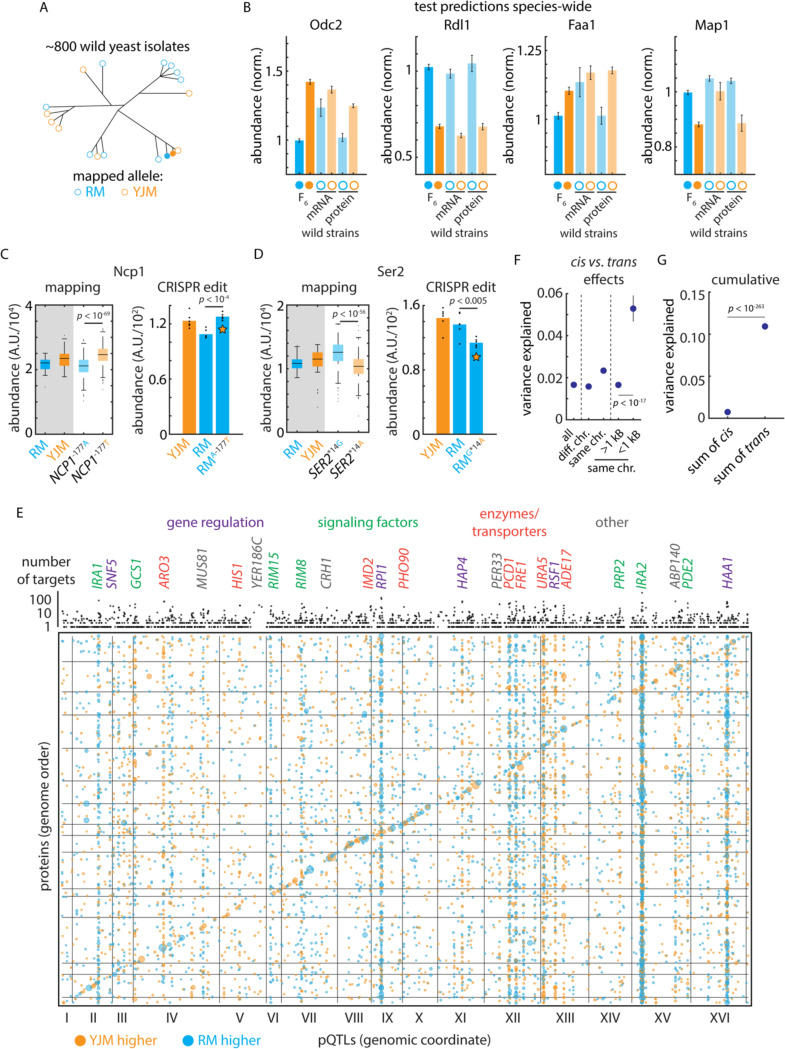
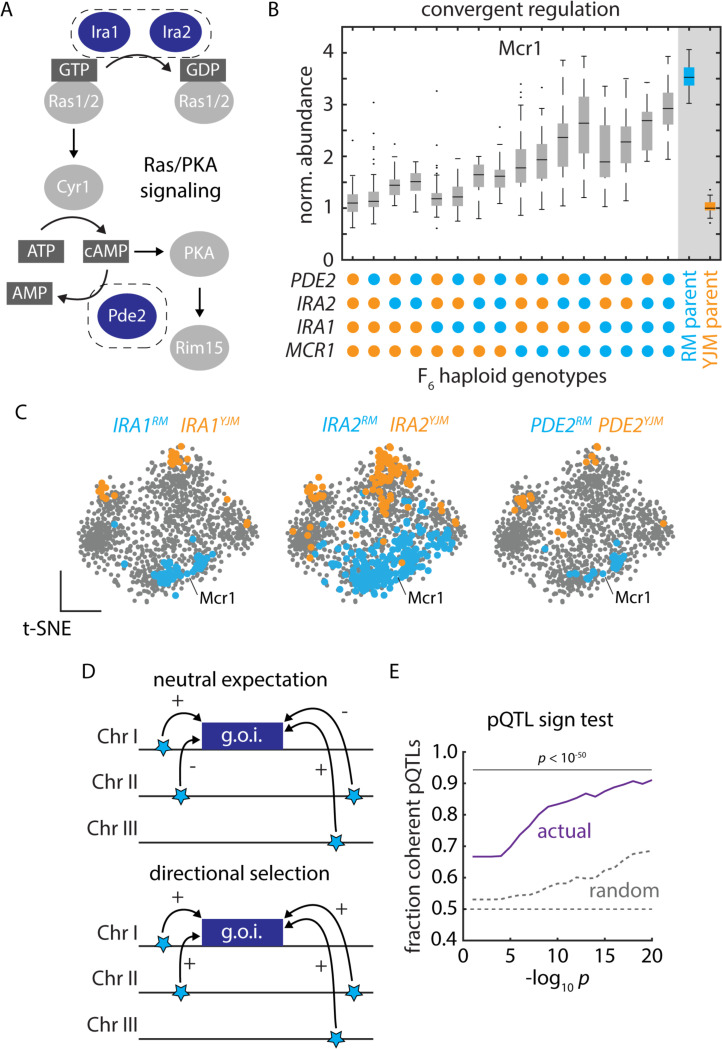
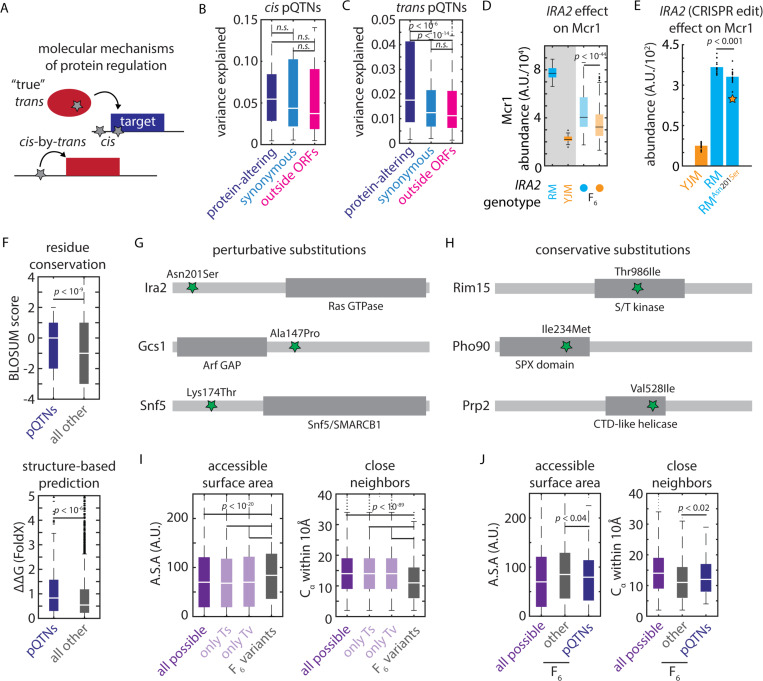
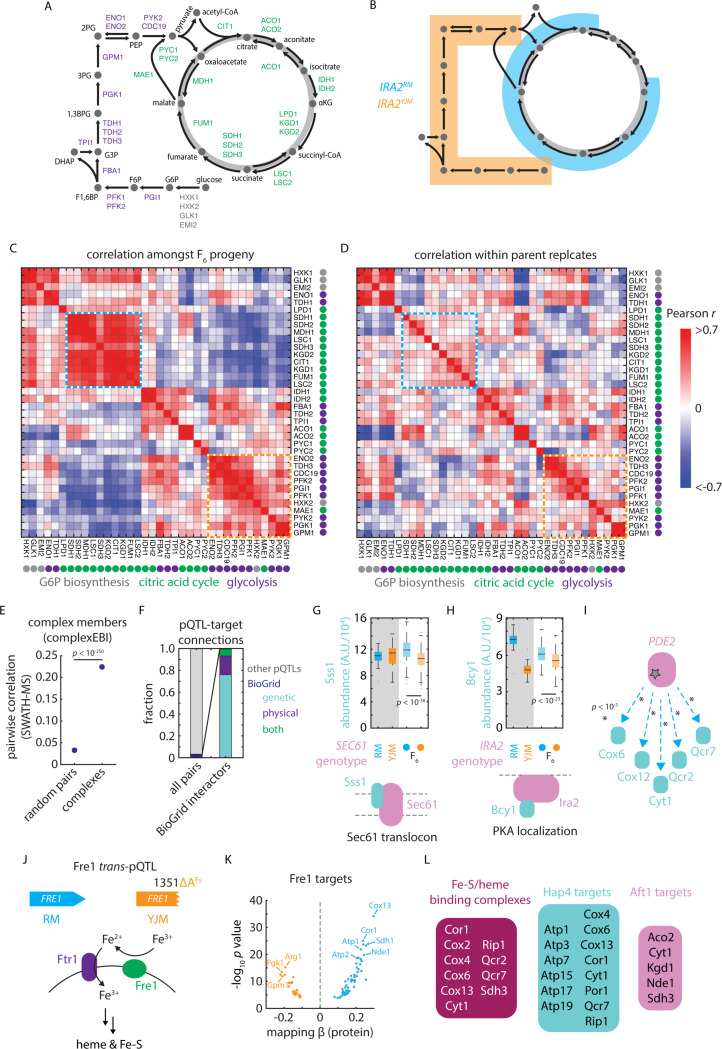
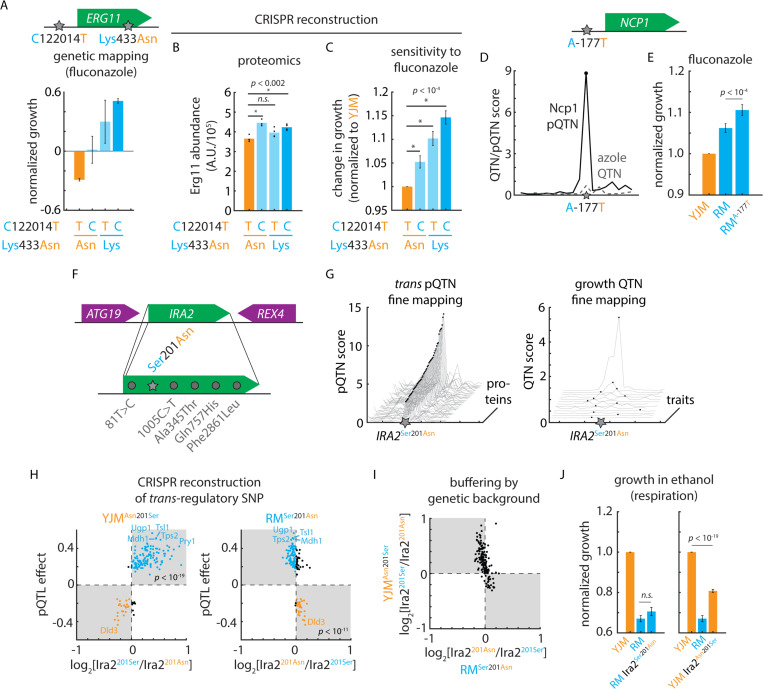
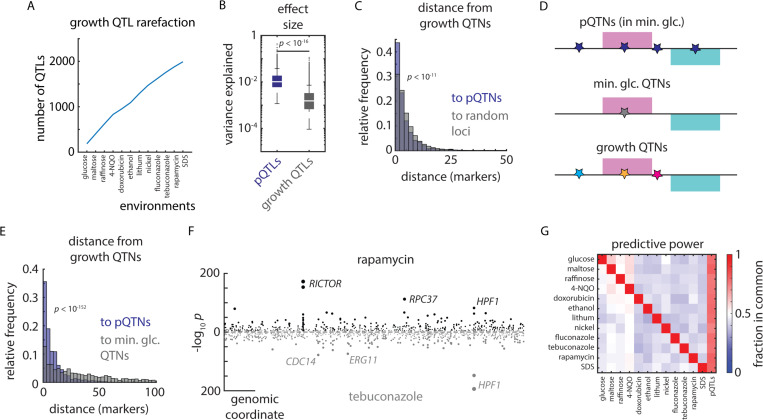
Despite abundant genomic and phenotypic data across individuals and environments, the functional impact of most mutations on phenotype remains unclear. Here, we bridge this gap by linking genome to proteome in 800 meiotic progeny from an intercross between two closely related Saccharomyces cerevisiae isolates adapted to distinct niches. Modest genetic distance between the parents generated remarkable proteomic diversity that was amplified in the progeny and captured by 6,476 genotype-protein associations, over 1,600 of which we resolved to single variants. Proteomic adaptation emerged through the combined action of numerous cis- and trans-regulatory mutations, a regulatory architecture that was conserved across the species. Notably, trans-regulatory variants often arose in proteins not traditionally associated with gene regulation, such as enzymes. Moreover, the proteomic consequences of mutations predicted fitness under various stresses. Our study demonstrates that the collective action of natural genetic variants drives dramatic proteome diversification, with molecular consequences that forecast phenotypic outcomes.

Keywords: adaptation; gene expression evolution; genotype-phenotype mapping; omnigenic model; proteomics; systems genetics; transgression; variant interpretation.


Conflict of interest statement

Declaration of Interests M. Ralser is founder and shareholder of Eliptica Ltd. The other authors declare no competing interests.

Figures

Figure 1.
Figure 1.. A variant-resolution genome-to-proteome map.
(A) Schematic of the mass spectrometry-based proteomics and genetic mapping approach. (B) Representative reproducibility across biological replicates of the vineyard (RM) isolate; Pearson’s r as indicated. (C) Volcano plot illustrating log2 fold-change in protein abundance (abscissa) and Benjamini-Hochberg-corrected t test p value (ordinate) between the vineyard (RM) and clinical (YJM) parents. n = 36 – 39. (D) Estimated abundance of Mcr1 and Gap1 (polygenic) and Rnr4 and Erg11 (transgressing) in RM parent (blue), YJM parent (orange), F6 progeny (grey), and SGRP wild strains (green). Boxes show median and upper and lower quartiles; whiskers show 1.5 times the interquartile range. (E) Mean broad-sense heritability of protein abundance (ordinate) as a function of estimated absolute protein abundance (abscissa) for all proteins measured in at least 80% of samples. (F) Normalized C.V. amongst the SGRP wild strains as compared to the mean C.V. in the parental isolates (ordinate) as a function of normalized C.V. amongst F6 progeny (abscissa). Pearson’s r as indicated. p value by t statistic. (G) Genetic mapping of a cis-acting SNP controlling the abundance of Mcr1. (H) Schematic and predicted AlphaFold2 protein structure of a cis-acting missense variant in Mcr1. (I) CRISPR reconstruction and mass spectrometry to validate the effect of the Mcr1Gly240Ser variant. n = 6; p value by two-sided t test. (J) Histogram of the fraction of total variance explained by the global (cis- and trans-acting) model in this study (blue) and in a highly powered eQTL mapping study in budding yeast (pink) . (K) Rarefaction plot of unique trans-acting pQTL associations (blue) discovered, ordered by decreasing estimated protein abundance. Also shown in grey is the same statistic for downsampled real data using only 50% of the F6 progeny. See also Figure S1.
Figure 2.
Figure 2.. Mutation-to-molecule atlas reveals protein-level regulation.
(A) Schematic of statistical replication strategy. (B) Left: Genetic mapping of cis-acting effects on Odc2 and Rdl1 protein abundance and replication of this signal in the orthogonal 1,002 Yeast Genomes transcriptomes and proteomes. Right: As left, but for Faa1 and Map1; these signals were evident only at the proteomic level in the replication data. Data shown are median and s.e.m. (C) Left: Genetic mapping of cis-acting effect on Ncp1 protein abundance. Right: CRISPR reconstruction and mass spectrometry to test the effect of the NCP1A-177T variant. n = 6; p value by two-sided t test. (D) As in (C), but for the SER2G*14A variant. (E) Bubble plot indicating the genomic position of all pQTLs. pQTL positions and encoding genes are arranged in genome order. Orange dots indicate clinical (YJM) allele increases protein level; blue indicates vineyard (RM) allele increases level. Dots are sized by genetic mapping p value. Indicated above is the number of target proteins controlled by each locus (aggregated by gene); highlighted are trans hotspots color-coded by gene function as indicated. (F) Variance explained by pQTLs with the indicated distance to the encoding gene for the target protein; p values by Student’s t test. Dots indicate mean and bars standard error. (G) Cumulative effect of cis- and trans-acting pQTLs across all proteins. Dots indicate mean and bars standard error; p value by Student’s t test. See also Figure S2.
Figure 3.
Figure 3.. Polygenic adaptation reflecting natural selection on protein abundance.
(A) Schematic of Ras/PKA signaling highlighting the Ira1, Ira2, and Pde2 proteins which harbored trans-acting hotspots. (B) Mcr1 protein levels as a function of F6 progeny genotypes at the PDE2, IRA2, IRA1, and MCR1 loci, as indicated. Boxes show median and upper and lower quartiles; whiskers show 1.5 times the interquartile range. (C) tSNE embeddings highlighting proteins upregulated by the vineyard (blue) and clinical (orange) alleles of IRA1, IRA2, and PDE2, as indicated. (D) Schematic illustrating the principle of the pQTL sign test. (E) Mean fraction of coherent trans-pQTLs across all mapped associations (ordinate) as a function of trans-pQTL p values (abscissa). Actual mapping data is shown in purple; random expectation across all trans-pQTLs, regardless of protein target, is shown in grey; p values by binomial test. See also Figure S3.
Figure 4.
Figure 4.. Biochemical constraints revealed by proteomic mapping.
(A) Schematic illustrating possible molecular mechanisms of cis and trans regulation (B) Effect size of protein-altering, synonymous, and regulatory cis-pQTNs, as indicated. Boxes show median and upper and lower quartiles; whiskers show 1.5 times the interquartile range. (C) Effect size of protein-altering, synonymous, and regulatory trans-pQTNs, as indicated. Boxes show median and upper and lower quartiles; whiskers show 1.5 times the interquartile range. p values by two-sided t test. (D) Predicted effect from genetic mapping of the IRA2Asn201Ser missense variant on Mcr1 levels. p value by F test. (E) CRISPR reconstruction and mass spectrometry to validate the effect of the IRA2Asn201Ser variant on Mcr1 levels. n = 15; p value by two-sided t test. (F) BLOSUM62 (top) and FoldX scores (bottom) for missense trans-pQTNs (blue) as compared to all other segregating missense variants (grey). Boxes show median and upper and lower quartiles; whiskers show 1.5 times the interquartile range. p values by Mann-Whitney U test. (G) Illustrative conservative pQTN substitutions and (H) perturbative pQTN substitutions with functional domains of the mutated proteins indicated. (I) Solvent-accessible surface area and number of Cα within 10Å for all possible missense SNPs (purple; also shown are subsets resulting from transitions and transversions) and all missense variants segregating in the F6 mapping panel (grey). (J) As in (I) for all possible missense SNPs (purple), missense pQTNs identified in this study (blue), and all other missense variants segregating in the F6 mapping panel (grey). p values by Mann-Whitney U test. See also Figure S4.
Figure 5.
Figure 5.. pQTLs reveal molecular and functional connectivity.
(A) Schematic of metabolites and enzymes of glycolysis (purple) and citric acid cycle (green). (B) As in (A), with metabolites highlighted in blue and orange if an enzyme catalyzing a reaction involving that metabolite is regulated by IRA2RM or IRA2YJM alleles, respectively. (C) Heatmap of pairwise SWATH-MS abundance correlations amongst enzymes shown in (A). Highlighted in blue and orange are blocks of coregulated enzymes regulated by the IRA2RM or IRA2YJM alleles, respectively. (D) As in (C), but for correlations within replicate measurements of parental isolates. (E) Pairwise SWATH-MS abundance correlations between complex members as compared to all possible pairs of measured proteins. p value by Mann-Whitney U test. Dots indicate mean and bars standard error. (F) Cumulative frequencies of pQTL-target connections reflecting (left) BioGRID interactions (blue) and all other pQTL-target pairs (grey) and (right), amongst BioGRID interactions, those annotated as genetic (blue), physical (purple) or both genetic and physical (green). (G) Sss1 abundance in vineyard and clinical parents and in F6 progeny with SEC61 genotypes as indicated. (H) Bcy1 abundance in vineyard and clinical parents and in F6 progeny with IRA2 genotypes as indicated. (I) Schematic of pQTL-target connections between PDE2 and various targets upregulated by vineyard allele, as indicated. p values by F test. (J) Schematic of the role of Fre1 in iron reduction and uptake at the plasma membrane . (K) Volcano plot illustrating predicted effects on abundance from genetic mapping (abscissa) and forward selection F test p value (ordinate) for the FRE1 trans-pQTL. (L) Downstream FRE1 pQTL targets that bind iron or heme or that are targets of Hap4 or Aft1, as indicated. See also Figure S5.
Figure 6.
Figure 6.. Cryptic fitness effects embedded in the mutation-to-protein map.
(A) Genetic mapping of the phenotypic effects of ERG11T1220124C and Erg11Asn433Lys in fluconazole. Shown is normalized growth of F6 progeny with genotypes as indicated. (B) Mass spectrometry of Erg11 protein levels in clinical (YJM) wild-type and CRISPR-edited YJM ERG11T1220124C, YJM Erg11Asn433Lys, and YJM ERG11T1220124C Erg11Asn433Lys mutant strains. n = 4; p values by Student’s t test. (C) Growth of clinical (YJM) wild-type and CRISPR-edited YJM ERG11T1220124C, YJM Erg11Asn433Lys, and YJM ERG11T1220124C Erg11Asn433Lys mutant strains in fluconazole. n = 96; p values by Student’s t test. (D) Fine-mapping of Ncp1 cis-pQTN as compared to fine-mapping of the azole-sensitivity QTL in the vicinity of NCP1. (E) Growth of clinical (YJM), vineyard (RM), and CRISPR-edited RM NCP1A-177T mutant strains in fluconazole. n = 96; p value by Student’s t test. (F) Diagram of IRA2 locus and segregating IRA2 mutations. (G) pQTN fine-mapping scores for the top 50 IRA2-target associations (left) and QTN fine-mapping scores for IRA2 growth QTL associations. (H) Predicted IRA2 pQTN effects from genetic mapping (this study; ordinate) as compared to measured effects of (left) CRISPR-edited YJM Ira2Asn210Ser and (right) RM Ira2Ser201Asn mutants. Mass spectrometry estimated abundances normalized to wild type in each case. (I) Measured effects of CRISPR-edited YJM Ira2Asn210Ser (ordinate) and RM Ira2Ser201Asn (abscissa) mutants. (J) Growth of clinical (YJM), vineyard (RM), and CRISPR-edited RM Ira2Ser201Asn mutant (left) and YJM Ira2Asn210Ser mutant (right) in ethanol. n = 96; p values by Student’s t test. See also Figure S6.
Figure 7.
Figure 7.. Proteomes identify causal variants underlying quantitative traits.
(A) Rarefaction plot of unique growth QTLs discovered as a function of additional environments mapped, as indicated. (B) Effect size (variance explained) of pQTLs (blue) and growth QTLs (grey). p value by Mann-Whitney U test. (C) Relative frequency histogram of the distance from al phenotypic QTNs to (blue) the nearest pQTN and (grey) randomly selected sets of markers of the same size. p value by Kolmogorov–Smirnov test between real and permuted data. (D) Schematic of pQTNs (blue), growth QTNs in minimal glucose medium (no stress; grey), and stress-responsive growth QTNs (various colors). (E) As in (C), but illustrating the distance from stress-responsive growth QTNs to (blue) the nearest pQTN and (grey) growth QTNs discovered in minimal glucose (no stress). p value by Kolmogorov–Smirnov test. (F) Example Miami plot of QTLs identified for growth in rapamycin (top) and tebuconazole (bottom). (G) Heatmap of the relative fraction of QTLs in common between environments (ordinate) and environments and pQTLs (abscissa), as indicated. See also Figure S7.

Similar articles

References

    1. Landrum M.J., Lee J.M., Riley G.R., Jang W., Rubinstein W.S., Church D.M., and Maglott D.R.(2014). ClinVar: public archive of relationships among sequence variation and human phenotype. Nucleic Acids Res. 42, D980–D985. - PMC - PubMed
    1. Gudmundsson S., Singer-Berk M., Watts N.A., Phu W., Goodrich J.K., Solomonson M., Genome Aggregation Database Consortium, Rehm H.L., MacArthur D.G., and O’Donnell-Luria A. (2022). Variant interpretation using population databases: Lessons from gnomAD. Hum. Mutat. 43, 1012–1030. - PMC - PubMed
    1. Leiding J.W., Vogel T.P., Santarlas V.G.J., Mhaskar R., Smith M.R., Carisey A., Vargas-Hernández A., Silva-Carmona M., Heeg M., Rensing-Ehl A., et al. (2023). Monogenic early-onset lymphoproliferation and autoimmunity: Natural history of STAT3 gain-of-function syndrome. J. Allergy Clin. Immunol. 151, 1081–1095. - PMC - PubMed
    1. GTEx Consortium (2017). Genetic effects on gene expression across human tissues. Nature 550, 204–213. - PMC - PubMed
    1. Wagner N., Çelik M.H., Hölzlwimmer F.R., Mertes C., Prokisch H., Yépez V.A., and Gagneur J. (2023). Aberrant splicing prediction across human tissues. Nat. Genet. 55, 861–870. - PubMed

Publication types

LinkOut - more resources