[Preprint]. 2024 Oct 21:2024.10.18.619082.
doi: 10.1101/2024.10.18.619082.

ACSS2 regulates ferroptosis in an E2F1-dependent manner in breast cancer brain metastatic cells

Affiliations

ACSS2 regulates ferroptosis in an E2F1-dependent manner in breast cancer brain metastatic cells

Emily M Esquea et al. bioRxiv. .

Abstract

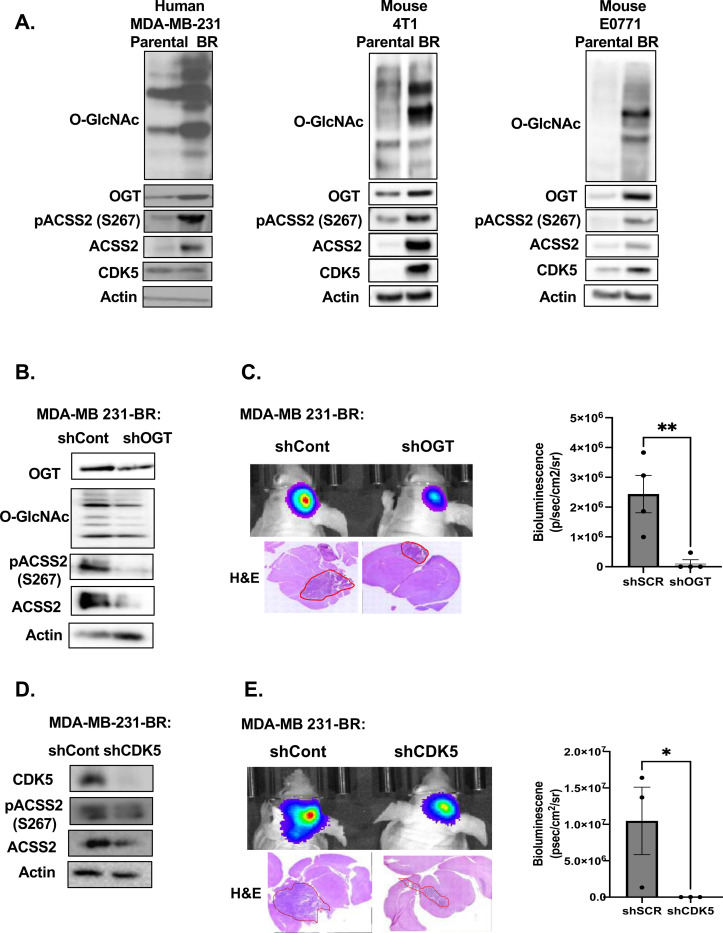
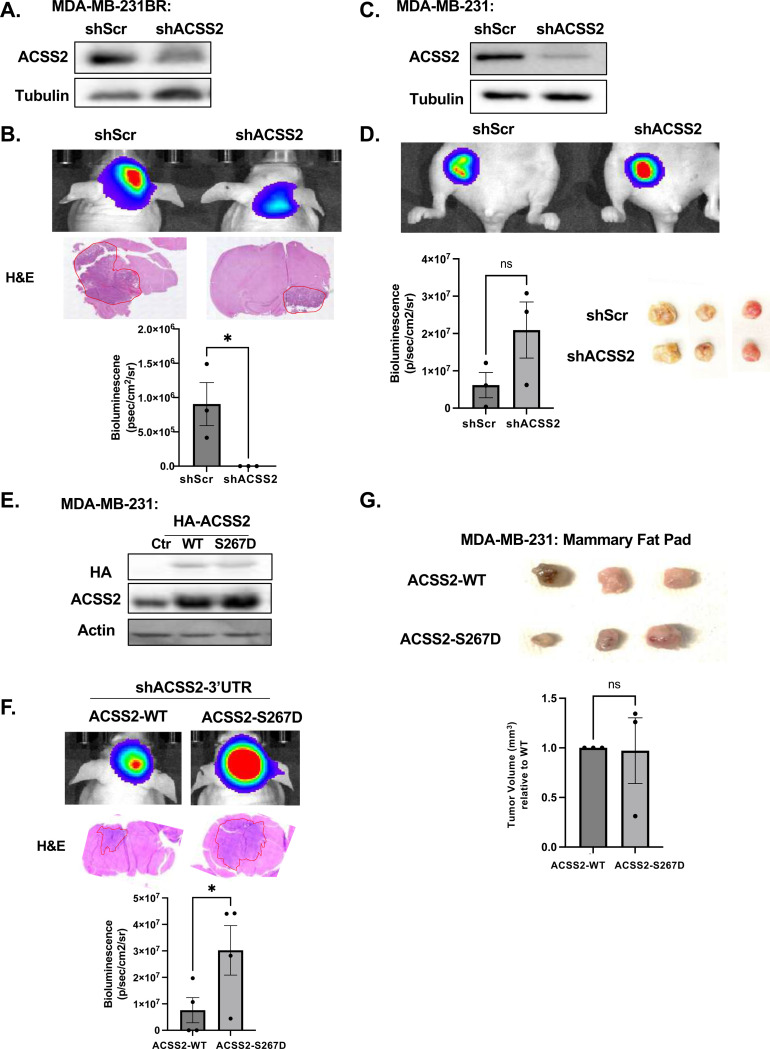
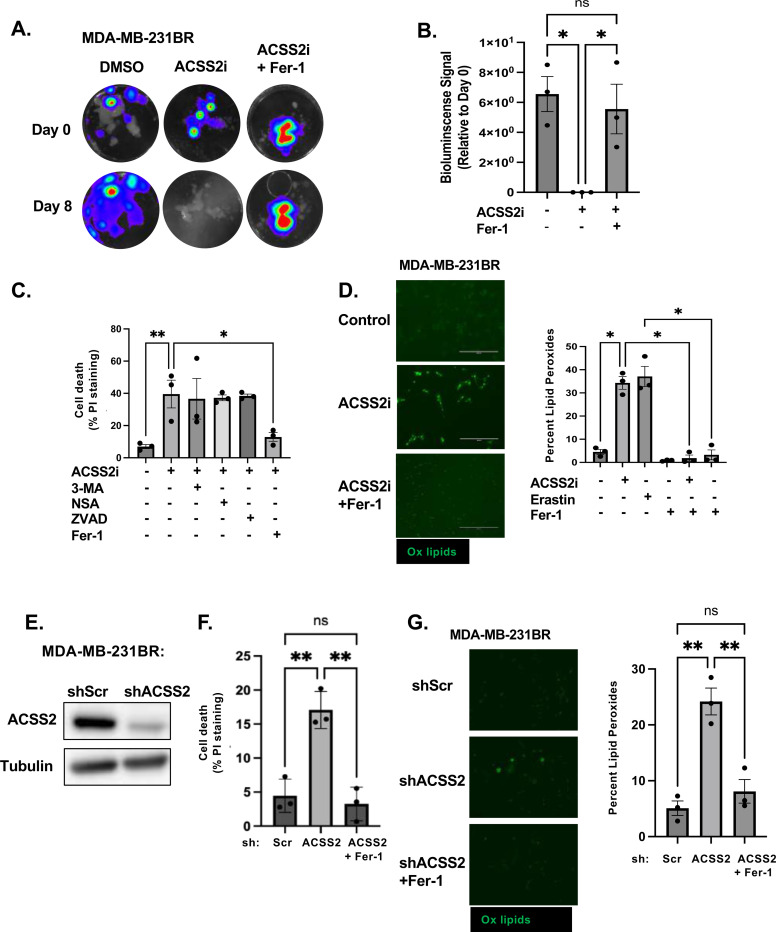
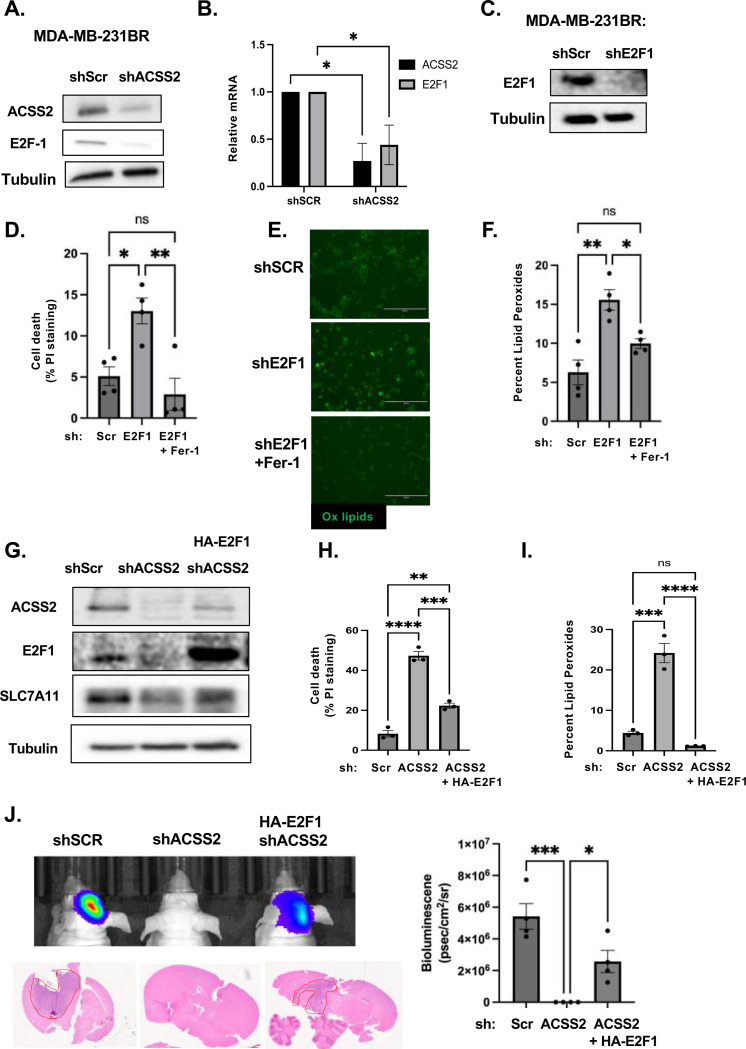
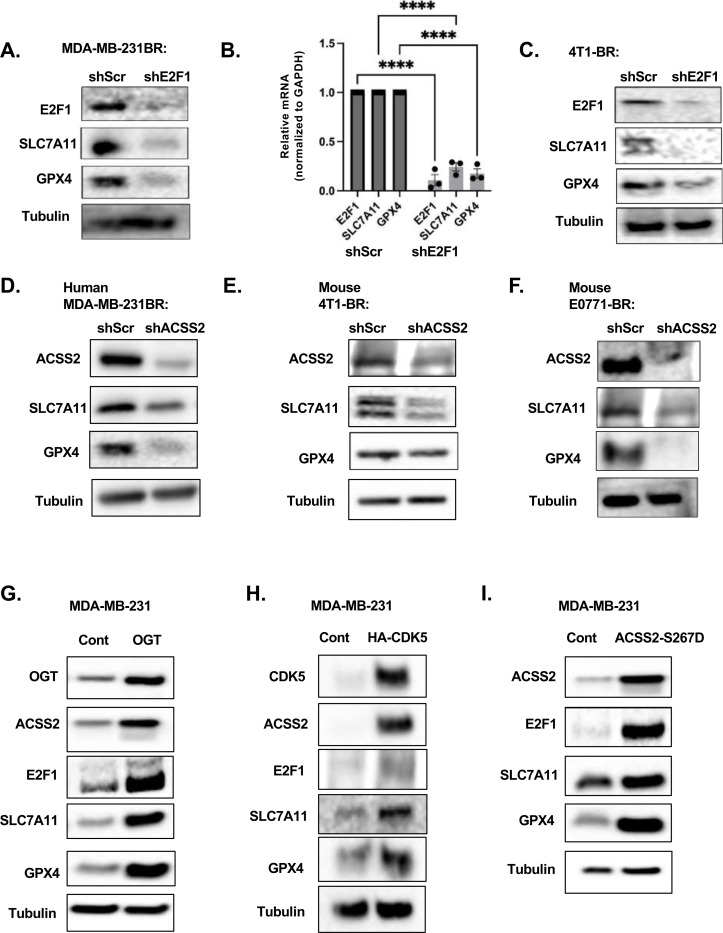
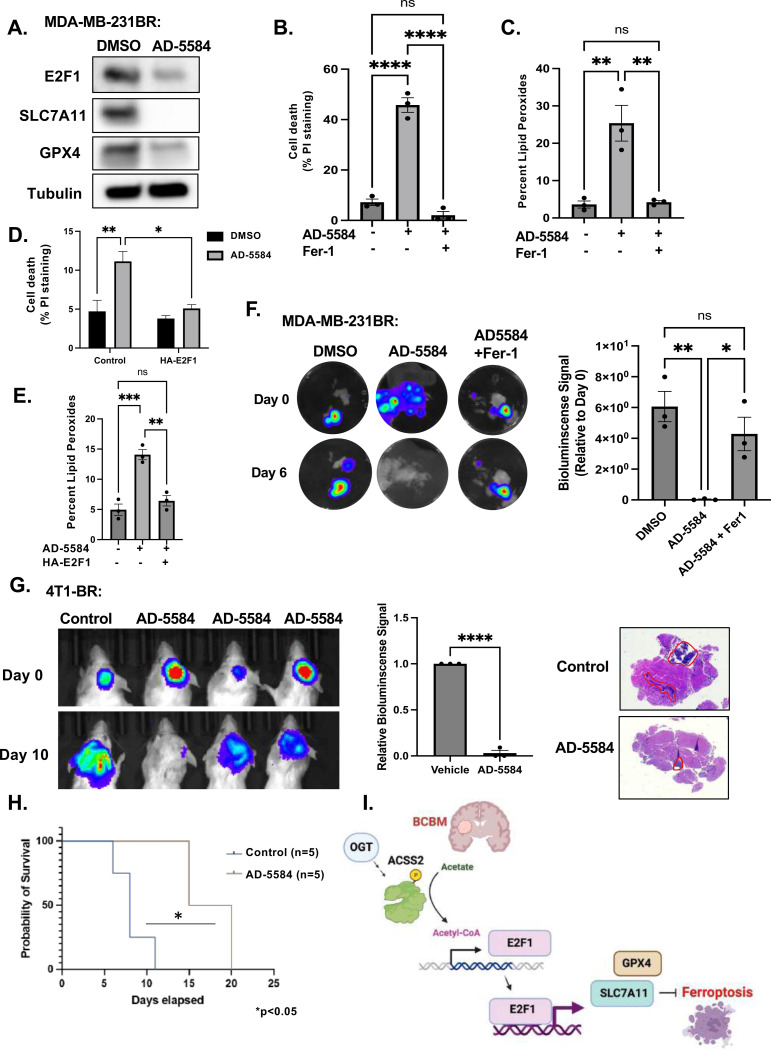
Brain metastasis diagnosis in breast cancer patients is considered an end-stage event. The median survival after diagnosis is measured in months, thus there is an urgent need to develop novel treatment strategies. Breast cancers that metastasize to the brain must adapt to the unique brain environment and are highly dependent on acetate metabolism for growth and survival. However, the signaling pathways that regulate survival in breast cancer brain metastatic (BCBM) tumors are not known. Primary brain tumor cells can convert acetate to acetyl-CoA via phosphorylation of acetyl-CoA synthetase 2 (ACSS2) by the cyclin-dependent kinase-5 (CDK5) regulated by the nutrient sensor O-GlcNAc transferase (OGT). Here, we show that breast cancer cells selected to metastasize to the brain contain increased levels of O-GlcNAc, OGT and ACSS2-Ser267 phosphorylation compared to parental breast cancer cells. Moreover, OGT and CDK5 are required for breast cancer cell growth in the brain parenchyma in vivo. Importantly, ACSS2 and ACSS2-S267D phospho-mimetic mutant are critical for in vivo breast cancer growth in the brain but not in the mammary fat pad. Mechanistically, we show that ACSS2 regulates BCBM cell survival by suppressing ferroptosis via regulation of E2F1-mediated expression of anti-ferroptotic proteins SLC7A11 and GPX4. Lastly, we show treatment with a novel brain-permeable small molecule ACSS2 inhibitor induced ferroptosis and reduced BCBM growth ex vivo and in vivo. These results suggest a crucial role for ACSS2 in protecting from ferroptosis in breast cancer brain metastatic cells and suggests that breast cancer brain metastatic cells may be susceptible to ferroptotic inducers.

Keywords: ACSS2; CDK5; E2F1; GPX4; O-GlcNAc; OGT; SLC7A11; acetate; acetyl-CoA; brain metastasis; breast cancer; cancer; ferroptosis; hexosamine; lipids; metabolism.


Conflict of interest statement

Competing Interests. A.D., L.C. and M.J.R. are inventors on patents involving ACSS2 inhibitor AD-5584.

Figures

Figure 1.
Figure 1.. OGT/CDK5/ACSS2 axis is elevated in TNBC BCBM and OGT/CDK5 are required for BCBM cell growth in vivo.
(A) Cell lysate from parental and brain trophic MDA-MB-231, 4T1 and E0771 cells were collected for immunoblot analysis with the indicated antibodies. (B) Cell lysates from MDA-MB-231Br cells expressing shRNA against Scramble or OGT were collected for immunoblot analysis with the indicated antibodies. (C) Representative images of bioluminescent (top) detection of tumors from mice injected with shSCR and shOGT MDA-MB-231BR cells 14 days post-injection. Representative images of H&E analysis (bottom) on coronal sections from mice harboring shRNA against Scramble or OGT tumors at Day 14. Data are quantified and presented as average Bioluminescence signal from mice injected with MDA-MB-231BR cells expressing shRNA against Scramble (n=3) or OGT mice (n=3) (bottom). Student’s t-test reported as mean ± SEM; **p<0.001. (D) Cell lysates from MDA-MB-231Br cells with shRNA against Scramble or CDK5 were collected for immunoblot analysis with the indicated antibodies. (E) Representative images of bioluminescent (top) detection of tumors from mice injected with shScramble and shCDK5 MDA-MB-231BR cells 14 days post-injection. Representative images of H&E analysis (bottom) on coronal sections from mice harboring shRNA against Scramble or CDK5 tumors at Day 14. Data are quantified and presented as average Bioluminescence signal from mice injected with MDA-MB-231BR cells expressing shSCR (n=3) or shCDK5 mice (n=3) (bottom). Student’s t-test reported as mean ± SEM; *p<0.05.
Figure 2.
Figure 2.. ACSS2 and pSer267-ACSS2 provide a specific growth advantage for tumor growth in the brain but not in the mammary fat pad.
(A) Cell lysates from MDA-MB-231BR cells stably expressing shRNA against Scramble or ACSS2 were collected for immunoblot analysis with the indicated antibodies. (B) Representative images of bioluminescent (top) detection of tumors from mice injected with shSCR and shACSS2 MDA-MB-231BR cells 14 days post-injection. Representative images of H&E analysis (bottom) on coronal sections from mice harboring shRNA against Scramble or ACSS2 tumors at Day 14. Bioluminescence signal from mice injected with MDA-MB-231BR expressing shRNA against Scramble (n=3) or ACSS2 mice (n=3) (bottom). Student’s t-test reported as mean ± SEM; *p<0.05. (C) Cell lysates from MDA-MB-231 cells stably expressing shRNA against Scramble or ACSS2 shRNA were collected for immunoblot analysis with the indicated antibodies. (D) Representative images of bioluminescent (top) detection of mammary fat tumors from mice injected with shSCR and shACSS2 MDA-MB-231 cells 21 days post-injection. Representative images of fat pad tumors removed (bottom) from mice harboring shRNA against Scramble or ACSS2 tumors at Day 21. Bioluminescence signal from mice injected with MDA-MB-231 expressing shRNA against Scramble (n=3) or ACSS2 mice (n=3) (bottom). Student’s t-test reported as mean ± SEM; n.s.. (E) Cell lysates from MDA-MB-231 cells stably expressing shRNA against endogenous ACSS2, overexpressing HA-tagged wildtype (WT) or HA-tagged phosphomimetic mutant (S267D) ACSS2 were collected for immunoblot analysis with the indicated antibodies. (F) Representative images of bioluminescent (top) detection in MDA-MB-231 cells with shRNA against endogenous ACSS2, overexpressing HA-tagged wildtype (WT) or HA-tagged phosphomimetic mutant (S267D). Representative images of H&E analysis (bottom) on coronal sections from mice harboring shRNA against endogenous ACSS2, overexpressing HA-tagged wildtype (WT) or HA-tagged phosphomimetic mutant (S267D) ACSS2 tumors at Day 14. Bioluminescence signal from mice injected with MDA-MB-231 expressing shRNA against Scramble, overexpressing HA-tagged wildtype (WT) (n=4) or HA-tagged phosphomimetic mutant (S267D) ACSS2 mice (n=4) (bottom). Student’s t-test reported as mean ± SEM; *p<0.05. (G) Representative images of fat pad tumors removed (bottom) from mice harboring shRNA against endogenous ACSS2, overexpressing HA-tagged wildtype (WT) or HA-tagged phosphomimetic mutant (S267D) ACSS2 tumors at Day 21. Student’s t-test reported as mean ± SEM; n.s..
Figure 3.
Figure 3.. ACSS2 regulates breast cancer brain metastatic cell survival via Ferroptosis suppression.
(A) Representative images depicting tumor growth in organotypic brain slices derived from mice intracranially injected with MDA-MB-231BR-luc cells detected via bioluminescence. Brain slices containing tumors are treated with Control (DMSO), ACSS2 inhibitor (ACSS2i) 50 μM or ACSS2i and Ferrostatin-1 (Fer-1) 5 μM for indicated days (top). (B) Quantification of tumor Bioluminescence at indicated day (Control: DMSO n=3, ACSS2i n=3, ACSS2i +Fer-1 n=3) One-way ANOVA with Tukey’s multiple comparisons test reported as mean ± SEM *p-value < 0.05. (C) Quantification of propidium iodine staining flow cytometry of MDA-MB-231BR cells treated with ACSS2 inhibitor (ACSS2i) (n=3), ACSS2i + 3-Methyladenine (3-MA) (n=3), ACSS2i + Necrosulfonamide (NSA) (n=3), ACSS2i + Caspase Inhibitor Z-VAD-FMK (ZVAD) (n=3), or ACSS2i + Ferrostatin-1 (Fer-1). Data reported as One-way ANOVA with Tukey’s multiple comparisons test reported as mean ± SEM *p-value < 0.05, **p<0.01. (D) Representative images of MDA-MB-231BR cells treated with Control (DMSO), ACSS2i, or ACSS2i + Fer-1 and stained with Bopidy C11 (image magnification 20x, scale bar: 200 μM) (right). Quantification of lipid peroxides with Bopidy C11 and flow cytometry of MDA-MB-231BR cells treated with ACSS2i, Erastin, Fer-1, ACSS2i + Fer1, Erastin + Fer-1. Data reported as One-way ANOVA with Tukey’s multiple comparisons test reported as mean ± SEM *p-value < 0.05. (E) Cell lysates from MDA-MB-231BR cells stably expressing shRNA against Scramble or ACSS2 were collected for immunoblot analysis with the indicated antibodies. (F) Quantification of propidium iodine staining flow cytometry of MDA-MB-231BR cells expressing shRNA against Scramble, ACSS2, and shRNA against ACSS2 and Fer-1. Data reported as One-way ANOVA with Tukey’s multiple comparisons test reported as mean ± SEM **p-value < 0.01. (G) Representative images of MDA-MB-231BR cells stably expressing shRNA against Scramble or ACSS2 and treated with + Fer-1 and stained with Bopidy C11 (image magnification 20x, scale bar: 200 μM) (right). Quantification of lipid peroxides with Bopidy C11 and flow cytometry of MDA-MB-231BR cells expressing shRNA against Scramble, ACSS2, and shRNA against ACSS2 and Fer-1 (left). Data reported as One-way ANOVA with Tukey’s multiple comparisons test reported as mean ± SEM **p-value < 0.01.
Figure 4.
Figure 4.. ACSS2 regulates Ferroptosis in an E2F1-dependent regulation of SLC7A11.
(A) Cell lysates from MDA-MB-231BR cells stably expressing shRNA against Scramble or ACSS2 were collected for immunoblot analysis with the indicated antibodies. (B) Total RNA was collected from MDA-MB-231BR cells stably expressing shRNA against Scramble or ACSS2. Quantification of qRT-PCR performed on RNA extracts analyzing ACSS2 and E2F1 gene expression normalized to PPIA. Two-way ANOVA reported as mean ± SEM.* p-value < 0.05. (C) Cell lysates from MDA-MB-231BR cells stably expressing shRNA against Scramble or E2F1 were collected for immunoblot analysis with the indicated antibodies. (D) Quantification of propidium iodine staining flow cytometry of MDA-MB-231BR cells expressing shRNA against Scramble or E2F1, treated with and without Fer-1. Data reported as One-way ANOVA with Tukey’s multiple comparisons test reported as mean ± SEM *p-value < 0.05. (E) Representative images of MDA-MB-231BR cells expressing shRNA against Scramble or E2F1, and Fer-1 Bopidy C11 (image magnification 20x, scale bar: 200 μM) (left). (F) Quantification of lipid peroxides with Bopidy C11 and flow cytometry (right) of MDA-MB-231BR cells expressing shRNA against Scramble or shRNA against E2F1 and Fer-1. Data reported as One-way ANOVA with Tukey’s multiple comparisons test reported as mean ± SEM *p-value < 0.05. (G) Cell lysates from MDA-MB-231BR cells stably expressing shRNA against Scramble or shRNA against ACSS2 and overpression of HA-Tagged E2F1 were collected for immunoblot analysis with the indicated antibodies. (H) Quantification of propidium iodine staining flow cytometry of MDA-MB-231BR cells expressing shRNA against Scramble, shRNA against ACSS2 and HA-tagged E2F1. Data reported as One-way ANOVA with Tukey’s multiple comparisons test reported as mean ± SEM **p-value < 0.01, ***p<0.001, ****p<0.0001. (I) Quantification of lipid peroxides with Bopidy C11 and flow cytometry of MDA-MB-231BR cells expressing shRNA against Scramble, ACSS2, or shRNA against ACSS2 and HA-Tagged E2F1 RNA. Data reported as One-way ANOVA with Tukey’s multiple comparisons test reported as mean ± SEM ***p-value < 0.001, ****p<0.0001. (J) Representative images of bioluminescent (top) detection of tumors from mice injected with shSCR and shACSS2, shACSS2 HA-E2F1 MDA-MB-231BR cells 14 days post-injection. Representative images of H&E analysis (bottom) on coronal sections from mice as above. Bioluminescence signal was quantified from mice injected with MDA-MB-231BR cells stably expressing shSCR (n=4) and shACSS2 (n=4), shACSS2 HA-E2F1 (n=4) (right). Student’s t-test reported as mean ± SEM; *p<0.05.
Figure 5.
Figure 5.. OGT/CDK5/ACSS2 Signaling axis regulates ferroptosis regulators.
(A) Cell lysates from MDA-MB-231BR cells stably expressing shRNA against Scramble or E2F1 were collected for immunoblot analysis with the indicated antibodies. (B) Total RNA was collected from MDA-MB-231BR cells stably expressing shRNA against Scramble or E2F1. Quantification of qRT-PCR performed on RNA extracts analyzing E2F1, SLC7A11, and GPX4 gene expression normalized to GAPDH. Two-way ANOVA reported as mean ± SEM.* p-value < 0.05. (C) Cell lysates from 4T1BR cells stably expressing shRNA against Scramble or E2F1 were collected for immunoblot analysis with the indicated antibodies. (D) Cell lysates from MDA-MB-231BR cells stably expressing shRNA against Scramble or ACSS2 were collected for immunoblot analysis with the indicated antibodies. (E) Cell lysates from 4T1-BR cells stably expressing shRNA against Scramble or ACSS2 were collected for immunoblot analysis with the indicated antibodies. (F) Cell lysates from E0771-BR cells stably expressing shRNA against Scramble or ACSS2 were collected for immunoblot analysis with the indicated antibodies. (G) Cell lysates from MDA-MB-231 cells stably overexpressing Control or OGT were collected for immunoblot analysis with the indicated antibodies. (H) Cell lysates from MDA-MB-231 cells stably overexpressing Control or CDK5 were collected for immunoblot analysis with the indicated antibodies. (I) Cell lysates from MDA-MB-231 cells stably overexpressing Control or HA-ACSS2-S267D were collected for immunoblot analysis with the indicated antibodies.
Figure 6.
Figure 6.. Novel Brain Permeable ACSS2 inhibitor induces Ferroptosis in an E2F1-dependent pathway.
(A) Cell lysates from MDA-MB-231BR cells treated with control (DMSO) or ACSS2 inhibitor AD-5584 (100 μM) for 48 hrs were collected for immunoblot analysis with the indicated antibodies. (B) Quantification of propidium iodine staining flow cytometry of MDA-MB-231BR cells treated with DMSO, AD-5584, or AD-5584 + Fer1. Data reported as One-way ANOVA with Tukey’s multiple comparisons test reported as mean ± SEM *p-value < 0.05, **p<0.01. (C) Quantification of lipid peroxides with Bopidy C11 and flow cytometry of MDA-MB-231BR (right) cells treated with DMSO, AD-5584, or AD-5584 + Fer1. Data reported as One-way ANOVA with Tukey’s multiple comparisons test reported as mean ± SEM **p-value < 0.01. (D) Quantification of propidium iodine staining flow cytometry of MDA-MB-231BR cells overexpressing control or E2F1 treated with DMSO, AD-5584, or AD-5584. Data reported as One-way ANOVA with Tukey’s multiple comparisons test reported as mean ± SEM *p-value < 0.05, **p<0.01 (E) Quantification of lipid peroxides with Bopidy C11 and flow cytometry of MDA-MB-231BR cells overexpressing E2F1 treated with DMSO, AD-5584, or AD-5584. Data reported as One-way ANOVA with Tukey’s multiple comparisons test reported as mean ± SEM **p-value < 0.01, ***p-value < 0.001. (F) Representative images depicting tumor growth in organotypic brain slices derived from mice intracranially injected with MDA-MB-231Br-luc cells detected via bioluminescence. Brain slices containing tumors are treated with Control (DMSO), AD-5584 or AD-5584 and Ferrostatin-1 (Fer-1) for indicated days (left). Quantification of tumor Bioluminescence at indicated day (right) (Control: DMSO n=3, AD-5584 n=3, AD-5584 +Fer-1 n=3) One-way ANOVA with Tukey’s multiple comparisons test reported as mean ± SEM *p-value < 0.05, **p<0.01. (G) Representative images of bioluminescent detection of tumors from Balb/C mice injected with luciferase-tagged 4T1BR cells at Day 0 (prior to drug treatment) and at 10 days post-drug treatment. Data are quantified and presented as average Relative Bioluminescence signal from mice injected with 4T1BR cells treated with Vehicle (n=3) or AD-5584 treated mice (n=3) (right). Student’s t-test reported as mean ± SEM; *p<0.05. Representative images of brain sections stained for H&E 10-days-post treatment. (H) Kaplan-Meyer survival analysis quantifying survival of mice injected with 4T1BR cells and treated with vehicle (n=5) or AD-5584 (n=5), *p<0.05. (I) Working model schematic depicting OGT regulates ACSS2 via CDK5 phosphorylation at Serine-267 residue. BCBM cells upregulate ACSS2 to convert acetate to acetyl-CoA. Acetyl-CoA promotes the transcription of E2F1, leading to the transcription of anti-ferroptotic E2F1 target genes, SLC7A11 and GPX4. Expression of SLC7A11and GPX4 protects BCBM cells from ferroptosis.

References

    1. Watase C., et al. , Breast Cancer Brain Metastasis-Overview of Disease State, Treatment Options and Future Perspectives. Cancers (Basel), 2021. 13(5). - PMC - PubMed
    1. Schroeder T., et al. , Mapping distribution of brain metastases: does the primary tumor matter? J Neurooncol, 2020. 147(1): p. 229–235. - PMC - PubMed
    1. Sokoloff L., Localization of functional activity in the central nervous system by measurement of glucose utilization with radioactive deoxyglucose. J Cereb Blood Flow Metab, 1981. 1(1): p. 7–36. - PubMed
    1. Edmond J., et al. , Capacity for substrate utilization in oxidative metabolism by neurons, astrocytes, and oligodendrocytes from developing brain in primary culture. J Neurosci Res, 1987. 18(4): p. 551–61. - PubMed
    1. Dienel G.A., Brain Glucose Metabolism: Integration of Energetics with Function. Physiol Rev, 2019. 99(1): p. 949–1045. - PubMed

Publication types

LinkOut - more resources