[Preprint]. 2024 Oct 22:2024.10.21.619538.
doi: 10.1101/2024.10.21.619538.

Myeloid-derived β-hexosaminidase is essential for neuronal health and lysosome function: implications for Sandhoff disease

Affiliations

Myeloid-derived β-hexosaminidase is essential for neuronal health and lysosome function: implications for Sandhoff disease

Kate I Tsourmas et al. bioRxiv. .

Abstract

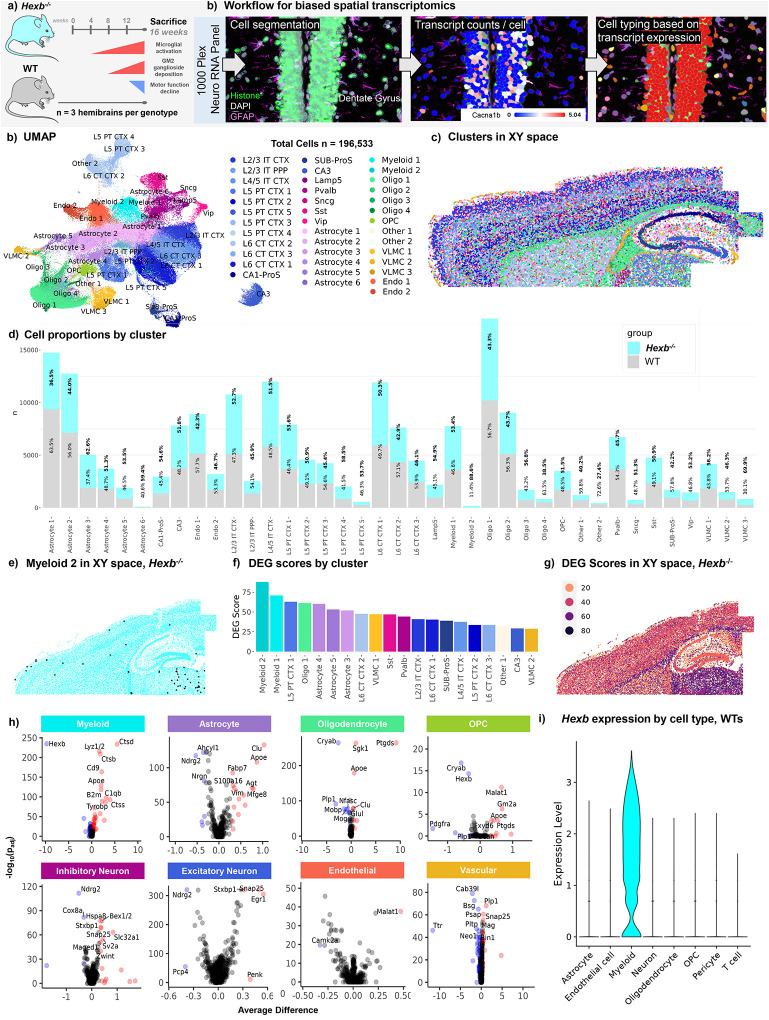
Lysosomal storage disorders (LSDs) are a large disease class involving lysosomal dysfunction, often resulting in neurodegeneration. Sandhoff disease (SD) is an LSD caused by a deficiency in the β subunit of the β-hexosaminidase enzyme (Hexb). Although Hexb expression in the brain is specific to microglia, SD primarily affects neurons. To understand how a microglial gene is involved in maintaining neuronal homeostasis, we demonstrated that β-hexosaminidase is secreted by microglia and integrated into the neuronal lysosomal compartment. To assess therapeutic relevance, we treated SD mice with bone marrow transplant and colony stimulating factor 1 receptor inhibition, which broadly replaced Hexb -/- microglia with Hexb-sufficient cells. This intervention reversed apoptotic gene signatures, improved behavior, restored enzymatic activity and Hexb expression, ameliorated substrate accumulation, and normalized neuronal lysosomal phenotypes. These results underscore the critical role of myeloid-derived β-hexosaminidase in neuronal lysosomal function and establish microglial replacement as a potential LSD therapy.


Conflict of interest statement

DECLARATION OF INTERESTS Kim N. Green is on the scientific advisory board of Ashvattha Therapeutics, Inc. All other authors declare no conflict of interest.

Figures

Fig. 1:
Fig. 1:. Spatial transcriptomic analysis of the SD mouse brain identifies disease-associated gene expression signatures.
(a) Timeline of symptom progression in Hexb−/− Sandhoff disease model mice up to point of sacrifice at 16 weeks (n=3/genotype, Hexb−/− and wildtype (WT) control). Microglial/myeloid activation begins at ~4 weeks, accumulation of GM2 ganglioside glycolipid can be detected ~8 weeks, and motor deterioration begins ~12 weeks. (b) Experimental workflow for targeted 1000-plex single-cell spatial transcriptomics. Fields of view (FOVs) were selected in cortex, corpus callosum, hippocampus, and upper regions of caudate and thalamus of each sagittal section, then imaged with DNA, rRNA, Histone, and GFAP markers for cell segmentation. Transcript counts for each gene were acquired per cell. (c) Uniform Manifold Approximation and Projection (UMAP) of 196,533 cells across 6 brains. Clustering at 1.0 resolution yielded 39 clusters, which were annotated with a combination of automated and manual approaches with reference to Allen Brain Atlas singe-cell RNA-seq cell types, gene expression, and anatomical location in space. (c) 39 clusters plotted in XY space. (d) Bar graph of proportions of cell counts by subcluster per genotype. (e) Myeloid 2 subcluster (black) overlaid above representative Hexb−/− brain plotted in XY space. (f) Descending bar graph of top 20 subclusters with highest differentially expressed gene (DEG) scores. Following differential gene expression analysis, DEG score was calculated per subcluster by summing the absolute value of the log2 fold change values for all DEGs between Hexb−/− and WT control with a padj value below 0.05. (g) Projection of subclusters colored by DEG score in XY space in representative Hexb−/− brain. (h) Volcano plots of DEGs between Hexb−/− and WT control for each broad cell type. (i) Violin plot of Hexb transcript counts in cell types demonstrating myeloid-specific expression.
Fig. 2:
Fig. 2:. Microglial replacement in SD leads to functional rescue and normalization of microglial morphology.
(a) Schematic of treatment paradigm. WT and Hexb−/− mice were split into 3 groups: untreated control, bone marrow transplant (BMT), and bone marrow transplant plus colony stimulating factor 1 inhibitor treatment (BMT + CSF1Ri). Mice underwent functional testing with the accelerating Rotarod task and were sacrificed at 16 weeks. (b) Categorical scatter plot of change in weight in grams in WT, BMT-treated WT, BMT + CSF1Ri-treated WT, Hexb−/−, BMT-treated Hexb−/−, and BMT + CSF1Ri-treated Hexb−/− mice between week of sacrifice and week 13 (week 16 weight – week 13 weight). (c) Line graph of average latency-to-fall time in seconds in WT control, Hexb−/− control, Hexb−/− BMT, and Hexb−/− BMT + CSF1Ri groups on Rotarod task per week from 11 to 16 weeks of age. From week 13, groups compared by repeated measures ANOVA with Tukey’s post-hoc testing. Symbols indicate significant differences between Hexb−/− control and WT control (*), Hexb−/− BMT-treated and WT BMT-treated (&), Hexb−/− BMT-treated and Hexb−/− control (@), and Hexb−/− BMT + CSF1RI and Hexb−/− control (#) mice. (d) Scattered bar plot of final week (week 16) Rotarod latency-to-fall time in WT, BMT-treated WT, BMT + CSF1Ri-treated WT, Hexb−/−, BMT-treated Hexb−/−, and BMT + CSF1Ri-treated Hexb−/− mice. (e) Scatterplot with line of best fit of final week (week 16) Rotarod latency-to-fall time (x axis) versus total green fluorescent protein (GFP, green)+ staining volume in upper corpus callosum (y axis) in BMT + CSF1Ri-treated Hexb−/− mice. Demonstrates significant (p = 0.0456) positive correlation between corpus callosum GFP+ volume and final Rotarod score. (f) Representative 10x whole brain images of sagittal sections from Hexb−/− BMT and Hexb−/− BMT + CSF1Ri mice immunolabeled for GFP (green), demonstrating CNS infiltration of CAG-EGFP donor-derived cells. CTX, cortex; MB, midbrain; CB, cerebellum; MB, midbrain; TH, thalamus. (g) Representative confocal images of cortex in Hexb−/− BMT- treated and Hexb−/− BMT + CSF1Ri-treated mice immunolabeled for GFP (green) and myeloid cell marker IBA1 (red), showing colocalization (yellow). (h) Bar graph of quantification of percentage of IBA1+ cells with colocalized GFP+ per FOV in cortex images from BMT-treated WT, BMT + CSF1Ri-treated WT, BMT-treated Hexb−/−, and BMT + CSF1Ri-treated Hexb−/− mice, indicating ratio of myeloid cells with bone marrow-derived myeloid cell (BMDM) identity. Two-way ANOVA with Sidak’s post-hoc test. (i) Representative confocal images of cortex from WT, BMT-treated WT, BMT + CSF1Ri-treated WT, Hexb−/−, BMT-treated Hexb−/−, and BMT + CSF1Ri-treated Hexb−/− mice immunolabeled for GFP (green) and myeloid cell marker IBA1 (red). (j-m) Bar graphs of quantification of cortex images from WT, BMT-treated WT, BMT + CSF1Ri-treated WT, Hexb−/−, BMT-treated Hexb−/−, and BMT + CSF1Ri-treated Hexb−/− mice of (j) number of IBA1+ cells per FOV, (k) mean area covered by filaments of individual IBA1+ cells in FOV, (l) mean number of branches per individual IBA1+ cell in FOV, and (m) mean cell body volume excluding filaments per IBA1+ cell in FOV. Data are represented as mean ± SEM (n=10–11); groups compared by two-way ANOVA with Tukey’s post-hoc test to examine biologically relevant interactions unless otherwise noted; *p < 0.05, **p < 0.01, ***p < 0.001, ****p < 0.0001).
Fig. 3:
Fig. 3:. Spatial transcriptomic analysis reveals reversal of disease-associated genetic changes following microglial replacement in SD mice.
(a) Image of WT control, Hexb−/− control, bone marrow transplant (BMT)-treated Hexb−/−, and BMT + colony-stimulating factor 1 receptor inhibitor (CSF1Ri)-treated Hexb−/− groups (n=3/group) distributed across 2 slides for spatial transcriptomic analysis, imaged for cell segmentation markers histone (green), DAPI (grey), and GFAP (magenta). (b) Uniform Manifold Approximation and Projection (UMAP) of 389,585 cells across 12 brains. Clustering at 1.0 resolution yielded 38 clusters, which were annotated with a combination of automated and manual approaches with reference to Allen Brain Atlas singe-cell RNA-seq cell types, gene expression, and anatomical location in space. (c) Violin plot of Hexb transcript counts in cell types in all cells from all groups, demonstrating myeloid-specific Hexb expression. (d) Bar graph of proportions of cell counts by subcluster per group. (e) Comparison matrix scatterplot of the average difference in all significant genes (i.e., padj < 0.05) in inhibitory neurons, excitatory neurons, oligodendrocytes, astrocytes, and myeloid cells between Hexb−/− control vs. WT control and BMT + CSF1Ri-treated Hexb−/− vs. Hexb−/− control. Inversely correlated genes (yellow) occur in opposite directions for each comparison, while directly correlated genes (blue) occur in the same direction for both comparisons. A linear regression line shows the relationship between the two comparisons. (f) The monocyte/macrophage (mono/mac) subcluster (black) overlaid above representative BMT-treated and BMT + CSF1Ri-treated Hexb−/− brains plotted in XY space. (g) Hexb-expressing cells (blue) plotted in XY space in representative brains from WT control, Hexb−/− control, BMT-treated Hexb−/−, and BMT + CSF1Ri-treated Hexb−/− mice. Cells were sized in accordance with Hexb-expression level, assessed by number of transcripts detected within each cell: cells with 0 transcripts were not plotted, cells with 1 detected transcript were plotted at a point size of 0.001, cells with 2 detected transcripts were plotted at a point size of 0.15, and cells with 3 or more detected transcripts were plotted at a point size of 0.3. (h) Projection of subclusters in XY space colored by DEG score calculated in comparison to WT controls in representative BMT-treated Hexb−/− and BMT + CSF1Ri-treated Hexb−/− brains. Following DGE analysis, DEG score was calculated using results of DGE analysis from treatment condition pairs (i.e., BMT-treated Hexb−/− vs. WT control, BMT + CSF1Ri-treated Hexb−/− vs. WT control) in each subcluster by summing the absolute value of the log2 fold change values for all DEGs identified between WT control and BMT-treated Hexb−/− or BMT + CSF1Ri-treated Hexb−/− with a padj value below 0.05. (i) Dot plot representing pseudo-bulked expression values across the four animal groups (WT control, Hexb−/− control, Hexb−/− BMT-treated, and Hexb−/− BMT + CSF1Ri-treated) in genes related to monocytes/macrophage identity, myeloid cell activation, and apotosis and/or cellular stress in excitatory neurons, inhibitory neurons, and oligodendrocytes.
Fig. 4:
Fig. 4:. Spatial proteomic analysis identifies disease-associated protein expression patterns in the SD mouse brain which are reversed with microglial replacement.
(a) Workflow for targeted 67-plex single-cell spatial proteomics. Fields-of-view (FOVs) are imaged with cell segmentation markers GFAP, NEUN, RPS6, and IBA1. Protein abundance is determined by quantification of fluorescently-labelled oligos bound to proteins within each cell. Cell types are identified using the CELESTA algorithm, which classifies cells based using expression of marker proteins. (b) Cell types plotted in XY space in representative WT control brain. 1,199,876 cells were captured across the four groups (WT control, Hexb−/− control, BMT-treated Hexb−/−, and BMT + CSF1Ri-treated Hexb−/− [n=4/group]). CELESTA cell classification yielded 13 cell types, which were plotted in space to confirm accurate identification. (c) Bubble plots of differentially expressed proteins (DEPs) of interest between pairs Hexb−/− control vs. WT control, and BMT + CSF1Ri-treated Hexb−/− vs. Hexb−/− control in neurons and myeloid cells. Dots are sized by p value (−log10p value) and colored by average difference (log2 fold change, red indicating increased expression, blue indicating decreased expression) of each DEP. (d-g) Representative whole brain images of WT control, Hexb−/− control, BMT-treated Hexb−/−, and BMT + CSF1Ri-treated Hexb−/− brains and expanded insets showing cellular marker colocalization of proteins (d) Cathepsin B (purple), colocalization with NeuN+ neurons (green) and not IBA1+ myeloid cells (magenta); (e) alipoprotein e (APOE, cyan), colocalization with both NeuN+ neurons (green) and IBA1+ myeloid cells (magenta); (f) Ubiquitin (green), colocalization with NeuN+ neurons (yellow) and not IBA1+ myeloid cells (magenta); (g) CD68 (yellow), colocalization with IBA1+ myeloid cells (magenta) with DAPI (grey) illustrating the rescue of pathological and lysosomal phenotypes by combined BMT and CSF1Ri treatment.
Fig. 5:
Fig. 5:. Brain pathological changes in neurons associated with loss of Hexb are rescued following combined BMT and CSF1Ri treatment.
(a) Representative whole brain sagittal sections and (b) 10x brightfield images of the cortex stained for Periodic acid Schiff (PAS, purple), a method to detect glycolipids, in the brains of wildtype (WT), Hexb−/−, bone marrow transplant (BMT)-treated Hexb−/−, and BMT + colony-stimulating factor 1 receptor inhibitor (CSF1Ri)-treated Hexb−/− mice. (c) Bar graph of quantification of PAS staining in the cortex of WT, BMT-treated WT, BMT + CSF1Ri-treated WT, Hexb−/−, BMT-treated Hexb−/−, and BMT + CSF1Ri-treated Hexb−/− mice illustrating the rescue of pathological glycolipid accumulation by combined BMT and CSF1Ri treatment. (d) Representative whole brain images of sagittal sections stained for lysosomal-associated membrane protein 1 (LAMP1, cyan), a marker for lysosomes, in WT, Hexb−/−, BMT-treated Hexb−/−, and BMT + CSF1Ri-treated Hexb−/− mice. CTX, cortex; HPF, hippocampal formation; CB, cerebellum; MB, midbrain; TH, thalamus. (e) Representative immunofluorescence confocal images of LAMP1 (cyan) and NeuN (magenta), a marker for neurons, staining in the cortex of WT, Hexb−/−, BMT-treated Hexb−/−, and BMT + CSF1Ri-treated Hexb−/− mice. Insert (f) represents a higher resolution confocal image highlighting the co-localization (white) of LAMP1+ staining within NeuN+ neurons in Hexb−/− and BMT-treated Hexb−/− mice. (g) Bar graph of quantification of co-localized LAMP1+ and NeuN+ staining in confocal images of the cortex of WT, BMT-treated WT, BMT + CSF1Ri-treated WT, Hexb−/−, BMT-treated Hexb−/−, and BMT + CSF1Ri-treated Hexb−/− mice. (h) Representative immunofluorescence confocal images of the cortex in WT, Hexb−/−, BMT-treated Hexb−/−, and BMT + CSF1Ri-treated Hexb−/− mice stained for parvalbumin (PV, red). Inset (i) represents a higher resolution confocal images within cortex in WT, Hexb−/−, BMT-treated Hexb−/− and BMT + CSF1Ri-treated Hexb−/− mice showing the presence of enlarged holes or vacuoles within PV+ cells in the cortex of Hexb−/− and BMT-treated Hexb−/− brains. (j) Bar graph of quantification of vacuoles within PV+ neurons in confocal images of cortex of WT, BMT-treated WT, BMT + CSF1Ri-treated WT, Hexb−/−, BMT-treated Hexb−/−, and BMT + CSF1Ri-treated Hexb−/− mice. Data are represented as mean ± SEM (n=10–11; groups compared by two-way ANOVA with Tukey post hoc testing; *p < 0.05, ** p < 0.01, *** p < 0.001, ****p < 0.0001).
Fig. 6:
Fig. 6:. Peripheral changes associated with loss of Hexb are rescued with BMT.
(a) Representative confocal images of liver sections from WT, Hexb−/−, bone marrow transplant (BMT)-treated Hexb−/−, and BMT + colony-stimulating factor 1 receptor inhibitor (CSF1Ri)-treated mice immunolabeled for green fluorescent protein (GFP, green). (b) Bar graph of quantification of GFP+ cells (spots) in liver images from WT, BMT-treated WT, BMT + CSF1Ri-treated WT, Hexb−/−, BMT-treated Hexb−/−, and BMT + CSF1Ri-treated Hexb−/− mice showing engraftment of cells derived from CAG-EGFP bone marrow donors with BMT treatment. (c) Representative confocal images of liver sections from WT, Hexb−/−, bone BMT-treated Hexb−/−, and BMT + CSF1Ri-treated Hexb−/− mice immunolabeled for lysosomal-associated membrane protein 1 (LAMP1, cyan). d) Bar graph of quantification of LAMP1+ volume in liver images from WT, BMT-treated WT, BMT + CSF1Ri-treated WT, Hexb−/−, BMT-treated Hexb−/−, and BMT + CSF1Ri-treated Hexb−/− mice. (e) Expanded and cropped whole-liver brightfield images stained for Periodic acid Schiff (PAS, purple), a method to detect glycolipids, in WT, Hexb−/−, bone BMT-treated Hexb−/−, and BMT + CSF1Ri-treated Hexb−/− mice. (f) Bar graph of quantification of PAS staining in imagrs of the liver of WT, BMT-treated WT, BMT + CSF1Ri-treated WT, Hexb−/−, BMT-treated Hexb−/−, and BMT + CSF1Ri-treated Hexb−/− mice illustrating the rescue of pathological glycolipid accumulation by BMT. (g) Measurement of plasma neurofilament light (NfL) in WT, BMT-treated WT, BMT + CSF1Ri-treated WT, Hexb−/−, BMT-treated Hexb−/−, and BMT + CSF1Ri-treated Hexb−/− mice. (h) Measurement of total plasma cholesterol (CHOL) concentration in WT, BMT-treated WT, BMT + CSF1Ri-treated WT, Hexb−/−, BMT-treated Hexb−/−, and BMT + CSF1Ri-treated Hexb−/− mice. (i) Measurement of total plasma cholesterol (CHOL) concentration in WT, BMT-treated WT, BMT + CSF1Ri-treated WT, Hexb−/−, BMT-treated Hexb−/−, and BMT + CSF1Ri-treated Hexb−/− mice. Data are represented as mean ± SEM (n=6–8, livers; n=5–11, plasma); groups compared by two-way ANOVA with Tukey’s post-hoc test to examine biologically relevant interactions unless otherwise noted; *p < 0.05, **p < 0.01, ***p < 0.001, ****p < 0.0001). HDL measurement was unable to be obtained in some samples due to high heme content in plasma.
Fig. 7:
Fig. 7:. Hexβ is restored in an exracellular-enriched brain protein fraction in Hexb−/− mice treated microglial replacement, and is secreted by microglia and taken up by neurons in vitro
(a) Schematic of protein fraction collection. Pulverized fresh-frozen hemispheres from WT, Hexb−/−, bone marrow transplant (BMT)-treated Hexb−/−, and BMT + colony-stimulating factor 1 receptor inhibitor (CSF1Ri)-treated mice were homogenized in a high-salt, detergent-free buffer to limit cell lysis and enrich for extracellular proteins. Supernatant was collected as the salt-soluble fraction. The pellet was then resuspended in a detergent-containing buffer to lyse cells and supernatant was collected as the detergent-soluble fraction. (b) Bar graph of absorbance values from β-hexosaminidase (Hexβ) enzymatic activity assay normalized to protein concentration in reassembly buffer (RAB) salt-solube protein fraction in WT, Hexb−/−, bone BMT-treated Hexb−/−, and BMT + CSF1Ri-treated Hexb−/− mice. (c) Bar graph of Hexβ activity normalized to protein concentration in Total Protein Extraction Reagent (T-PER) buffer detergent-solube protein fraction in WT, Hexb−/−, bone BMT-treated Hexb−/−, and BMT + CSF1Ri-treated Hexb−/− mice. (d) Schematic of in vitro primary microglial experiments. For inhibitor experiments, cultured primary microglia derived from mouse neonates were incubated with inhibitors of lysosomal exocytosis (Vacuolin), calcium (Ca2+) signaling (BAPTA), or lysosomal exocytosis (GW4869) for 6 hours. For lipopolysaccharide (LPS) and adenoside triphosphate (ATP) experiments, cells were primed with LPS for 3 hours, incubated with an inhibitor of the P2X7 purinergic receptor (A-804598) for 10 minutes, and treated with ATP for 20 minutes. Hexβ activity in media and cell lysate was then assed using a Hexβ enzymatic activity assay. (e) Hexβ activity assay measured by absorbance value in culture media only and culture media collected from primary microglial cultures demonstrating in vitro secretion of Hexβ from microglia. Groups compaired using an unpaired Student’s T test. (f) Bar graph of Hexβ release measured as a ratio of Hexβ activity in supernatant (cell culture media) normalized to Hexβ activity in cell lysate in cultured primary microglia treated with dimethyl sulfoxide (DMSO, control), vacuolin, GW869, BAPTA, vacuolin + GW869, vacuolin + BAPTA, or BAPTA + GW869. (g) Bar graph of Hexβ release measured as a ratio of Hexβ activity in supernatant (cell culture media) normalized to Hexβ activity in cell lysate in cultured primary microglia treated with DMSO (control), LPS, ATP, LPS + ATP, LPS + ATP + A-804598, or A-804598 alone. (h) Bar graph Hexβ activity assay measured by absorbance value in media only and media containing his-tagged recombinant Hexβ protein, demonstrating that the his-tagged Hexβ protein is enzymatically active. Groups compaired using an unpaired Student’s T test. (i) Confocal images of mouse hippocampal neurons treated with media containing his-tagged Hexβ protein immunolabeled for neurons (NeuN, magenta), lysosomal-associated membrane protein 1 (LAMP1, cyan), his-tagged Hexβ protein (HIS-TAG, yellow), and a merged image showing orthogonal x/z and z/y projections at top and right of image showing colocalization of LAMP1+ and HIS-TAG+ stainging within NeuN+ neurons (white). (j) Bar graph representing the percentage of neurons with intracellular incorporation of his-tagged Hexβ protein as identified by orthogonal imaging of HIS-TAG staining within NeuN+ neurons. Shows percentage of imaged neurons without intracellular his-tagged Hexβ staining and neurons with intracellular his-tagged Hexβ staining. Data are represented as mean ± SEM (n=10–11, protein fractions; n=4–5, in vitro activity assay; n=12–13, neuronal cultures); groups compared by two-way ANOVA with Tukey’s post-hoc test to examine biologically relevant interactions unless otherwise noted; *p < 0.05, **p < 0.01, ***p < 0.001, ****p < 0.0001).

Similar articles

References

    1. Platt F. M., d’Azzo A., Davidson B. L., Neufeld E. F. & Tifft C. J. Lysosomal storage diseases. Nat. Rev. Dis. Primer 4, 1–25 (2018). - PubMed
    1. Fuller M., Meikle P. J. & Hopwood J. J. Epidemiology of lysosomal storage diseases: an overview. in Fabry Disease: Perspectives from 5 Years of FOS (eds. Mehta A., Beck M. & Sunder-Plassmann G.) (Oxford PharmaGenesis, Oxford, 2006). - PubMed
    1. Huang J. Q. et al. Apoptotic cell death in mouse models of GM2 gangliosidosis and observations on human Tay-Sachs and Sandhoff diseases. Hum. Mol. Genet. 6, 1879–1885 (1997). - PubMed
    1. Conzelmann E. & Sandhoff K. Purification and characterization of an activator protein for the degradation of glycolipids GM2 and GA2 by hexosaminidase A. Hoppe. Seylers Z. Physiol. Chem. 360, 1837–1849 (1979). - PubMed
    1. Robinson D. & Stirling J. L. N-Acetyl-beta-glucosaminidases in human spleen. Biochem. J. 107, 321–327 (1968). - PMC - PubMed

Publication types