[Preprint]. 2024 Oct 23:2024.10.23.619681.
doi: 10.1101/2024.10.23.619681.

Decoding the transcriptomic signatures of psychological trauma in human cortex and amygdala

Affiliations

Decoding the transcriptomic signatures of psychological trauma in human cortex and amygdala

Emily M Hicks et al. bioRxiv. .

Abstract

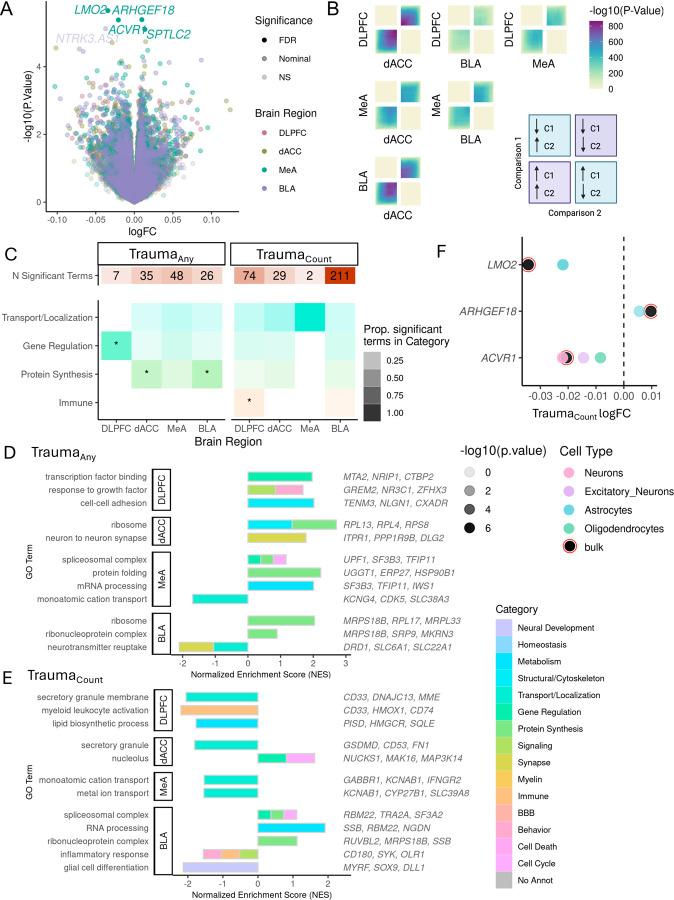
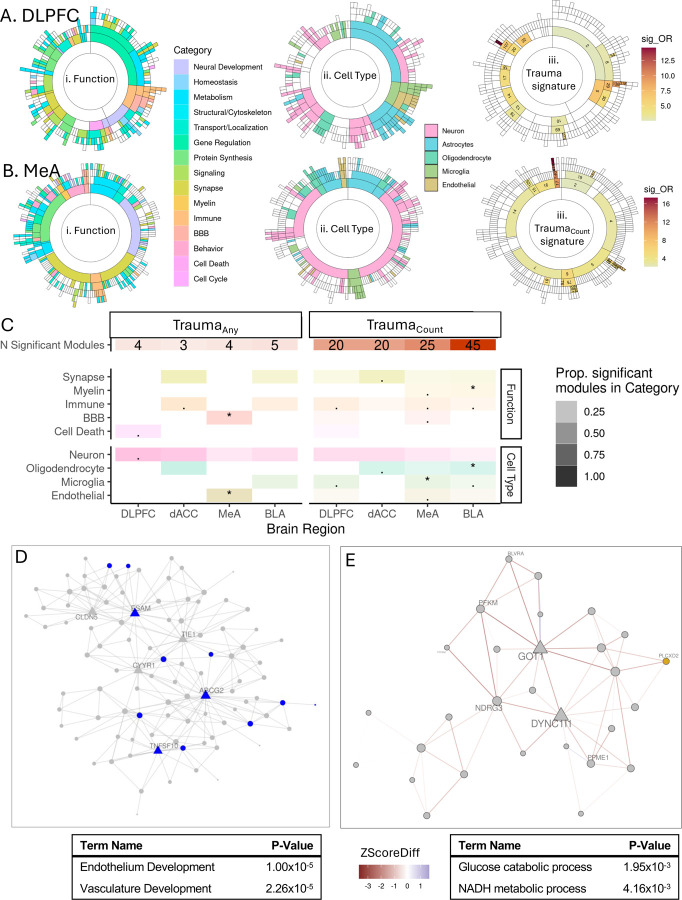
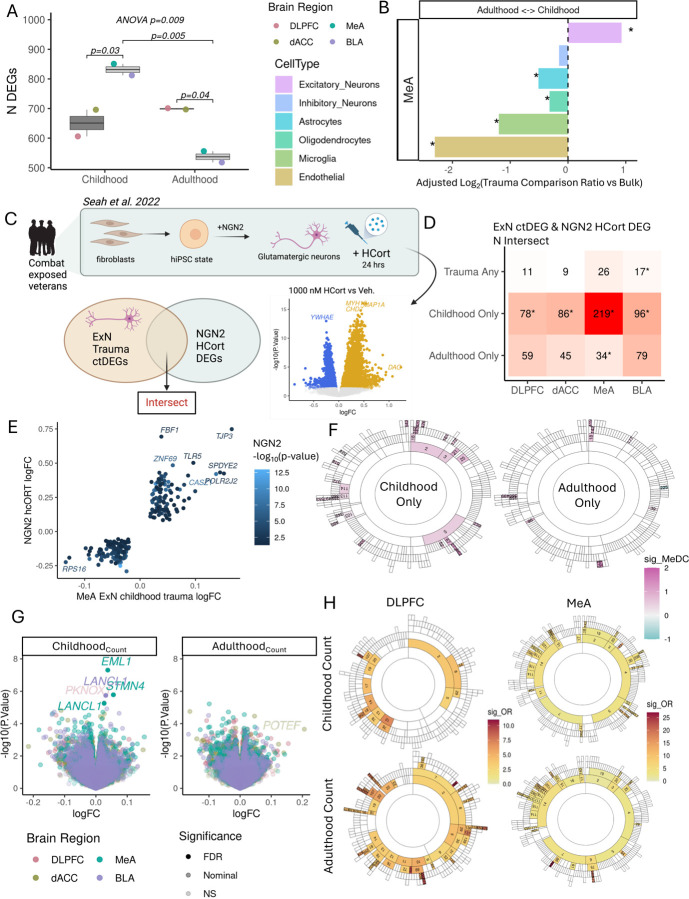
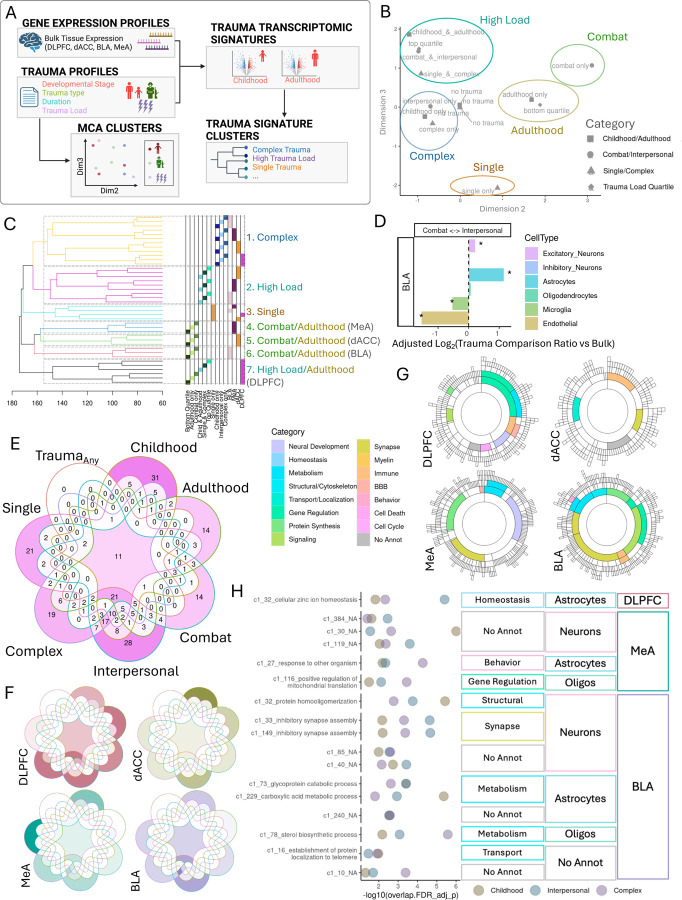
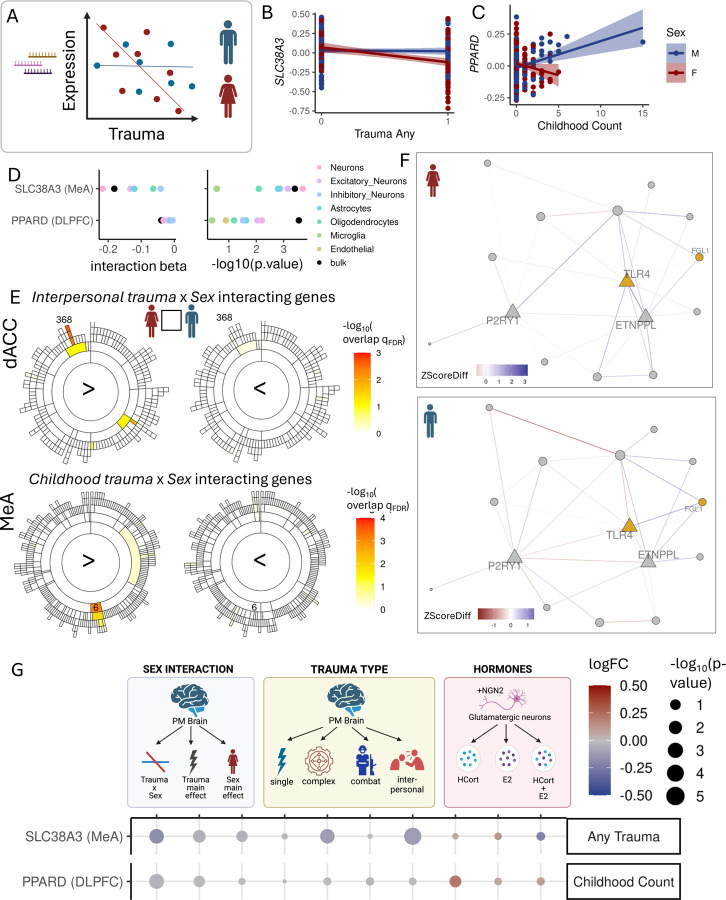
Psychological trauma has profound effects on brain function and precipitates psychiatric disorders in vulnerable individuals, however, the molecular mechanisms linking trauma with psychiatric risk remain incompletely understood. Using RNA-seq data postmortem brain tissue of a cohort of 304 donors (N=136 with trauma exposure), we investigated transcriptional signatures of trauma exposures in two cortical regions (dorsolateral prefrontal cortex, and dorsal anterior cingulate cortex) and two amygdala regions (medial amygdala and basolateral amygdala) associated with stress processing and regulation. We focused on dissecting heterogeneity of traumatic experiences in these transcriptional signatures by investigating exposure to several trauma types (childhood, adulthood, complex, single acute, combat, and interpersonal traumas) and interactions with sex. Overall, amygdala regions were more vulnerable to childhood traumas, whereas cortical regions were more vulnerable to adulthood trauma (regardless of childhood experience). Using cell-type-specific expression imputation, we identified a strong transcriptional response of medial amygdala excitatory neurons to childhood trauma, which coincided with dysregulation observed in a human induced pluripotent stem cell (hiPSC)-derived glutamatergic neurons exposed to hydrocortisone. We resolved multiscale coexpression networks for each brain region and identified modules enriched in trauma signatures and whose connectivity was altered with trauma. Trauma-associated coexpression modules provide insight into coordinated functional dysregulation with different traumas and point to potential gene targets for further dissection. Together, these data provide a characterization of the long-lasting human encoding of traumatic experiences in corticolimbic regions of human brain.


Conflict of interest statement

CONFLICT STATEMENT J.H.K. has consulting agreements (less than US$10,000 per year) with the following: Aptinyx, Inc. Biogen, Idec, MA, Bionomics, Limited (Australia), Boehringer Ingelheim International, Epiodyne, Inc., EpiVario, Inc., Janssen Research & Development, Jazz Pharmaceuticals, Inc., Otsuka America Pharmaceutical, Inc., Spring Care, Inc., Sunovion Pharmaceuticals, Inc.; is the co-founder for Freedom Biosciences, Inc.; serves on the scientific advisory boards of Biohaven Pharmaceuticals, BioXcel Therapeutics, Inc. (Clinical Advisory Board), Cerevel Therapeutics, LLC, Delix Therapeutics, Inc., Eisai, Inc., EpiVario, Inc., Jazz Pharmaceuticals, Inc., Neumora Therapeutics, Inc., Neurocrine Biosciences, Inc., Novartis Pharmaceuticals Corporation, PsychoGenics, Inc., Takeda Pharmaceuticals, Tempero Bio, Inc., Terran Biosciences, Inc..; has stock options with Biohaven Pharmaceuticals Medical Sciences, Cartego Therapeutics, Damona Pharmaceuticals, Delix Therapeutics, EpiVario, Inc., Neumora Therapeutics, Inc., Rest Therapeutics, Tempero Bio, Inc., Terran Biosciences, Inc., Tetricus, Inc.; and is editor of Biological Psychiatry with income greater than $10,000.

Figures

Figure 1.
Figure 1.
Transcriptional signatures of trauma exposure (Traumaany) and accumulation (TraumaCount). A. Gene-level expression associations with cumulative trauma (traumaCount). Log-fold-change (logFC) values associated with each additional trauma (1 unit increase in trauma load) and −log10 transformed raw p-values for each gene is shown. FDR significance < 5% and nominal significance is p< 0.05. Only trauma-leading gene associations are highlighted and included in follow up analyses. DLPFC = Dorsolateral prefrontal cortex, dACC=dorsal anterior cingulate cortex, MeA=Medial amygdala, BLA= basolateral amygdala. B. Concordance of traumaCount transcriptional signatures for each brain region pair evaluated by stratified rank-rank hypergeometric overlap (RRHO) analysis. Bottom left quadrant indicates genes upregulated with trauma in both regions, upper right quadrant indicates genes downregulated with trauma in both regions. C. Gene Ontology term enrichment summary. Number of significant GO terms for each brain region for traumaAny and traumaCount. Overrepresentation of significant GO terms by functional category. Shading of tile indicates proportion of significant GO terms in each category over the total number of significant terms for each brain region and trauma measure. Categories significantly overrepresented (qFDR < 0.05) indicated with asterisk (*). D-E. Representative significant GO term associations from gene set enrichment analysis for traumaAny (D) or trauma Count (E) signature (p < 0.05 trauma-leading genes) for each brain region. Normalized enrichment score indicates degree of enrichment with positive direction indicating an enrichment of upregulated trauma genes and negative direction indicating an enrichment of downregulated trauma genes. Color of bar indicates functional category. F. Cell type differentially expressed genes (ctDEG) in association with traumaCount. Number of nominally significant (p<0.05) trauma-leading differentially expressed gene associations for each cell type (color bars) and brain region. G. MeA traumaCount gene associations from bulk analyses are driven by specific cell types. Gene-level logFC estimates from bulk tissue expression (black with red circle) and from imputed cell type expression (color points). Only nominally significant (p<0.05) estimates shown.
Figure 2.
Figure 2.
Trauma transcriptional signatures enrich in gene coexpression modules and alter coexpression relationships. A. Sunburst plot representing module hierarchy of DLPFC coexpression network where each arc represents a module. Functional category annotations (i), cell type annotations (ii) and enrichment odds ratio for modules significantly enriched (qFDR < 0.05) for traumaCount signature genes(iii). B. Sunburst plot representing module hierarchy of MeA coexpression network where each arc represents a module. Functional category annotations (i), cell type annotations (ii) and enrichments for traumaCount signature genes(iii) for each module. C. Module enrichment summary. Number of significantly enriched for each brain region for traumaAny and traumaCount. Overrepresentation of significant modules by functional category. Transparency of tile indicates proportion of significant modules in each category over the total number of significant moduels for each brain region and trauma measure. Categories significantly overrepresented (qFDR < 0.05) indicated with an asterisk (*). D. MeA module 140 enriched for MeA traumaCount signature genes. Nodes represent module member genes and hubs genes are depicted as triangles. Genes downregulated with traumaCount are shown in blue. Significant enriched GO terms of module and enrichment p-value shown. E. DLPFC module 224 is differentially correlated with traumaAny. Nodes represent module member genes and hubs genes are depicted as triangles. Edges indicate change in gene-gene-correlation (ZScoreDiff) between no trauma and trauma conditions. Negative ZScoreDiff indicates a decrease in correlation with traumaAny. Genes upregulated (yellow) and downregulated (blue) with traumaAny are colored. Significant enriched GO terms of module and enrichment p-value shown.
Figure 3.
Figure 3.
Childhood trauma and adulthood trauma have distinct transcriptional signatures. A. Number of childhood and adulthood DEGs (p <0.05) by brain region. Pvalues for two-way ANOVA and post-hoc Tukey for pairwise comparisons are annotated. DLPFC = Dorsolateral prefrontal cortex, dACC=dorsal anterior cingulate cortex, MeA=Medial amygdala, BLA= basolateral amygdala. B. MeA cell types are differentially responsive to childhood trauma compared to adulthood trauma. Log-transformed ratio of number of childhood ctDEGs over number of adulthood ctDEGs for each cell type (color bar) and adjusted for proportion of bulk childhood DEGs over bulk adulthood DEGs. Significant enrichment of number of childhood (positive value) or adulthood DEGS (negative value) by exact binomial test for deviation from bulk proportion with qFDR< 0.05 (*). C. Schematic of experiment applying 1000nM HCort to iPSCs-derived glutamatergic neurons and differentially expressed genes from Seah et al. 2022 and intersect of genes from Seah et al. 2022 and trauma ctDEGs from excitatory neurons (ExN) used in D. D. Intersect of genes from HCort DEGs (C) and ctDEGs from excitatory neurons (ExN) with respect to traumaany, childhood only and adulthood only across four brain regions. E. Concordantly regulated NGN2 HCort and MeA ExN childhood trauma genes by logFC. F. Childhood (left) and adulthood trauma (right) alter gene coexpression relationships among MeA coexpression modules. Significant differential correlated modules (DCMs; qFDR < 0.05) are filled with module median differential connectivity score (MeDC) with negative values (cyan) indicating a loss of correlation among module member gene coexpression with traumaAny and positive values (pink) indicating a gain of correlation.G. Gene-level expression associations with childhood trauma count (i) and adulthood trauma count (ii). Each point represents a gene, with the log-transformed fold change (logFC) per increase in 1 trauma on the x-axis and the −log10 transformed raw p-value on the y-axis. FDR significance < 5% and nominal significance is p< 0.05. Only trauma-leading gene associations are highlighted and included in follow up analyses. H. DLPFC and MeA modules and enrichment odds ratios for modules significantly enriched (qFDR < 0.05) for childhoodCount and adulthoodCount signature genes.
Figure 4.
Figure 4.
Trauma types have shared and distinct transcriptional signatures A. Analysis of trauma variable profiles and their transcriptomic signatures. B. Multiple correspondence analysis (MCA) of donor trauma profiles. Dimensions 2 and 3 reveal clusters of similar trauma variable categories, which we categorize into five MCA clusters: High load, complex traumas, adulthood, single and combat. C. Hierarchical clustering of trauma variable category transcriptional signatures. Clustering heights are shown on the x axis. Trauma variable and brain region for each transcriptomic signature is annotated to the right by color and in text with congruent MCA clustering categories. Dashed rectangles designate trauma transcriptional signature clusters. D. Log-transformed ratio of number of interpersonal ctDEGs over number of combat ctDEGs for each cell type (color bar) and adjusted for proportion of bulk interpersonal DEGs over bulk combat DEGs. Significant enrichment of number of interpersonal (positive value) or combat DEGS (negative value) by exact binomial test for deviation from bulk proportion with qFDR< 0.05 (*). E-F. Intersections of the number of modules enriched for each trauma type signature for all brain regions combined (E) and separated by brain region (F). G. Modules commonly enriched for all 6 trauma types (childhood, adulthood, combat, interpersonal, complex and single trauma) and colored by annotated functional category. H. Modules commonly enriched for childhood, interpersonal and complex trauma signatures. Module enrichment log-transformed FDR-adjusted p-value shown for each trauma signature (color). Brain region, cell type and functional annotations shown. Modules are labeled with significant (qFDR< 0.05) GO term with the lowest pvalue.
Figure 5.
Figure 5.
Sex moderates the impact of trauma on the transcriptome and gene-coexpression networks. A. Interaction effect of sex and trauma on gene expression. B. SLC38A3 expression (residualized) with trauma exposure in females (red) and males (blue). C. DLX5 expression (residualized) in males (blue) and females (red) with single only, complex only, both single & complex trauma or no trauma. D. Sex-interaction term estimates (left) and log transformed pvalues (right) for SLC38A3 with trauma exposure and DLX5 with single trauma from bulk tissue expression (black with red circle) and from imputed cell type expression (colored points). E. Enrichment pvalues of sex-interactive interpersonal trauma genes (top) or childhood trauma genes (bottom) with relative upregulated in females (left) vs relative upregulation in males (right) in dACC (top) or MeA (bottom) multi-scale coexpression modules. F. Coexpression network graph of dACC module 368. Nodes are colored by significant sex-interacting genes (yellow = upregulate in females) and edges are colored by the SE normalized difference in the correlation (ZscoreDiff) interpersonal trauma only to no trauma condition in females (top) and in males (bottom). ZscoreDiff>0 indicates a gain in correlation in expression of the two node genes with trauma and ZscoreDiff<0 indicates a loss of correlation. G. Gene expression association estimates for 2 significant sex-interacting genes (y-axis) in various contexts (x-axis). From this dataset: sex-interaction term estimate with trauma variable category (righthand box), main effect of trauma variable category, main effect of sex, main effect of single trauma, complex trauma, combat trauma, and interpersonal trauma. From RNA seq of human NGN2 neurons derived from induced pluripotent stem cells with in vitro exposure to hydrocortisone (HCort), estradiol (E2) or a combination of both (HCort+E2). Point color indicates the logFC value and size indicates −log10 transformed pvalues of those estimates.

References

    1. Girgenti M. J., Pothula S. & Newton S. S. Stress and Its Impact on the Transcriptome. Biol. Psychiatry 90, 102–108 (2021). - PMC - PubMed
    1. Hicks E. M. et al. Integrating genetics and transcriptomics to study major depressive disorder: a conceptual framework, bioinformatic approaches, and recent findings. Transl. Psychiatry 13, 129 (2023). - PMC - PubMed
    1. Nievergelt C. M. et al. Genome-wide association analyses identify 95 risk loci and provide insights into the neurobiology of post-traumatic stress disorder. Nat. Genet. 56, 792–808 (2024). - PMC - PubMed
    1. Tovote P., Fadok J. P. & Lüthi A. Neuronal circuits for fear and anxiety. Nat. Rev. Neurosci. 16, 317–331 (2015). - PubMed
    1. Herman J. P. The neuroendocrinology of stress: Glucocorticoid signaling mechanisms. Psychoneuroendocrinology 137, 105641 (2022). - PubMed

Publication types

LinkOut - more resources